Market Overview
| Study Period | 2020 - 2031 |
|---|---|
| Forecast Data Period | 2026 - 2031 |
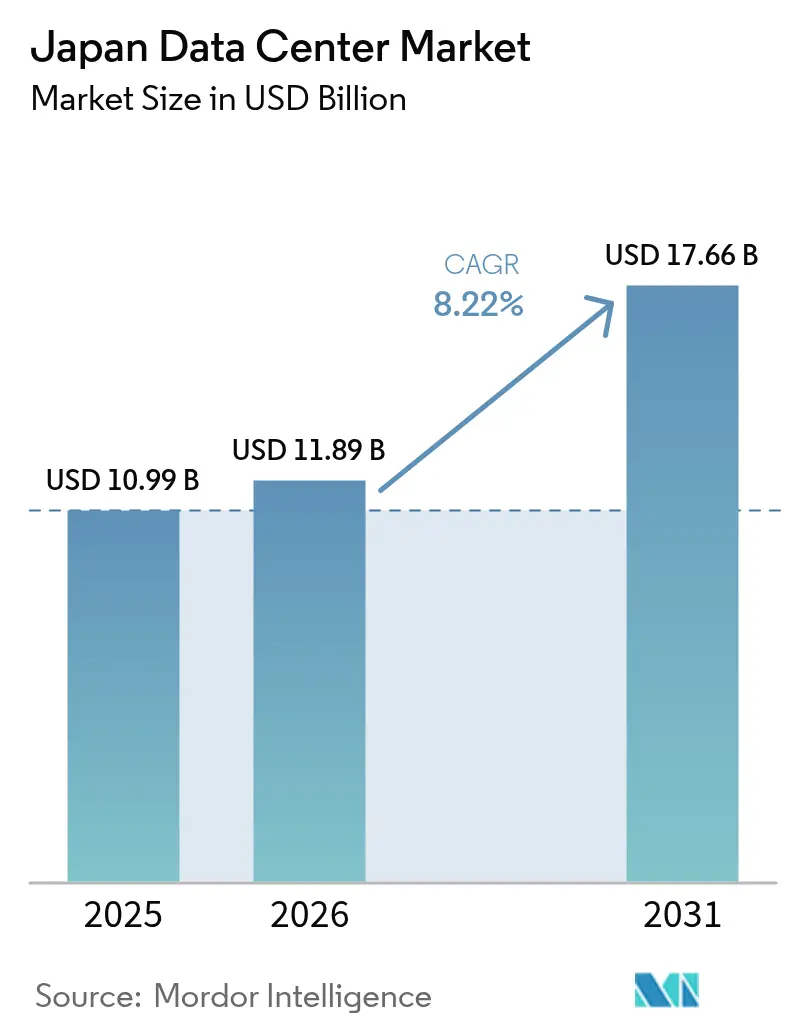
| Base Year Market Size (2025) | USD 10.99 Billion |
| Market Size (2026) | USD 11.89 Billion |
| Market Size (2031) | USD 17.66 Billion |
| Growth Rate (2026 - 2031) | 8.22% CAGR |
| Market Concentration | Medium |
Major Players *Disclaimer: Major Players sorted in no particular order Image © Mordor Intelligence. Reuse requires attribution under CC BY 4.0. | |
Japan Data Center Market Analysis by Mordor Intelligence
The Japan Data Center Market size is expected to grow from USD 10.99 billion in 2025 to USD 11.89 billion in 2026 and is forecast to reach USD 17.66 billion by 2031 at 8.22% CAGR over 2026-2031. In terms of IT load capacity, the market is expected to grow from 3.34 thousand megawatt in 2025 to 6.46 thousand megawatt by 2030, at a CAGR of 14.12% during the forecast period (2025-2030). The market segment shares and estimates are calculated and reported in terms of MW. Fueled by public-sector cloud mandates, hyperscale capital outlays, and proliferating artificial-intelligence workloads, the cluster is already the largest in Asia-Pacific and is on course to consolidate regional primacy. Domestic operators benefit from policy preferences for sovereign cloud while global cloud providers localize capacity to satisfy data-residency rules. Sustained 5G rollout and Internet-of-Things (IoT) adoption intensify edge-computing needs, encouraging medium-scale deployments near population and manufacturing centers. Simultaneously, land scarcity, electricity tariffs and seismic engineering premiums compel developers to optimize facility footprints, innovate in cooling and diversify toward suburban corridors to keep the Japan data center market growth momentum intact.
Key Report Takeaways
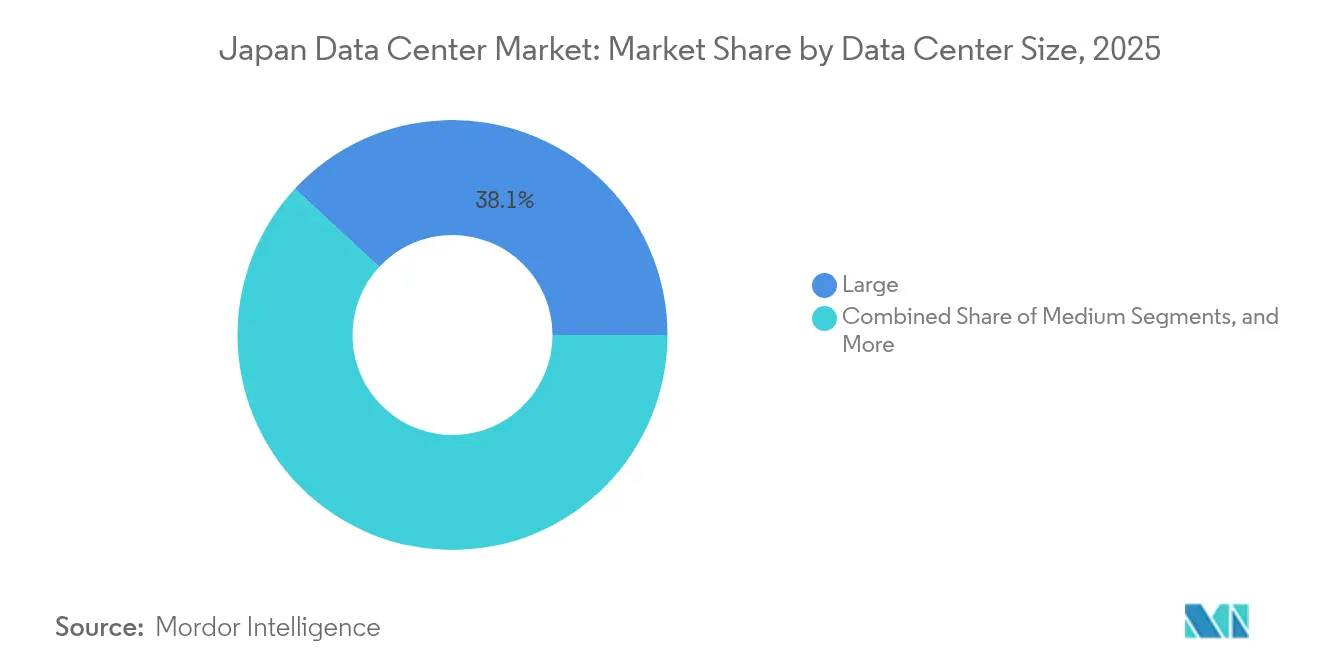
- By data center size, large facilities held 38.10% of Japan data center market share in 2025, while medium facilities are projected to post the highest 12.02% CAGR through 2031.
- By tier type, Tier 3 infrastructure captured 66.05% share of Japan data center market size in 2025 and is advancing at a 15.28% CAGR through 2031.
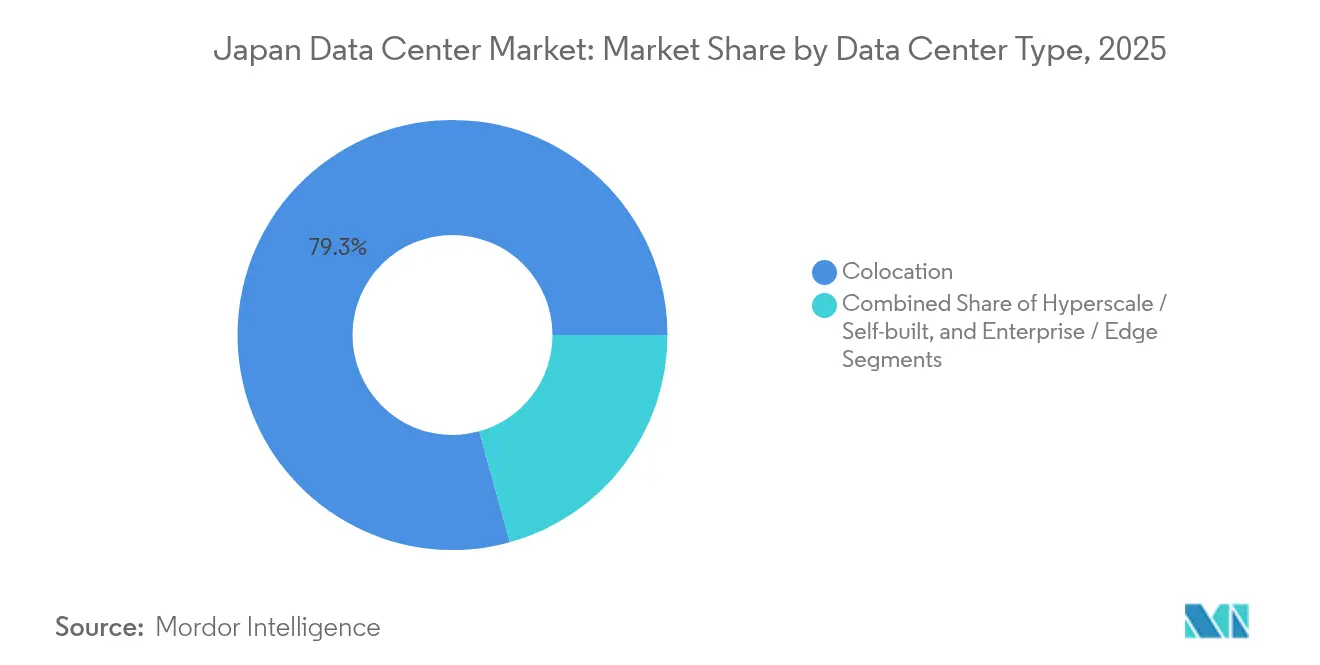
- By facility type, colocation accounted for 79.30% of Japan data center market size in 2025 and is set to expand at a 15.31% CAGR to 2031.
- By end user, IT and telecom commanded 53.20% revenue share in 2025 in the Japan data center market, whereas BFSI is forecast to log the fastest 16.05% CAGR between 2026-2031.
- By hotspot, Tokyo led with 40.70% share in 2025 in the Japan data center market, and Osaka is primed for the quickest 13.28% CAGR during the outlook period.
Note: Market size and forecast figures in this report are generated using Mordor Intelligence’s proprietary estimation framework, updated with the latest available data and insights as of 2026.
Japan Data Center Market Trends and Insights
Drivers Impact Analysis*
| Driver | (~) % Impact on CAGR Forecast | Geographic Relevance | Impact Timelin |
|---|---|---|---|
| Government digital transformation programs accelerating cloud migration | +2.8% | National, focused on Tokyo and Osaka | Medium term (2-4 years) |
| Surge in hyperscale investments to meet AI and OTT traffic growth | +3.2% | Tokyo, Osaka, Inzai and surrounding suburbs | Short term (≤ 2 years) |
| 5G-enabled IoT proliferation driving edge deployments | +2.1% | Urban hubs nationwide | Medium term (2-4 years) |
| Data localisation rules favour domestic capacity additions | +1.9% | Nationwide with sovereign-cloud emphasis | Long term (≥ 4 years) |
| Decommissioning of ageing enterprise sites boosting colocation demand | +2.4% | Tokyo, Osaka and major industrial belts | Short term (≤ 2 years) |
| Municipal waste-heat reuse incentives | +1.8% | Tokyo and Osaka | Long term (≥ 4 years) |
| Source: Mordor Intelligence | |||
Government Digital Transformation Programs Accelerating Cloud Migration
The Digital Agency targets complete migration of central-government workloads to cloud platforms by 2025, creating an anchor tenant for new capacity located inside Japan to preserve data sovereignty. Amazon Web Services has earmarked JPY 2.26 trillion (USD 15.24 billion) through 2027 to scale facilities in Tokyo and Osaka to meet this surge. Similar modernization waves in municipalities and state-owned corporations extend demand into regional prefectures, ensuring that new builds achieve rapid pre-commit rates. Domestic providers gain selection preference in public tenders, while global hyperscalers accelerate joint-venture strategies to satisfy procurement rules. The outcome is a steady pipeline of government workloads that underpins multi-year utilization visibility for the Japan data center market.
Surge in Hyperscale Investments to Meet AI and OTT Traffic Growth
Artificial-intelligence model training pushes power density above 30 kW per rack, prompting Microsoft to pledge USD 2.9 billion for GPU-rich campuses serving Japanese customers. Google’s USD 1 billion Proa and Taihei subsea cables improve trans-Pacific throughput, positioning Tokyo and Osaka as primary aggregation nodes. [1]Google, “Google Invests USD 1 Billion in Subsea Cables to Japan,” cloud.google.comDomestic champion SoftBank collaborates with NVIDIA on AI-optimized halls, reinforcing that high-density compute has become a strategic asset. These commitments shorten supply-demand cycles, compress permitting windows, and intensify competition for scarce megawatt allocations, all of which add tailwinds to Japan data center market expansion.
5G-Enabled IoT Proliferation Driving Edge Deployments
National 5G coverage surpasses 95% population reach in 2025, and NTT DOCOMO’s Open-RAN program embeds AI-powered radio optimization that relies on localized processing. [2]NTT DOCOMO, “Open RAN Initiatives,” nttdocomo.co.jpAutomotive and precision-machinery clusters in Aichi, Shizuoka and Hiroshima pilot latency-sensitive applications, spurring mid-scale sites within 30 km of factories. The Ministry of Internal Affairs and Communications funds research in photonics-electronics convergence that promises 70% lower power draw, making micro-edge deployments financially viable. These dynamics diversify demand away from metropolitan cores and reinforce the medium-facility growth thesis inside the Japan data center market.
Decommissioning of Ageing Enterprise Sites Boosting Colocation Demand
Enterprise self-built rooms average 15 years of age and fall short of modern seismic and energy-efficiency codes, pushing CFOs toward opex-friendly colocation. Tier 3 designs offer 99.982% uptime, satisfying audit requirements without Tier 4 cost premiums, thus widening appeal. Large colocation landlords leverage bulk power contracts and shared cooling infrastructure to deliver 20-30% operating-expense savings versus on-premise halls, accelerating migration pipelines. The result is a virtuous cycle of high occupancy, pricing power and cash flows that support continual expansion in the Japan data center market.
Restraints Impact Analysis*
| Restraint | (~) % Impact on CAGR Forecast | Geographic Relevance | Impact Timeline |
|---|---|---|---|
| Scarcity and high cost of land in prime hotspots | -2.1% | Tokyo and Osaka cores | Short term (≤ 2 years) |
| Elevated electricity tariffs versus regional peers | -1.8% | Nationwide | Medium term (2-4 years) |
| Earthquake and disaster-resilience cost premium | -1.3% | Seismic zones nationwide | Long term (≥ 4 years) |
| Long grid-connection approval lead times | -2.4% | Tokyo, Osaka and other metros | Short term (≤ 2 years) |
| Source: Mordor Intelligence | |||
Scarcity and High Cost of Land in Prime Hotspots
Average land prices in central Tokyo rose 69% during 2024, inflating facility-development budgets and squeezing internal rates of return.[3]Construction Industry Research Institute, “Japan Data Center Construction Cost Analysis 2024,” ciri.or.jp Community pushback in Koto ward underscores social-license barriers, forcing operators to scout suburban areas such as Inzai, where larger parcels exist and municipal incentives improve project economics. While relocation mitigates land cost, it demands parallel investment in dark-fiber routes and redundant sub-stations, elongating project timelines and tempering near-term Japan data center market supply.
Long Grid-Connection Approval Lead Times
Tokyo Electric Power Company reports application queues exceeding 36 months for >10 MW connections as utilities juggle renewable-generation integration with load growth. Project sponsors front-load capital to secure provisional slots, raising working-capital burdens. Some developers install on-site gas turbines and lithium-ion storage to bridge interim periods, yet such hybrids add complexity and heighten construction risk. The bottleneck curbs the cadence of fresh capacity coming online, moderating Japan data center market CAGR potential despite robust demand.
*Our forecasts treat driver/restraint impacts as directional, not additive. The impact forecasts reflect baseline growth, mix effects, and variable interactions.
Segment Analysis
By Data Center Size: Medium Facilities Drive Balanced Growth
Medium-sized halls between 5 MW and 20 MW are on track for a 12.02% CAGR to 2031, outpacing the overall Japan data center market. These footprints deliver economies of scale in cooling and security while retaining siting flexibility that circumvents the land and power constraints dogging mega-campuses. Large-scale sites retain 38.10% share because hyperscalers like Amazon Web Services reserve contiguous land for clusters exceeding 100 MW. Yet the regulatory and community hurdles tied to such projects prolong gestation periods, giving medium builds a speed-to-market edge. The Fukushima AI facility, backed by the Ministry of Economy and Trade illustrates policy support for distributed 15-MW blocks that can be replicated across regions.
Developers favor modular designs that allow phased power rollouts, letting them match capital deployment to contract wins while limiting stranded capacity. Enterprises migrating legacy rooms find the medium footprint ideal for consolidating multiple on-premise sites under one roof. Moreover, edge-compute nodes supporting 5G and IoT often scale within this band, enhancing utilization resilience. Consequently, medium halls are expected to become the volume engine for future Japan data center market size additions, even as hyperscale complexes command headlines.


By Tier Type: Tier 3 Infrastructure Dominates Market Evolution
Tier 3 facilities hold 66.05% share of Japan data center market size in 2025 and are expanding at 15.28% CAGR. Their 99.982% uptime rating meets most audit and disaster-recovery thresholds without incurring the dual utility feeds and concurrent-maintenance redundancy of Tier 4. Operators integrate base-isolation bearings, dampers, and reinforced frames so these halls withstand magnitude-7 quakes while maintaining service levels, a design approach that balances risk and cost. Tier 1 and Tier 2 footprints serve dev-test and non-critical storage use cases, especially in regional sites where power budgets are tighter. Tier 4 remains confined to latency-sensitive trading platforms and core switching sites for telecom carriers due to capex intensity.
Standardization accelerates Tier 3 development. Prefabricated electrical and mechanical skids reduce field labor, compressing build schedules from 24 to 18 months. The model also simplifies regulatory submissions because templates have pre-approved seismic and energy-efficiency calculations. Accordingly, Tier 3 is likely to deepen its lead, anchoring how the Japan data center market architecturally evolves.
By Data Center Type: Colocation Maintains Overwhelming Leadership
Colocation owns 79.30% share and mirrors the overall 15.31% CAGR of the Japan data center market through 2031, as enterprises pivot from asset-heavy strategies to operating-expense models. Retail suites deliver rack-level granularity for small-to-mid-cap companies, whereas wholesale leases cater to multinational corporates aggregating 1-3 MW blocks. Cloud providers also procure powered-shell wholesale capacity to accelerate region launches ahead of self-build completions. Colocation landlords negotiate aggregated power purchases, deploy advanced air-to-liquid cooling and manage compliance programs that single tenants cannot cost-effectively replicate.
Decommissioning of server rooms in office basements accelerates migration. Firms retiring end-of-life UPS and chillers avoid reinvestment, opting for service-level agreements that transfer availability risk to providers. High occupancy in prime campuses sustains price premiums, yet second-ring suburbs present cost-sensitive options. This tiered offer spectrum ensures colocation remains the default choice for incremental Japan data center market demand across verticals.
By End User: BFSI Emerges as Fast-Growing Vertical
The banking, financial services, and insurance segment is projected to clock a 16.05% CAGR, outstripping the headline Japan data center market. The Financial Services Agency’s cloud guidelines demand domestic data residency and audit-ready logs, triggering wholesale migration from offshore zones to in-country halls. Digital payment volumes climbed 29% year-on-year in 2024, requiring scalable, low-latency compute that colocation sites readily supply. IT and telecom still dominate with a 53.20% share as cloud, content, and mobile operators absorb multi-megawatt blocks each procurement cycle.
Emerging demand from online brokerage, insure-tech, and digital-currency exchanges adds steady increments. Government agencies moving to sovereign cloud and manufacturing firms rolling out smart-factory platforms provide further diversification, smoothing occupancy risk for facility owners and cementing the sector’s resilience within the Japan data center market.
Geography Analysis
Tokyo metropolitan area commands 40.70% of Japan data center market size thanks to dense fiber backbones, abundant carrier hotels and direct links into trans-Pacific cables such as Google’s Taihei system. Despite premium rents and multi-year power-connection queues, proximity to corporate headquarters and fintech trading nodes preserves its allure. Operators mitigate land scarcity by stacking floors up to 13 stories and by leasing former industrial parcels in Inzai and Akishima, within 30 km of the urban core.
Osaka is the breakout growth center with an expected 13.28% CAGR to 2031. The Kansai capital offers lower seismic risk, shorter grid-approval cycles and municipal incentives, drawing platform operators that need geographic diversity without sacrificing latency to Tokyo. OPTAGE’s planned Japan-Singapore cable, slated for fiscal-2028 service, will bolster international routes originating on the Pacific side and elevate Osaka’s profile as an alternative gateway. Mitsubishi Estate’s multi-billion-yen commitment to Kansai campuses validates institutional confidence in this corridor.
Prefectures beyond the two mega-regions capture edge and disaster-recovery workloads. The subsidized 15-MW AI data center in Fukushima showcases central government intent to distribute critical digital infrastructure nationwide. Hokkaido’s cooler climate supports free-air cooling economics, while Kyushu leverages ample solar-PV capacity to offset tariff exposure. Collectively, these locales diversify risk in the Japan data center market and unlock fresh demand pools tied to 5G, IoT and regional e-governance programs.
Competitive Landscape
The top five operators combine for roughly 60-65% installed megawatts, indicating moderate concentration. Equinix, NTT Data, KDDI Telehouse, Colt, and Digital Realty leverage long-standing land-bank portfolios, dual utility contracts, and carrier-neutral ecosystems that newer entrants find difficult to replicate. Equinix’s waste-heat export pilot channels exhaust air into local district-heating loops, aligning with tightening carbon-reduction ordinances. NTT fortifies edge presence through micro-modular builds inside its telecom exchanges, speeding service rollout for 5G operators.
Hyperscalers alter the playing field by self-building campuses exceeding 100 MW or by pre-leasing entire wholesale blocks years in advance. Their entry pressures incumbents to raise capital and sharpen differentiation around sustainability, interconnection density, and compliance support. Domestic real-estate conglomerates form alliances with specialized operators, exemplified by Gaw Capital and GDS’s Fuchu project, to combine zoning know-how with operational expertise.
Strategic priorities coalesce around renewable-energy procurement, advanced liquid cooling for AI racks, and seismic-resilient engineering. Operators also pursue dark-fiber investments and submarine-cable participations to guarantee route diversity, an emerging competitive lever as AI model training saturates existing trans-Pacific links. Overall, innovation capacity, capital access and regulatory fluency will dictate share gains in the Japan data center market.
Japan Data Center Industry Leaders
Digital Realty Trust Inc.
Equinix Inc.
IDC Frontier Inc. (SoftBank Group)
NTT Ltd
NEC Corporation
- *Disclaimer: Major Players sorted in no particular order


Recent Industry Developments
- September 2025: OPTAGE enhanced connectivity for its Osaka Sonezaki data center with plans for a Japan-Singapore submarine cable going live in FY 2028, offering dedicated 100 Gbps and 400 Gbps circuits.
- June 2025: ARTERIA Networks joined the Japan-Korea submarine-optical-cable consortium with Microsoft, Amazon Web Services and Dreamline for a Fukuoka-Busan route scheduled to enter service in Q3 2027.
- June 2025: Unified Communications took part in Nobeoka City’s liquid-immersion server demonstration at Asahi Kasei Networks’ site, validating container-type IT gear for high-efficiency computing.
- April 2025: Gaw Capital Partners partnered with GDS to develop a 40-MW carrier-neutral campus in Fuchu Intelligent Park west of Tokyo, slated for end-2026 operations.


Japan Data Center Market Report Scope
Osaka, Tokyo are covered as segments by Hotspot. Large, Massive, Medium, Mega, Small are covered as segments by Data Center Size. Tier 1 and 2, Tier 3, Tier 4 are covered as segments by Tier Type. Non-Utilized, Utilized are covered as segments by Absorption.By Data Center Size
| Large |
| Massive |
| Medium |
| Mega |
| Small |
By Tier Type
| Tier 1 and 2 |
| Tier 3 |
| Tier 4 |
By Data Center Type
| Hyperscale / Self-built | ||
| Enterprise / Edge | ||
| Colocation | Non-Utilized | |
| Utilized | Retail Colocation | |
| Wholesale Colocation | ||
By End User
| BFSI |
| IT and ITES |
| E-Commerce |
| Government |
| Manufacturing |
| Media and Entertainment |
| Telecom |
| Other End Users |
By Hotspot
| Osaka City |
| Takamatsu |
| Tokyo |
| Rest of Japan |
| By Data Center Size | Large | ||
| Massive | |||
| Medium | |||
| Mega | |||
| Small | |||
| By Tier Type | Tier 1 and 2 | ||
| Tier 3 | |||
| Tier 4 | |||
| By Data Center Type | Hyperscale / Self-built | ||
| Enterprise / Edge | |||
| Colocation | Non-Utilized | ||
| Utilized | Retail Colocation | ||
| Wholesale Colocation | |||
| By End User | BFSI | ||
| IT and ITES | |||
| E-Commerce | |||
| Government | |||
| Manufacturing | |||
| Media and Entertainment | |||
| Telecom | |||
| Other End Users | |||
| By Hotspot | Osaka City | ||
| Takamatsu | |||
| Tokyo | |||
| Rest of Japan | |||


Market Definition
- IT LOAD CAPACITY - The IT load capacity or installed capacity, refers to the amount of energy consumed by servers and network equipments placed in a rack installed. It is measured in megawatt (MW).
- ABSORPTION RATE - It denotes the extend to which the data center capacity has been leased out. For instance, a 100 MW DC has leased out 75 MW, then absorption rate would be 75%. It is also referred as utilization rate and leased-out capacity.
- RAISED FLOOR SPACE - It is an elevated space build over the floor. This gap between the original floor and the elevated floor is used to accommodate wiring, cooling, and other data center equipment. This arrangement assist in having proper wiring and cooling infrastructure. It is measured in square feet (ft^2).
- DATA CENTER SIZE - Data Center Size is segmented based on the raised floor space allocated to the data center facilities. Mega DC - # of Racks must be more than 9000 or RFS (raised floor space) must be more than 225001 Sq. ft; Massive DC - # of Racks must be in between 9000 and 3001 or RFS must be in between 225000 Sq. ft and 75001 Sq. ft; Large DC - # of Racks must be in between 3000 and 801 or RFS must be in between 75000 Sq. ft and 20001 Sq. ft; Medium DC # of Racks must be in between 800 and 201 or RFS must be in between 20000 Sq. ft and 5001 Sq. ft; Small DC - # of Racks must be less than 200 or RFS must be less than 5000 Sq. ft.
- TIER TYPE - According to Uptime Institute the data centers are classified into four tiers based on the proficiencies of redundant equipment of the data center infrastructure. In this segment the data center are segmented as Tier 1,Tier 2, Tier 3 and Tier 4.
- COLOCATION TYPE - The segment is segregated into 3 categories namely Retail, Wholesale and Hyperscale Colocation service. The categorization is done based on the amount of IT load leased out to potential customers. Retail colocation service has leased capacity less than 250 kW; Wholesale colocation services has leased capacity between 251 kW and 4 MW and Hyperscale colocation services has leased capacity more than 4 MW.
- END CONSUMERS - The Data Center Market operates on a B2B basis. BFSI, Government, Cloud Operators, Media and Entertainment, E-Commerce, Telecom and Manufacturing are the major end-consumers in the market studied. The scope only includes colocation service operators catering to the increasing digitalization of the end-user industries.
| Keyword | Definition |
|---|---|
| Rack Unit | Generally referred as U or RU, it is the unit of measurement for the server unit housed in the racks in the data center. 1U is equal to 1.75 inches. |
| Rack Density | It defines the amount of power consumed by the equipment and server housed in a rack. It is measured in kilowatt (kW). This factor plays a critical role in data center design and, cooling and power planning. |
| IT Load Capacity | The IT load capacity or installed capacity, refers to the amount of energy consumed by servers and network equipment placed in a rack installed. It is measured in megawatt (MW). |
| Absorption Rate | It denotes how much of the data center capacity has been leased out. For instance, if a 100 MW DC has leased out 75 MW, then the absorption rate would be 75%. It is also referred to as utilization rate and leased-out capacity. |
| Raised Floor Space | It is an elevated space built over the floor. This gap between the original floor and the elevated floor is used to accommodate wiring, cooling, and other data center equipment. This arrangement assists in having proper wiring and cooling infrastructure. It is measured in square feet/meter. |
| Computer Room Air Conditioner (CRAC) | It is a device used to monitor and maintain the temperature, air circulation, and humidity inside the server room in the data center. |
| Aisle | It is the open space between the rows of racks. This open space is critical for maintaining the optimal temperature (20-25 °C) in the server room. There are primarily two aisles inside the server room, a hot aisle and a cold aisle. |
| Cold Aisle | It is the aisle wherein the front of the rack faces the aisle. Here, chilled air is directed into the aisle so that it can enter the front of the racks and maintain the temperature. |
| Hot Aisle | It is the aisle where the back of the racks faces the aisle. Here, the heat dissipated from the equipment’s in the rack is directed to the outlet vent of the CRAC. |
| Critical Load | It includes the servers and other computer equipment whose uptime is critical for data center operation. |
| Power Usage Effectiveness (PUE) | It is a metric which defines the efficiency of a data center. It is calculated by: (𝑇𝑜𝑡𝑎𝑙 𝐷𝑎𝑡𝑎 𝐶𝑒𝑛𝑡𝑒𝑟 𝐸𝑛𝑒𝑟𝑔𝑦 𝐶𝑜𝑛𝑠𝑢𝑚𝑝𝑡𝑖𝑜𝑛)/(𝑇𝑜𝑡𝑎𝑙 𝐼𝑇 𝐸𝑞𝑢𝑖𝑝𝑚𝑒𝑛𝑡 𝐸𝑛𝑒𝑟𝑔𝑦 𝐶𝑜𝑛𝑠𝑢𝑚𝑝𝑡𝑖𝑜𝑛). Further, a data center with a PUE of 1.2-1.5 is considered highly efficient, whereas, a data center with a PUE >2 is considered highly inefficient. |
| Redundancy | It is defined as a system design wherein additional component (UPS, generators, CRAC) is added so that in case of power outage, equipment failure, the IT equipment should not be affected. |
| Uninterruptible Power Supply (UPS) | It is a device that is connected in series with the utility power supply, storing energy in batteries such that the supply from UPS is continuous to IT equipment even during utility power is snapped. The UPS primarily supports the IT equipment only. |
| Generators | Just like UPS, generators are placed in the data center to ensure an uninterrupted power supply, avoiding downtime. Data center facilities have diesel generators and commonly, 48-hour diesel is stored in the facility to prevent disruption. |
| N | It denotes the tools and equipment required for a data center to function at full load. Only "N" indicates that there is no backup to the equipment in the event of any failure. |
| N+1 | Referred to as 'Need plus one', it denotes the additional equipment setup available to avoid downtime in case of failure. A data center is considered N+1 when there is one additional unit for every 4 components. For instance, if a data center has 4 UPS systems, then for to achieve N+1, an additional UPS system would be required. |
| 2N | It refers to fully redundant design wherein two independent power distribution system is deployed. Therefore, in the event of a complete failure of one distribution system, the other system will still supply power to the data center. |
| In-Row Cooling | It is the cooling design system installed between racks in a row where it draws warm air from the hot aisle and supplies cool air to the cold aisle, thereby maintaining the temperature. |
| Tier 1 | Tier classification determines the preparedness of a data center facility to sustain data center operation. A data center is classified as Tier 1 data center when it has a non-redundant (N) power component (UPS, generators), cooling components, and power distribution system (from utility power grids). The Tier 1 data center has an uptime of 99.67% and an annual downtime of <28.8 hours. |
| Tier 2 | A data center is classified as Tier 2 data center when it has a redundant power and cooling components (N+1) and a single non-redundant distribution system. Redundant components include extra generators, UPS, chillers, heat rejection equipment, and fuel tanks. The Tier 2 data center has an uptime of 99.74% and an annual downtime of <22 hours. |
| Tier 3 | A data center having redundant power and cooling components and multiple power distribution systems is referred to as a Tier 3 data center. The facility is resistant to planned (facility maintenance) and unplanned (power outage, cooling failure) disruption. The Tier 3 data center has an uptime of 99.98% and an annual downtime of <1.6 hours. |
| Tier 4 | It is the most tolerant type of data center. A Tier 4 data center has multiple, independent redundant power and cooling components and multiple power distribution paths. All IT equipment are dual powered, making them fault tolerant in case of any disruption, thereby ensuring interrupted operation. The Tier 4 data center has an uptime of 99.74% and an annual downtime of <26.3 minutes. |
| Small Data Center | Data center that has floor space area of ≤ 5,000 Sq. ft or the number of racks that can be installed is ≤ 200 is classified as a small data center. |
| Medium Data Center | Data center which has floor space area between 5,001-20,000 Sq. ft, or the number of racks that can be installed is between 201-800, is classified as a medium data center. |
| Large Data Center | Data center which has floor space area between 20,001-75,000 Sq. ft, or the number of racks that can be installed is between 801-3,000, is classified as a large data center. |
| Massive Data Center | Data center which has floor space area between 75,001-225,000 Sq. ft, or the number of racks that can be installed is between 3001-9,000, is classified as a massive data center. |
| Mega Data Center | Data center that has a floor space area of ≥ 225,001 Sq. ft or the number of racks that can be installed is ≥ 9001 is classified as a mega data center. |
| Retail Colocation | It refers to those customers who have a capacity requirement of 250 kW or less. These services are majorly opted by small and medium enterprises (SMEs). |
| Wholesale Colocation | It refers to those customers who have a capacity requirement between 250 kW to 4 MW. These services are majorly opted by medium to large enterprises. |
| Hyperscale Colocation | It refers to those customers who have a capacity requirement greater than 4 MW. The hyperscale demand primarily originates from large-scale cloud players, IT companies, BFSI, and OTT players (like Netflix, Hulu, and HBO+). |
| Mobile Data Speed | It is the mobile internet speed a user experiences via their smartphones. This speed is primarily dependent on the carrier technology being used in the smartphone. The carrier technologies available in the market are 2G, 3G, 4G, and 5G, where 2G provides the slowest speed while 5G is the fastest. |
| Fiber Connectivity Network | It is a network of optical fiber cables deployed across the country, connecting rural and urban regions with high-speed internet connection. It is measured in kilometer (km). |
| Data Traffic per Smartphone | It is a measure of average data consumption by a smartphone user in a month. It is measured in gigabyte (GB). |
| Broadband Data Speed | It is the internet speed that is supplied over the fixed cable connection. Commonly, copper cable and optic fiber cable are used in both residential and commercial use. Here, optic cable fiber provides faster internet speed than copper cable. |
| Submarine Cable | A submarine cable is a fiber optic cable laid down at two or more landing points. Through this cable, communication and internet connectivity between countries across the globe is established. These cables can transmit 100-200 terabits per second (Tbps) from one point to another. |
| Carbon Footprint | It is the measure of carbon dioxide generated during the regular operation of a data center. Since, coal, and oil & gas are the primary source of power generation, consumption of this power contributes to carbon emissions. Data center operators are incorporating renewable energy sources to curb the carbon footprint emerging in their facilities. |


Research Methodology
Mordor Intelligence follows a four-step methodology in all our reports.
- Step-1: Identify Key Variables: In order to build a robust forecasting methodology, the variables and factors identified in Step-1 are tested against available historical market numbers. Through an iterative process, the variables required for market forecast are set and the model is built on the basis of these variables.
- Step-2: Build a Market Model: Market-size estimations for the forecast years are in nominal terms. Inflation is not a part of the pricing, and the average selling price (ASP) is kept constant throughout the forecast period for each country.
- Step-3: Validate and Finalize: In this important step, all market numbers, variables and analyst calls are validated through an extensive network of primary research experts from the market studied. The respondents are selected across levels and functions to generate a holistic picture of the market studied.
- Step-4: Research Outputs: Syndicated Reports, Custom Consulting Assignments, Databases & Subscription Platforms


