Italy Geospatial Analytics Market Size and Share
Market Overview
| Study Period | 2020 - 2031 |
|---|---|
| Forecast Data Period | 2026 - 2031 |
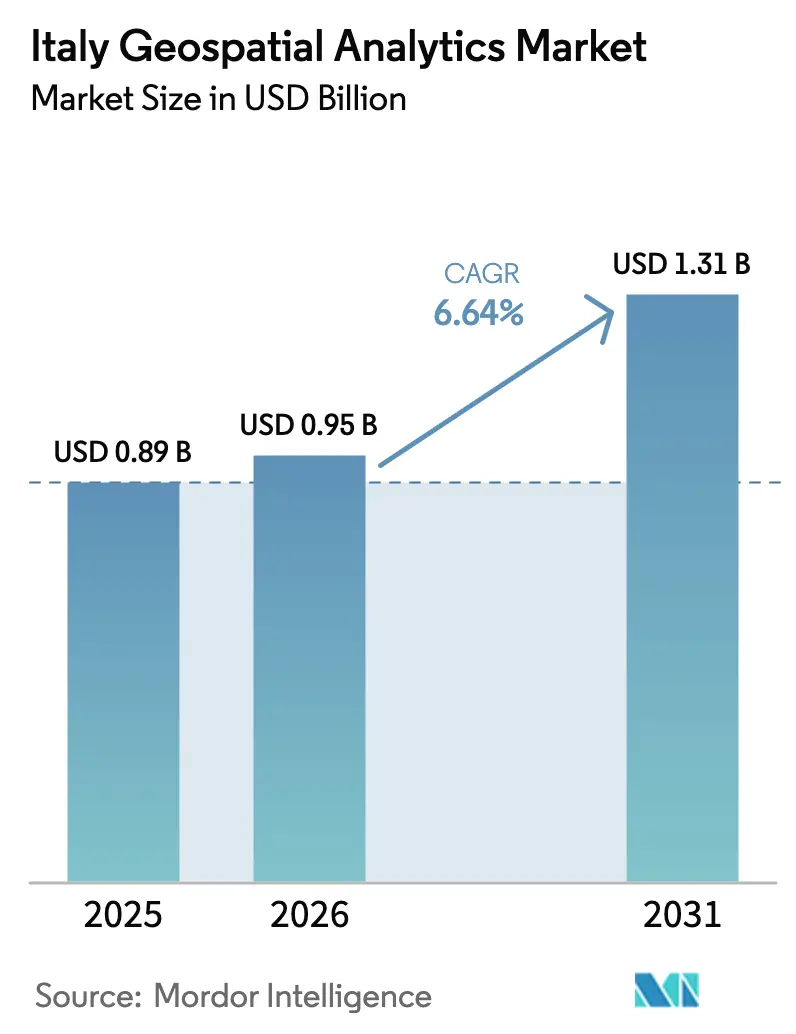
| Base Year Market Size (2025) | USD 0.89 Billion |
| Market Size (2026) | USD 0.95 Billion |
| Market Size (2031) | USD 1.31 Billion |
| Growth Rate (2026 - 2031) | 6.64% CAGR |
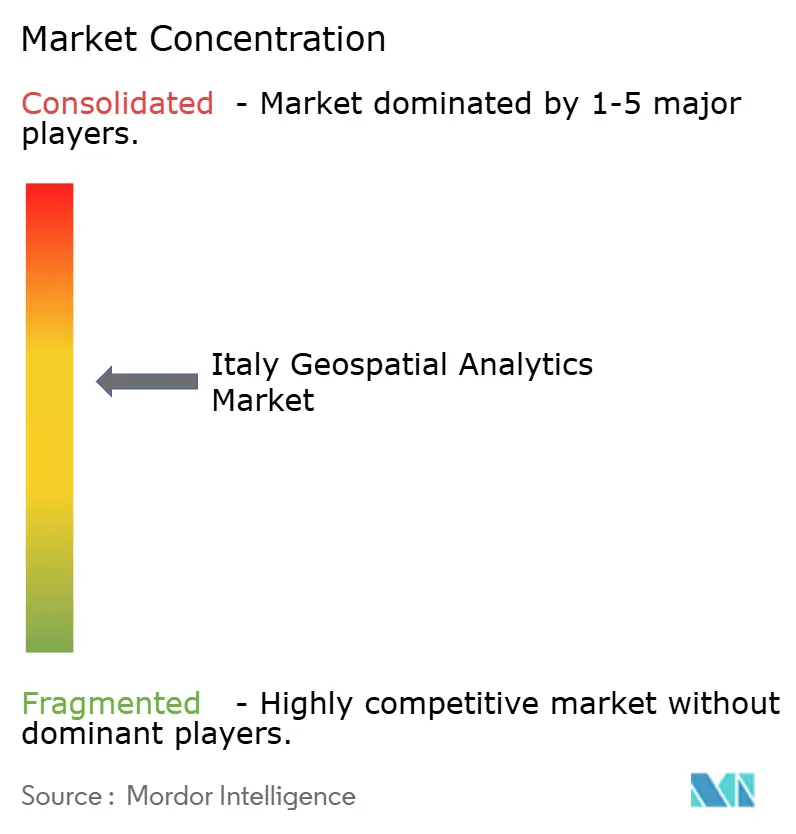
| Market Concentration | Medium |
Major Players *Disclaimer: Major Players sorted in no particular order Image © Mordor Intelligence. Reuse requires attribution under CC BY 4.0. | |
Italy Geospatial Analytics Market Analysis by Mordor Intelligence
The Italy geospatial analytics market size is expected to increase from USD 0.95 billion in 2026 to USD 1.31 billion by 2031, growing at a CAGR of 6.64% over 2026-2031. Continuous digital-government mandates, sovereign satellite capacity coming online in mid-2026, and cloud-first directives for public administrations keep annual spending on an upward trajectory. Real-time spatial dashboards now underpin bridge and dam monitoring, while carbon-credit verification and port digital-twin pilots broaden the technology’s use cases. Vendors are shifting toward outcome-based subscription pricing as municipalities and small enterprises prefer managed services to owning software licenses. At the same time, abundant open data erodes margins for raw imagery, so solution providers differentiate through analytics automation and domain-specific applications. Competitive intensity remains moderate because sovereign imaging capacity, entrenched enterprise agreements, and talent shortages still create barriers for late entrants.
Key Report Takeaways
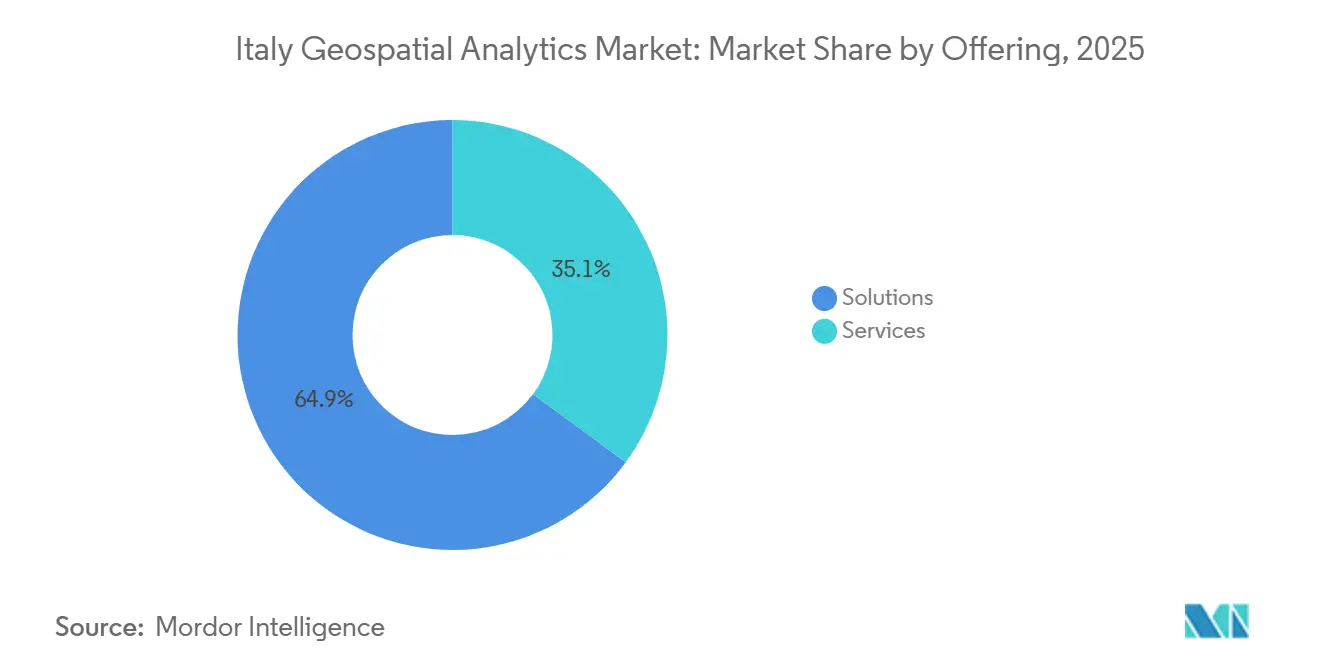
- By offering, solutions led with 64.91% of 2025 revenue, while services are projected to advance at a 7.23% CAGR to 2031.
- By technology, GIS software commanded 38.96% of 2025 spending, whereas spatial data-science and AI platforms are forecast to expand at a 7.15% CAGR through 2031.
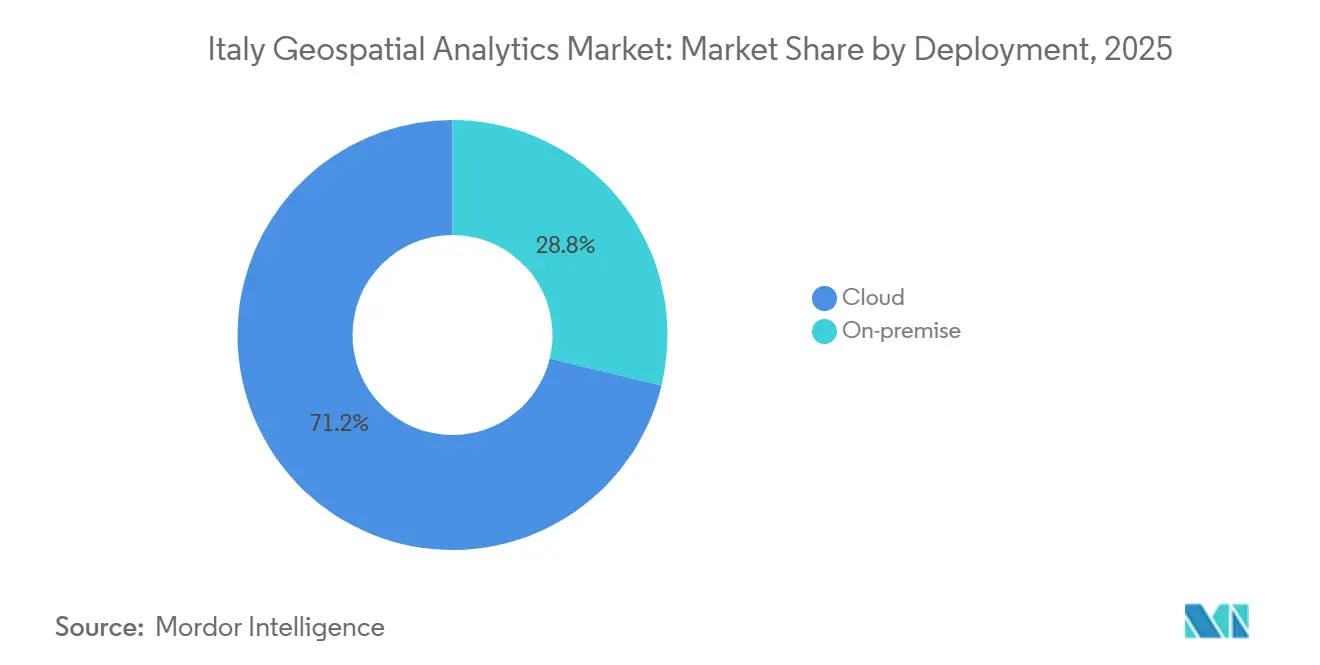
- By deployment, cloud installations accounted for 71.21% of 2025 revenue and are growing at a 7.28% CAGR over 2026-2031.
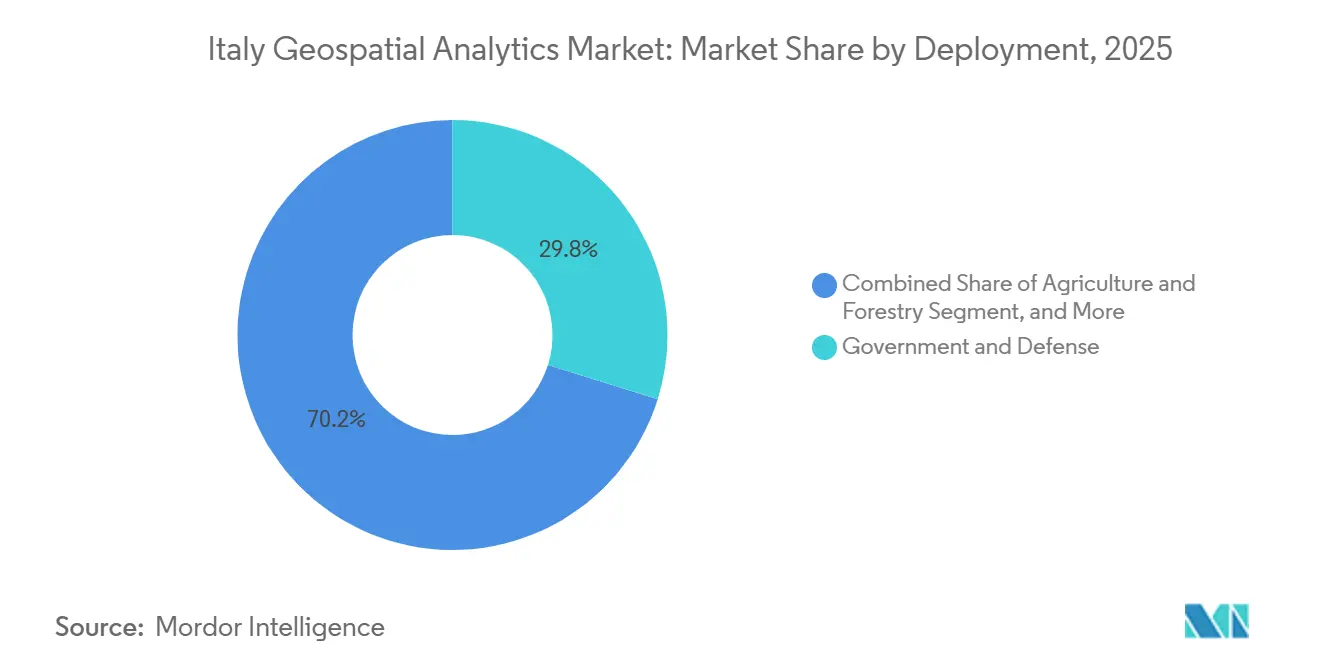
- By end-user, government and defense held 29.83% of 2025 outlays, while agriculture and forestry is pacing the field with a 6.98% CAGR to 2031.
- By organization size, large enterprises captured 55.33% of 2025 spending, yet SMEs are set to grow 7.01% annually as pay-as-you-go models remove capital barriers.
Note: Market size and forecast figures in this report are generated using Mordor Intelligence’s proprietary estimation framework, updated with the latest available data and insights as of 2026.
Italy operates as part of an interconnected international environment rather than as a self-contained country level unit. The geospatial analytics market research by Mordor Intelligence places together all major developments across the globe within that wider frame.
Italy Geospatial Analytics Market Trends and Insights
Drivers Impact Analysis*
| Driver | (~) % Impact on CAGR Forecast | Geographic Relevance | Impact Timeline |
|---|---|---|---|
| Smart-city Programme Scale-up Across Major Municipalities | +1.80% | National, with early gains in Rome, Bologna, Milan, Genoa | Medium term (2-4 years) |
| Infrastructure Health-Monitoring for Bridges, Dams and Rail | +1.50% | National, concentrated in Northwest and Central Italy | Short term (≤ 2 years) |
| Copernicus and Private EO Constellations Expanding Data Supply | +1.30% | National, spillover to Mediterranean basin | Long term (≥ 4 years) |
| Mandatory BIM-GIS Convergence Under New Public Works Code | +1.00% | National, public-sector contracts exceeding EUR 1 million | Medium term (2-4 years) |
| Agricultural Carbon-Credit MRV Requiring High-Resolution EO | +0.70% | Northeast and Southern Italy, Sardinia, Sicily | Long term (≥ 4 years) |
| Port Digital-Twin Projects to Boost Maritime Competitiveness | +0.40% | Northwest (Genoa, La Spezia), Northeast (Trieste, Venice), Southern Italy (Naples) | Medium term (2-4 years) |
| Source: Mordor Intelligence | |||
Smart-City Programme Scale-Up Across Major Municipalities
Flagship municipal programs are moving from pilot to production. Rome’s EUR 9 million GeoRoma environment has unified cadastral, mobility, and utilities layers for 15 departments, cutting permit turnaround times by nearly one-third.[1]Comune di Roma, “GeoRoma,” COMUNE.ROMA.IT Bologna’s EUR 7 million digital twin fuses LiDAR meshes with real-time air-quality and traffic sensors to predictively maintain lighting assets.[2]Comune di Bologna, “Digital Twin,” COMUNE.BOLOGNA.IT National ICT rules require every city above 100,000 residents to deploy cloud-based spatial platforms by December 2027, so vendors see a replicable template and a multi-year addressable pipeline.[3]Agenzia per l’Italia Digitale, “Piano Triennale 2024-2026,” AGID.GOV.IT These projects elevate demand for intuitive geo-visualization tools that planners can share with non-technical stakeholders. The biggest barrier is human capital: Italian universities graduate fewer than 200 geomatics specialists a year, forcing municipalities to outsource analytics functions.[4]Politecnico di Milano, “Geomatics Courses,” POLIMI.IT
Infrastructure Health-Monitoring for Bridges, Dams and Rail
After the 2018 Morandi bridge tragedy, the transport ministry mandated interferometric synthetic-aperture radar (InSAR) surveillance for critical bridges and large dams. National rail operator RFI now tracks 12,000 km of lines with InSAR time-series that flag millimeter-level subsidence before service disruptions. The COSMO-SkyMed and European Ground Motion Service datasets feed into predictive models combining weather, traffic load, and maintenance logs, a workflow that traditional desktop GIS struggles to automate. Demand is strongest in Central Italy’s seismic zones and the groundwater-sensitive Po Valley. Vendors offering cloud-native analytics pipelines gain an edge because agencies prefer subscription access over one-off software purchases.
Copernicus and Private EO Constellations Expanding Data Supply
Sentinel-1C and 1D launches restored six-day C-band radar revisit frequency, while six new Copernicus expansion missions address carbon, hyperspectral, and land-surface temperature monitoring. Parallel sovereign capacity comes from the EUR 1.07 billion IRIDE constellation, whose first satellites entered service in mid-2026. This abundance has pushed the cost per square kilometer of high-resolution imagery sharply lower, enabling SMEs to integrate satellite data into credit-risk models, crop forecasting, and insurance underwriting. However, the flood of free pixels commoditizes raw imagery, so vendors compete on automated change-detection algorithms, turnkey dashboards, and business-ready insights.
Mandatory BIM-GIS Convergence Under New Public Works Code
Decree 36/2023 obliges bidders on infrastructure contracts above EUR 1 million to deliver Building Information Modelling files georeferenced inside municipal GIS systems. Compliance accelerates uptake of interoperable platforms that handle Industry Foundation Classes and CityGML schemas, especially for utilities and transport corridors. Contractors lacking spatial skills now require third-party consultants, lifting service revenue. The rule also nudges engineering firms to retrain staff in coordinate reference systems and spatial databases, gradually dissolving the organizational silos between BIM and GIS teams.
Restraints Impact Analysis*
| Restraint | (~) % Impact on CAGR Forecast | Geographic Relevance | Impact Timeline |
|---|---|---|---|
| Abundance of Free or Open Geospatial Data Sets | -0.90% | National, with spillover to EU member states via INSPIRE | Long term (≥ 4 years) |
| Shortage of Advanced Spatial-Data-Science Talent | -0.60% | National, acute in Southern Italy and smaller municipalities | Medium term (2-4 years) |
| Fragmented Municipal Procurement and Long Sales Cycles | -0.40% | National, more pronounced in Central and Southern Italy | Short term (≤ 2 years) |
| Heritage-Site Drone Restrictions Limiting Aerial Data Capture | -0.20% | Central Italy (Rome, Florence, Pisa), Southern Italy (Pompeii, Matera) | Medium term (2-4 years) |
| Source: Mordor Intelligence | |||
Abundance of Free or Open Geospatial Data Sets
Italy maintains one of Europe’s richest government data portals, featuring nationwide 1:10,000 orthophotos, terrain models, and cadastral layers downloadable without licensing fees. The Repertorio Nazionale dei Dati Territoriali catalogs 18,000 datasets exposed via OGC-compliant services. EU high-value-dataset rules further guarantee cost-free access to earth-observation and meteorological layers. Buyers now vet open alternatives before subscribing to commercial feeds, compressing prices for commodity data. As a result, vendors must pivot toward sector-specific analytics, real-time fusion, and turnkey compliance reporting where open tools fall short.
Shortage of Advanced Spatial-Data-Science Talent
Less than 150 students a year complete advanced geomatics modules at Politecnico di Milano, the University of Bologna, and peer institutions. Curricula still emphasize surveying over cloud-native spatial databases or machine-learning pipelines. Southern municipalities cannot match private-sector salaries offered in Milan or abroad, relying on external consultancies that raise total cost of ownership. The talent gap also slows the roll-out of AI-enabled platforms: organizations lack staff who can train convolutional neural networks, validate outputs, and insert predictions into daily workflows. Vendors that bundle managed analytics and training services therefore capture outsized growth.
*Our forecasts treat driver/restraint impacts as directional, not additive. The impact forecasts reflect baseline growth, mix effects, and variable interactions.
Segment Analysis
By Offering: Services Gain as Talent Gaps Widen
Services expanded faster than solutions in 2025 as municipalities outsourced data integration, system configuration, and ongoing analysis. The Italy geospatial analytics market size for services reflects a 7.23% CAGR to 2031, mirroring persistent staff shortages and the appeal of pay-as-you-go procurement. Rome contracted an external team to maintain GeoRoma rather than hire permanent specialists, illustrating the preference for managed deals. Solutions, however, continue anchoring long-term projects within defense and utilities where on-premises control is non-negotiable.
Toward 2031, hybrid consumption patterns emerge: agencies license core GIS engines yet augment them with subscription APIs for machine-learning inference, change detection, or automated reporting. Vendors that package consulting, platform hosting, and on-call analytics under one invoice gain recurring revenue and insulate clients from talent volatility, sustaining a services growth premium.


By Type: Spatial Data-Science and AI Platforms Disrupt Workflows
Surface analysis captured 47.59% of 2025 revenue, but AI-driven pipelines are the fastest-moving slice of the Italy geospatial analytics market, advancing at 7.31% CAGR. Vineyards in Veneto and Friuli-Venezia Giulia adopt convolutional neural networks to flag disease hotspots, bypassing manual photointerpretation. Port authorities feed deep-learning models hourly AIS, weather, and optical imagery to predict berth congestion, an analytic loop impractical with legacy software.
Traditional surface- and network-analysis still dominate engineering site design and watershed studies, ensuring they keep meaningful share. Yet automated AI platforms win incremental budgets where decision cycles shrink from weeks to minutes and where end users want JSON output, not cartographic layouts. Over the forecast horizon, AI platforms will carve out robust niches in crop yield forecasting, carbon-credit MRV, and near-real-time infrastructure monitoring.
By Technology: Cloud and AI Reshape the Stack
GIS engines such as ArcGIS remain the entry point for 38.96% of technology spend, but cloud-native spatial data-science tools generate the highest growth within the Italy geospatial analytics market. Sovereign Polo Strategico Nazionale infrastructure, certified for public workloads, allays earlier data-residency fears and encourages agencies to offload compute-heavy image processing. GPU partnerships with NVIDIA accelerate hyperspectral and radar workflows, slashing processing times from hours to minutes.
Remote-sensing and GNSS technology stays essential for construction staking, precision farming, and autonomous vehicle trials, though hardware commoditization tempers topline expansion. The future stack looks bimodal: entrenched GIS publishers defend their franchises with tight workflow integrations, while challenger firms release API-centric, AI-ready services that plug directly into enterprise data warehouses.
By End-User: Agriculture Accelerates, Government Anchors
Government and defense generated 29.83% of 2025 spending and will remain the anchor buyer group of the Italy geospatial analytics market thanks to infrastructure mandates and sovereign-data preferences. Agriculture and forestry, however, charts the steepest curve at a 6.98% CAGR, propelled by Common Agricultural Policy carbon-credit verification that requires high-resolution earth-observation. Vineyards embrace multispectral monitoring to optimize irrigation and boost grape quality, capitalizing on Italy’s world-leading 49.8 million hectoliter wine output.
Transport and logistics, energy and utilities, and real estate and construction each expand steadily as digital twins spread across ports, grids, and building sites. Banking and insurance pilot’s catastrophe-risk scoring models, but large-scale rollouts await regulatory clarity on model governance. Over the forecast window, agricultural clients will punch above their historical weight, illustrating the pivot from pure mapping to monetizable analytics.

By Deployment: Cloud Dominates as Sovereignty Concerns Ease
Cloud captured 71.21% of 2025 installs and is growing at 7.28% CAGR as national security agency certifications validate off-premises hosting for public workloads. The Italy geospatial analytics market share for cloud solutions widens further as AI pipelines demand elastic GPUs and as subscription models align with municipal budget cycles. Bologna’s digital twin and Rome’s GeoRoma both illustrate the scalability advantage when integrating IoT feeds with satellite imagery in near real time.
On premises persists in defense, critical infrastructure, and segments facing stringent classification rules, yet hybrid approaches gain favour: sensitive layers stay in agency data centers while analytics jobs burst to cloud GPU clusters overnight. Vendors fluent in multicloud orchestration and zero-trust security will capture the next wave of migrations.
By Organization Size: SMEs Embrace Subscription Models
Large enterprises owned 55.33% of 2025 revenue, buoyed by multiyear enterprise agreements and system integration budgets. Small and medium-sized enterprises now add growth momentum, advancing at 7.01% CAGR, because subscription APIs let them ingest satellite insights without capital expenditure. A vineyard in Tuscany can subscribe to Latitudo 40’s hectare-based pricing instead of hiring a remote-sensing analyst, illustrating the democratization trend.
SMEs still face onboarding friction when configuring coordinate systems or machine-learning thresholds, so vendors with wizard-driven interfaces and bundled support see lower churn. As more cloud providers embed geospatial operators directly into data-warehouse SQL dialects, SMEs will access spatial analytics natively inside existing business-intelligence tooling, accelerating uptake.
Geography Analysis
Northwest Italy continues to command the largest slice of the Italy geospatial analytics market, anchored by Milan’s industrial base and the Port of Genoa’s EUR 30 million digital-twin initiative that trimmed container dwell time by 18%. Lombardy manufacturers rely on network routing and supply-chain risk mapping, sustaining steady demand for GIS licenses and AI dashboards. Piedmont’s automotive corridor applies LiDAR-derived point clouds to optimize assembly-line logistics, while Liguria’s rugged terrain fuels drone-based landslide surveillance.
Northeast regions of Veneto, Friuli-Venezia Giulia, and Trentino-Alto Adige specialize in precision agriculture and port efficiency. Trieste’s AI port-management rollout serves as an Adriatic benchmark, and vineyards leverage Sentinel-2 time-series to reduce irrigation by up to 20%, increasing market readiness for subscription imagery analytics. Cross-border rail links into Austria and Slovenia add impetus for harmonized geodata layers that conform to EU INSPIRE standards, fostering demand for interoperable platforms.
Central Italy’s Lazio, Tuscany, and Umbria cluster government and cultural-heritage users. Florence employs InSAR to track subsidence near Renaissance monuments, while strict drone no-fly zones around UNESCO sites channel users toward satellite sources approved by aviation regulator ENAC. Rome’s municipal platform sets best practice for statewide replication. However, procurement fragmentation and lengthier tender cycles moderate immediate revenue growth.
Southern Italy and the islands Campania, Sicily, Sardinia offer the fastest percentage upside, driven by infrastructure-gap remediation funds and carbon-farming subsidies. Naples explores flood-risk mapping to protect coastal logistics assets, whereas Sardinia pilots renewable-grid balancing that combines weather forecasts with satellite cloud-motion vectors. Vendor entry costs remain higher because municipal buyers often require Italian-language interfaces, on-site training, and longer payment terms, yet the addressable acreage for carbon-credit MRV positions the South as a prime medium-term frontier.
The geospatial analytics market is assessed by Mordor Intelligence through a multi-layered geographic lens, covering other regions such as Africa and Middle East, along with detailed country-level analysis for Germany, France, Nigeria, Saudi Arabia, Spain, United Kingdom, and China.
Competitive Landscape
Domestic champions and global incumbents share a moderately concentrated arena. e-Geos, the Leonardo-Telespazio venture, secured IRIDE prime-contractor status, guaranteeing privileged satellite access and reinforcing its stature in sovereign imagery services. ESRI Italia continues to extend enterprise agreements across ministries, cementing ArcGIS as the de facto standard GIS backbone. Latitudo 40 and Rheticus carve high-growth niches with API-first, outcome-priced analytics, appealing to vineyards, insurers, and infrastructure operators seeking turnkey insights without GIS overhead.
Hexagon’s 30% stake in GECOsistema adds agronomic consulting depth, while HERE Technologies and TomTom race to ingest municipal sensor feeds for high-frequency traffic layers, jockeying for logistics clients. Planet Labs integrates PlanetScope streams with IRIDE payloads under an ASI memorandum, giving users blended sovereign and commercial coverage. NVIDIA meanwhile supplies GPU acceleration to multiple Italian vendors, embedding itself as the horizontal enabler of AI-driven processing.
Competitive strategies split along workflow lines. Incumbents defend license annuities and professional-service bundles that mold to legacy processes, whereas challengers emphasize elasticity, per-asset pricing, and rapid iteration via APIs. Talent scarcity and fragmented municipal tenders still tilt early-stage deals toward vendors with Italian-speaking field engineers and pre-existing public-sector credentials, explaining the moderate not low market concentration score.
Italy Geospatial Analytics Industry Leaders
Hexagon AB
Flypix AI GmbH
Eoliann S.r.l
Trilogis
IPTSAT S.r.l
- *Disclaimer: Major Players sorted in no particular order

Recent Industry Developments
- August 2025: Fugro reported H1 2025 revenue decline of 11% yet maintained USD 1.7 billion backlog, projecting 20% second-half recovery driven by defense demand.
- May 2025: Trimble posted Q1 2025 revenue of USD 841 million and 17% organic ARR growth to USD 2.4 billion, emphasizing AI upgrades in construction and transport geospatial suites.
- January 2025: UP42 was acquired by Neo Space Group, adding hyperspectral imagery and expanding data sources to 140 feeds.
- December 2024: xFarm Technologies partnered with Syngenta France to enhance geospatial AI farmland monitoring.


Italy Geospatial Analytics Market Report Scope
The Italy Geospatial Analytics Market Report is Segmented by Offering (Solutions, Services), Type (Surface Analysis, Network Analysis, Geo-visualization Analysis), End-user (Transportation and Logistics, Government and Defense, Energy, Utilities and Mining, Banking, Financial Services and Insurance, Agriculture and Forestry, Real-Estate and Construction, Other End-users), Technology (GIS Software, Remote-Sensing and Earth Observation, GNSS and Positioning, Spatial Data-Science and AI Platforms), Deployment (Cloud, On-premise), Organization Size (Large Enterprises, SMEs), and Geography (Northwest Italy, Northeast Italy, Central Italy, Southern Italy and Islands). The Market Forecasts are Provided in Terms of Value (USD).
| Solutions |
| Services |
| Surface Analysis |
| Network Analysis |
| Geo-visualization Analysis |
| Transportation and Logistics |
| Government and Defense |
| Energy, Utilities and Mining |
| Banking, Financial Services and Insurance |
| Agriculture and Forestry |
| Real-Estate and Construction |
| Other End-users |
| GIS Software |
| Remote-Sensing and Earth Observation |
| GNSS and Positioning |
| Spatial Data-Science and AI Platforms |
| Cloud |
| On-premise |
| Large Enterprises |
| SMEs |
| By Offering | Solutions |
| Services | |
| By Type | Surface Analysis |
| Network Analysis | |
| Geo-visualization Analysis | |
| By End-user | Transportation and Logistics |
| Government and Defense | |
| Energy, Utilities and Mining | |
| Banking, Financial Services and Insurance | |
| Agriculture and Forestry | |
| Real-Estate and Construction | |
| Other End-users | |
| By Technology | GIS Software |
| Remote-Sensing and Earth Observation | |
| GNSS and Positioning | |
| Spatial Data-Science and AI Platforms | |
| By Deployment | Cloud |
| On-premise | |
| By Organization Size | Large Enterprises |
| SMEs |


Key Questions Answered in the Report
How large is the Italy geospatial analytics market in 2026?
It stands at USD 0.95 billion and is forecast to reach USD 1.31 billion by 2031 at a 6.64% CAGR.
Which end-user sector is growing fastest in Italy?
Agriculture and forestry leads with a 6.98% CAGR because carbon-credit verification demands high-resolution earth-observation.
Why are cloud deployments accelerating in Italy?
National cybersecurity certification of the Polo Strategico Nazionale and cloud-first mandates for public bodies push 71.21% of workloads to cloud platforms.
What is driving demand for spatial AI platforms?
The influx of free Copernicus and IRIDE imagery makes raw pixels commoditized, so organizations invest in automated change-detection and predictive-analytics pipelines.
Which regions of Italy spend the most on geospatial analytics?
Northwest and Northeast Italy together lead, fueled by industrial hubs, port digital twins, and precision-agriculture pilots.
How concentrated is the competitive landscape?
The market registers a moderate concentration score of 6 on a 1-10 scale because the top five players hold roughly 60% combined share but white-space niches remain open.
Page last updated on:


