
IR (Infrared) Camera Market Size and Share
Market Overview
| Study Period | 2020 - 2031 |
|---|---|
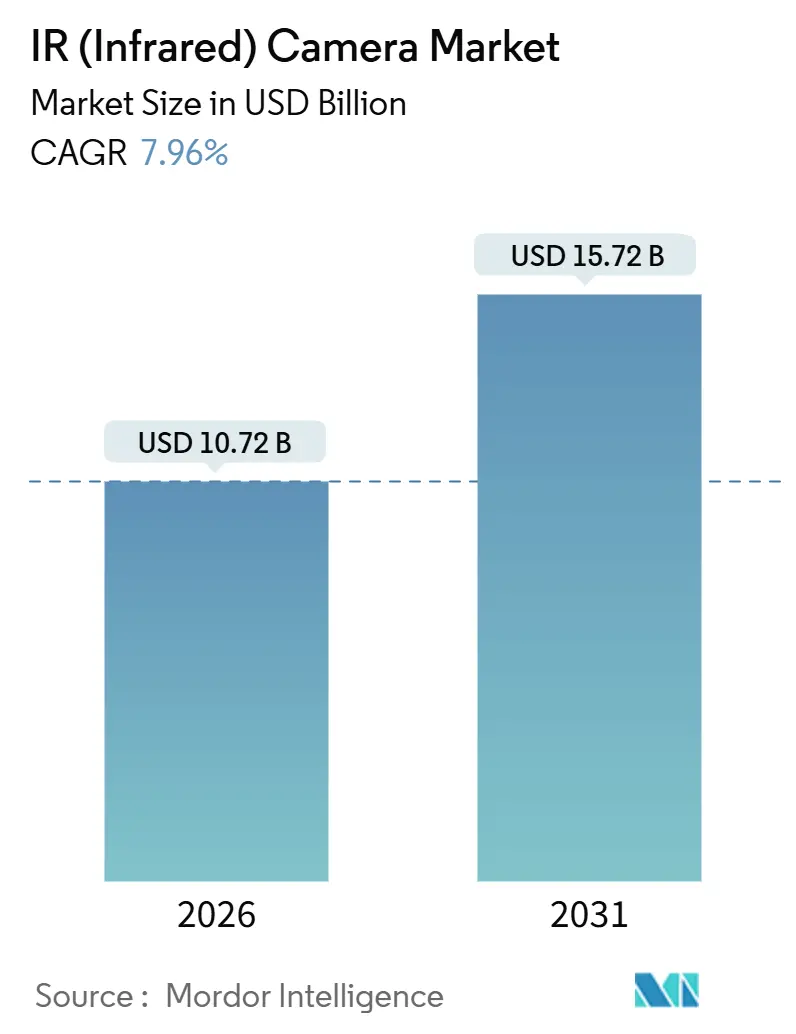
| Market Size (2026) | USD 10.72 Billion |
| Market Size (2031) | USD 15.72 Billion |
| Growth Rate (2026 - 2031) | 7.96 % |
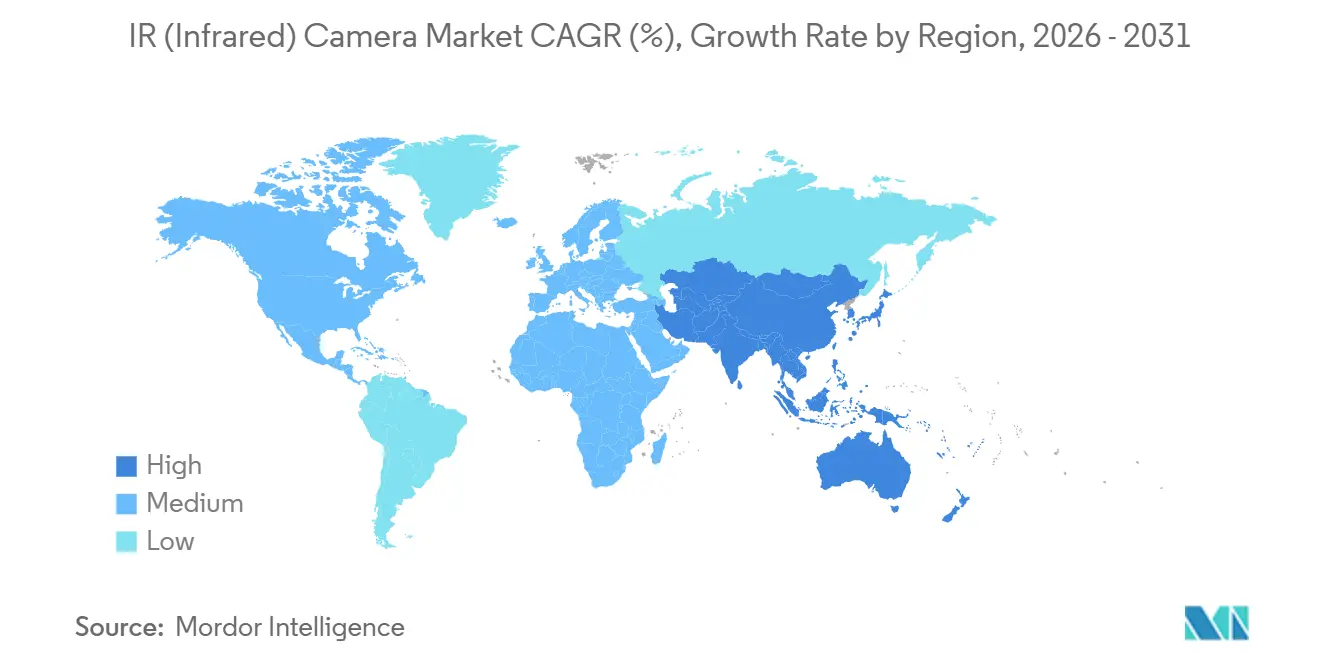
| Fastest Growing Market | Asia Pacific |
| Largest Market | North America |
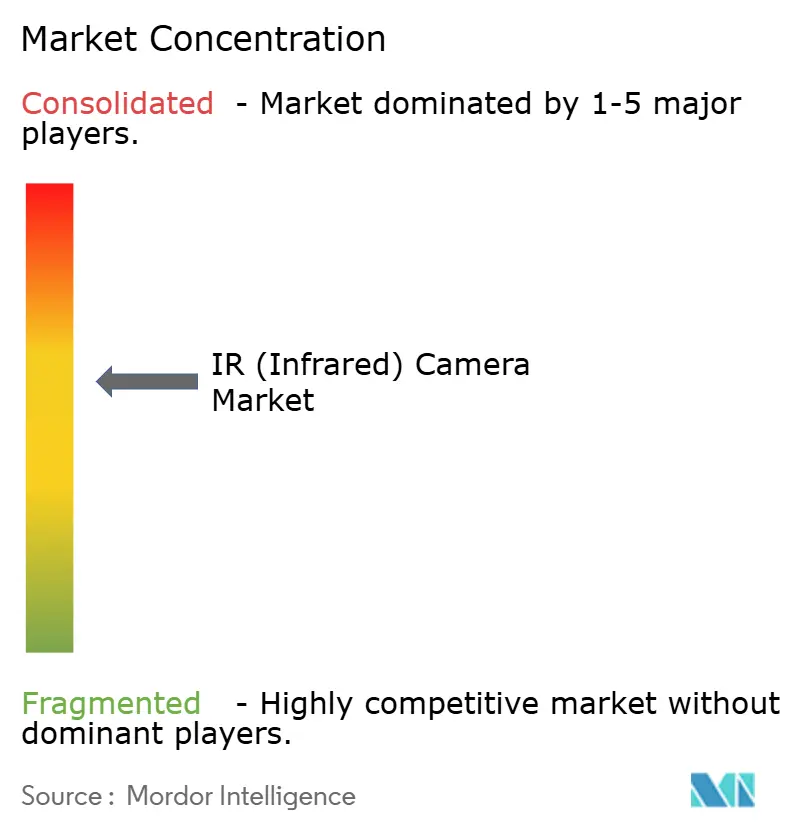
| Market Concentration | Medium |
Major Players *Disclaimer: Major Players sorted in no particular order Image © Mordor Intelligence. Reuse requires attribution under CC BY 4.0. | |
IR (Infrared) Camera Market Analysis by Mordor Intelligence
The infrared camera market size reached USD 10.72 billion in 2026 and is projected to advance to USD 15.72 billion by 2031, reflecting a 7.96% CAGR across the period. Escalating defense modernization programs, electric-vehicle battery safety mandates, and the convergence of thermal sensors with edge AI are widening commercial use cases. Declining microbolometer prices have made thermal imaging cost-competitive with visible-light cameras in perimeter security, while new fire-safety codes and predictive-maintenance standards are creating recurring inspection demand. Automotive original-equipment manufacturers (OEMs) are embedding thermal cameras for pedestrian detection and battery-pack monitoring, expanding the infrared camera market into mass-production volumes. Meanwhile, supply-chain diversification for germanium optics and the rollout of dual-band thermal-visible modules are helping vendors defend margins against low-cost entrants.
Key Report Takeaways
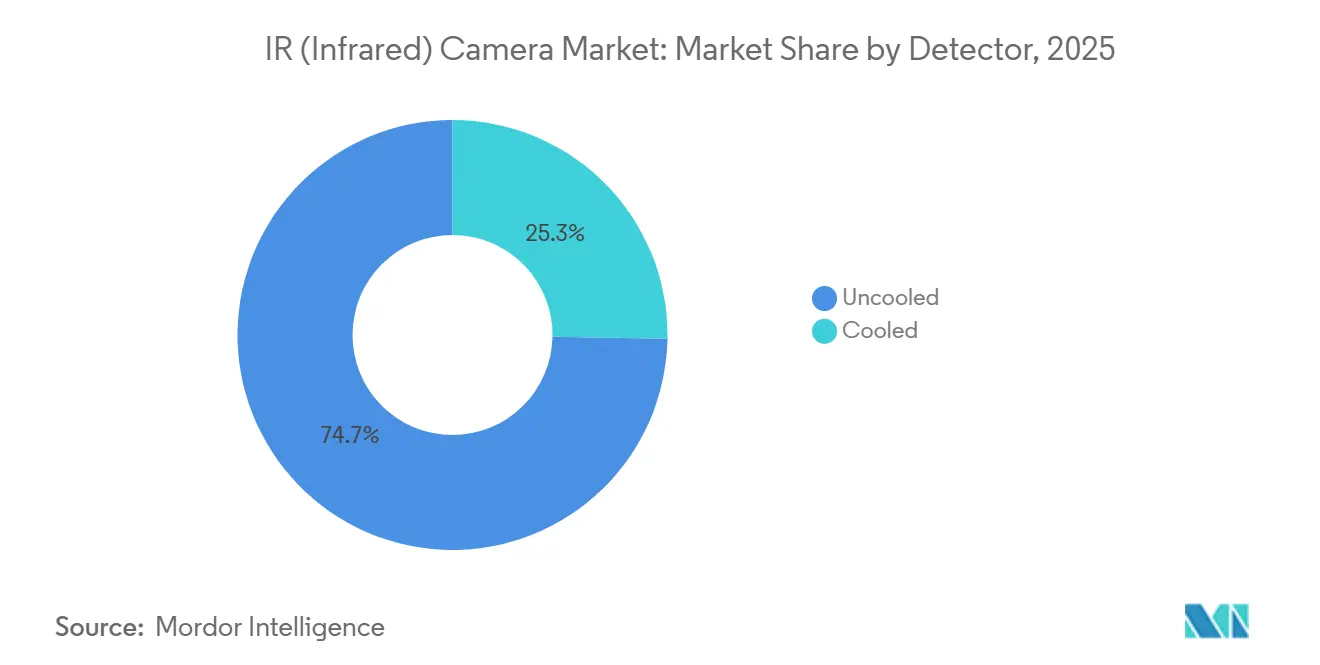
- By detector, uncooled units led with 74.72% revenue share in 2025; cooled technology is projected to grow at a 9.21% CAGR to 2031.
- By material, germanium optics held 41.62% of the infrared camera market share in 2025, while sapphire substrates are set to expand at an 8.44% CAGR through 2031.
- By wavelength type, long-wave infrared systems captured 46.63% of the infrared camera market size in 2025, and short-wave infrared is advancing at an 8.56% CAGR between 2026-2031.
- By end-user vertical, military and defense accounted for 34.62% of 2025 revenue; automotive applications are pacing the field with an 8.35% CAGR to 2031.
- By geography, North America commanded 38.73% of 2025 sales, while Asia-Pacific is forecast to post the fastest 8.55% CAGR through 2031.
Note: Market size and forecast figures in this report are generated using Mordor Intelligence’s proprietary estimation framework, updated with the latest available data and insights as of January 2026.
Market Trends and Insights
Drivers Impact Analysis of IR (Infrared) Camera Market*
| Driver | (~) % Impact on CAGR Forecast | Geographic Relevance | Impact Timeline |
|---|---|---|---|
| Rising Demand for Surveillance Across Multiple Sectors | +1.8% | Global urban centers in North America, Europe, Asia-Pacific | Medium term (2-4 years) |
| Falling Average Selling Prices of Infrared Sensors | +1.5% | Asia-Pacific manufacturing hubs and cost-sensitive regions | Short term (≤ 2 years) |
| Integration with AI-based Video Analytics Enhancing Use Cases | +1.4% | North America and Europe enterprises, Asia-Pacific smart cities | Medium term (2-4 years) |
| Adoption in Electric Vehicle Battery Thermal Management | +1.2% | China, South Korea, Europe, North America EV clusters | Long term (≥ 4 years) |
| Mandatory Fire Safety Codes Requiring Thermal Inspection | +0.9% | North America and Europe, emerging Middle East and Asia-Pacific | Medium term (2-4 years) |
| Growth of Space-Based Infrared Imaging for Smallsats | +0.6% | North America, Europe, emerging Asia-Pacific | Long term (≥ 4 years) |
| Source: Mordor Intelligence | |||


Rising Demand for Surveillance Across Multiple Sectors
Thermal cameras have shifted from reactive detection to proactive threat assessment, forming the first layer in multi-sensor security grids. Bi-spectrum models overlay thermal and visible feeds to cut false alarms, a key benefit for critical-infrastructure sites where nuisance alerts burden operators.[1]Hangzhou Hikvision, “HeatPro Bi-Spectrum Camera Series,” hikvision.com U.S. security guidance recommends thermal perimeters for chemical facilities, driving procurement in petrochemical corridors. Commercial real-estate owners now integrate thermal feeds with building-management systems to optimize HVAC loads, a practice that expanded after 2024 energy-price spikes. Vendors report double-digit revenue growth as enterprises replace legacy passive-infrared sensors with analytics-ready thermal units.[2]Axis Communications, “AXIS M4318-PLVE Thermal Camera with DLPU,” axis.com
Integration with AI-Based Video Analytics Enhancing Use Cases
Embedding neural processors in cameras enables thermal imaging to serve as a diagnostic tool. Edge inference distinguishes between electrical faults, steam leaks, and normal operation at 30 frames per second, eliminating cloud latency. Automotive systems rely on this sub-100 millisecond decision loop for emergency braking in darkness, reinforcing adoption by European OEMs. Industrial users apply thermal patterns to forecast bearing failures weeks ahead, reducing unplanned downtime. GPU suppliers expanded their support for thermal pipelines, enabling integrators to run unified analytics across both visible and infrared streams.[3]NVIDIA Corporation, “DeepStream SDK Thermal Video Pipeline Support,” nvidia.com
Adoption in Electric Vehicle Battery Thermal Management
Electric vehicles employ thermal arrays inside battery enclosures to map cell temperatures at 30 fps, letting battery-management systems throttle charge rates before runaway occurs. Research shows mid-wave infrared detects internal shorts seconds earlier than thermocouples, offering critical reaction time. Luxury SUVs already ship with embedded thermal monitors that contributed to recent 5-star safety ratings. Sensor fusion modules now combine radar and thermal data to monitor pedestrians and tire temperatures simultaneously, trimming sensor weight and wiring.
Falling Average Selling Prices of Infrared Sensors
Microbolometer fabrication utilizes MEMS process lines, resulting in per-unit costs of below USD 50 for 80×60 arrays. Smartphone-connected thermal modules, now priced at USD 499, deliver a 320×240 resolution, democratizing home energy audits. Chinese suppliers leverage domestic vanadium-oxide chains to undercut Western pricing by up to 40%, forcing established brands to compete on software. Pixel-pitch reductions from 17 μm to 12 μm increase the number of detectors per wafer by 42%, accelerating the cost curve. Mid-tier handheld imagers that cost USD 4,000 in 2020 now ship at USD 1,695, opening small-business and prosumer segments.
Restraints Impact Analysis of IR (Infrared) Camera Market*
| Restraint | (~) % Impact on CAGR Forecast | Geographic Relevance | Impact Timeline |
|---|---|---|---|
| Export Control Regulations on Dual-Use Infrared Detectors | -1.1% | Cross-border trade from North America and Europe to Asia-Pacific, Middle East, Africa | Medium term (2-4 years) |
| Competition from Low-Cost CMOS Visible Cameras with AI Upscaling | -0.8% | Consumer and entry-level commercial segments worldwide | Short term (≤ 2 years) |
| Supply Chain Constraints for Germanium and Other IR-Grade Materials | -0.7% | Manufacturers dependent on Chinese germanium refining | Short term (≤ 2 years) |
| Lack of Standardized Calibration for Long-Range Thermal Accuracy | -0.4% | Defense and critical-infrastructure applications globally | Long term (≥ 4 years) |
| Source: Mordor Intelligence | |||
Export Control Regulations on Dual-Use Infrared Detectors
ITAR restrictions classify high-spec cooled detectors as defense articles, extending export-license cycles to 6-12 months and blocking sales to embargoed nations. The 2024 Wassenaar amendments added high-sensitivity uncooled arrays to control lists, causing firms to ship detuned variants to remain compliant. Chinese buyers respond by sourcing domestically, while U.S. authorities have tightened entity listings, disrupting optic and detector flows. Compliance costs average USD 15,000 per shipment, pressuring small manufacturers and encouraging industry consolidation.
Supply Chain Constraints for Germanium and Other IR-Grade Materials
China supplies about 60% of refined germanium, and 2024 export curbs spiked prices by 38% within three months. Optics makers now hold 6-9 months of stock, tying up working capital. Recycling investments aim to reclaim germanium from fiber-optic scrap by 2027, but short-run supply remains tight. Alternatives such as chalcogenide glass and zinc selenide trade cost against optical performance, limiting substitution. Cooled mid-wave cameras remain especially exposed because Dewar windows require germanium for high transmission efficiency.
*Our forecasts treat driver/restraint impacts as directional, not additive. The impact forecasts reflect baseline growth, mix effects, and variable interactions.
IR (Infrared) Camera Market Segment Analysis
By Detector:
Uncooled Scale Meets Cooled PrecisionUncooled technology held a dominant 74.72% share of the infrared camera market in 2025, buoyed by sub-USD 800 price points and instant-on operation that suits commercial surveillance and handheld inspections. Pixel-pitch reductions and improved readout circuits pushed noise-equivalent temperature differences below 40 mK, making these detectors viable for predictive maintenance and building diagnostics. Nevertheless, cooled sensors are projected to post a robust 9.21% CAGR through 2031 as defense programs pursue 20 km identification ranges and scientific users demand sub-20 mK sensitivity for photon-starved applications. A recent USD 42.5 million contract for unmanned aerial systems highlights continued willingness to pay premiums for long-range clarity.
The performance gap is narrowing, yet cooled cameras still dominate missile-tracking and astronomy scenarios where photon counts are minimal. Vendors have enhanced reliability by extending Stirling-cooler lifetimes beyond 15,000 hours and reducing the size, weight, and power envelopes, thereby broadening airborne and space-borne deployment options. Meanwhile, uncooled detectors are benefitting from higher wafer yields that further depress costs, reinforcing their role as the volume engine of the infrared camera market.

By Material:
Germanium Dominance Faces Sapphire ResilienceGermanium optics owned 41.62% revenue in 2025, reflecting unrivaled 63% transmission across the 8-14 µm band, which enables compact lens stacks for perimeter security and building audits. Yet germanium’s brittleness and price volatility, driven by concentrated refining capacity, are prompting users to trial sapphire alternatives, which are growing at an 8.44% CAGR. Sapphire’s Mohs hardness of 9 boosts lens life in harsh industrial settings and its broad 0.2-5.5 µm transmission window supports dual-band imaging that detects gas leaks in petrochemical plants.
Hybrid lens assemblies mix germanium front elements with polymer rears to reduce costs by 22% while retaining 85% optical performance, according to a 2025 roadmap. Zinc selenide and chalcogenide glass remain niche due to high cost or brittleness, but material diversification strategies are gaining importance as export controls and price swings make single-source reliance risky. The infrared camera industry is therefore balancing optical performance requirements against resilience and total cost of ownership.
By Wavelength Type:
LWIR Maturity Versus SWIR MomentumLong-wave systems accounted for 46.63% of 2025 revenue by capitalizing on the cost leadership of uncooled microbolometers and atmospheric windows that permit passive imaging. Building-envelope inspections, electrical-panel scans, and perimeter security rely on temperature contrasts of just a few degrees. Short-wave infrared, while smaller today, is advancing at an 8.56% CAGR as machine-vision users exploit reflected radiation to image through silicon packaging, analyze pharmaceutical coatings, and grade agricultural produce.
Medium-wave infrared occupies a middle ground, delivering strong gas-leak visualization and high-temperature process monitoring. Dual-band cameras that toggle between SWIR and MWIR modes on a single detector are beginning to blur the lines between segments, allowing semiconductor fabs to inspect wafers during the day and monitor furnace temperatures at night. As multi-spectral fusion becomes mainstream, wavelength segmentation will increasingly hinge on software-defined switching rather than discrete hardware purchases, reshaping future infrared camera market size allocations.


By End-User Vertical:
Defense Legacy Meets Automotive VelocityMilitary programs retained a 34.62% share in 2025, leveraging fused thermal-visible goggles that outperform traditional night-vision tubes in smoke and dust. NATO procurement drives plus heightened border-security funding keep defense at the top of the revenue stack. The automotive segment, however, is the fastest-growing, with an 8.35% CAGR, as European pedestrian-detection rules and the thermal-management needs of electric vehicles push thermal cameras into volume production. High-end sedans can detect pedestrians at 100 meters and large animals at 200 meters, triggering automated braking in darkness.
Industrial utilities are integrating drone-mounted thermal cameras to locate hotspots on transmission lines, cutting outage events by 18% (EPRI.com). Commercial users deploy thermal units for airport perimeter security and municipal firefighting, while home energy audits are finally feasible with sub-USD 300 smartphone attachments that identify insulation gaps. The breadth of applications underscores how the infrared camera market continues to migrate from specialized defense roots toward ubiquitous commercial and consumer visibility.
Geography Analysis
North America IR (Infrared) Camera Market
North America held 38.73% of global revenue in 2025 as defense budgets above USD 850 billion sustained a large installed base of long-range systems. Updated electrical-maintenance codes now recommend quarterly thermal scans of data-center switchgear, driving demand for fixed networked cameras connected to cloud analytics. Residential adoption is rising in Canada’s cold provinces, where utility rebates cover up to 50% of camera costs for certified home inspectors, and Mexico’s automotive plants incorporate thermal inspection at final QA stations, reinforcing regional growth momentum.
APAC IR (Infrared) Camera Market
The Asia-Pacific region is forecast to post an 8.55% CAGR through 2031, as Chinese smart-city programs deployed more than 400,000 thermal cameras in 2024 alone. Vertically integrated players achieve 30-40% cost advantages, catalyzing the adoption of solutions across public-safety, traffic, and building-fire detection networks. India launched a USD 200 million R&D initiative to localize detector production for defense, while Japan mandates thermal bridge inspections on structures older than 50 years. South Korea’s fabs operate thousands of SWIR stations for sub-micron defect detection, and Australia’s mines utilize thermal cameras to prevent conveyor fires, demonstrating that regional use cases span the government, industrial, and resource sectors.
EMEA IR (Infrared) Camera Market
Europe’s growth is anchored by stringent energy-efficiency and automotive safety regulations. The Energy Performance of Buildings Directive mandates thermal audits for large commercial properties by 2030. German OEMs have already integrated thermal sensors into 14 vehicle models that achieved 5-star Euro NCAP ratings in 2024. France’s nuclear fleet operates thousands of cameras for steam-leak detection, reducing maintenance downtime, while the Middle East’s oil majors deploy thermal imaging to meet methane-emission reporting standards. Africa’s uptake remains focused on mining and power sectors, constrained by equipment costs but gradually widening as regional integrators bundle affordable maintenance services.

Regulatory Landscape
Infrared cameras and key subcomponents remain governed by dual-use export-control regimes, with U.S. Export Administration Regulations (EAR) classifications (commonly under ECCN 6A003/6A993 depending on performance thresholds) and related licensing requirements shaping cross-border shipments of high-spec thermal imagers and detectors. Enforcement activity intensified in February 2026 when the U.S. Department of Commerce, Bureau of Industry and Security (BIS) issued a final order imposing a USD 1,000,000 civil penalty on Teledyne FLIR LLC tied to violations involving unlicensed China-related thermal camera exports, reinforcing compliance scrutiny around end users, routing, and de minimis calculations.
On the demand side, procurement and product qualification are also shaped by security-of-supply rules and standards progress. The FY2026 NDAA (signed in Dec 2025) directs the U.S. Department of Defense to eliminate reliance on optical glass, infrared materials, and optical systems sourced from covered nations by January 1, 2030, which raises origin traceability requirements for optics and infrared materials used in defense-grade camera assemblies. Standards work is also broadening formal test and performance expectations for thermal imaging in safety and maintenance applications, including ISO workstreams such as ISO/FDIS 7240-33 (thermal imaging fire detectors) and ISO/DIS 25335 (thermographic testing for mechanical and electrical equipment), which vendors and integrators use to guide compliance-aligned product roadmaps.
Value Chain Analysis
The IR camera value chain runs from raw materials and substrates (notably optical-grade germanium and other IR-transmissive glasses) to detector fabrication (uncooled microbolometers and cooled FPAs such as InSb and InGaAs-based architectures). It then moves through optics and packaging (lens manufacturing, Dewar windows for cooled systems, hybridization, and calibration) and ends with system integration into fixed, handheld, airborne, and embedded modules. In practice, the ecosystem is typically organized as Tier 3 fabrication or foundry and core detector manufacturing, Tier 2 subsystem providers supplying modules (detector plus optics plus electronics), and Tier 1 system integrators packaging EO/IR payloads into defense, industrial, and commercial platforms, with distribution through OEM channels, integrators, and security or industrial automation installers.
Bottlenecks concentrate upstream and midstream, particularly around access to optical-grade germanium and other IR-grade materials, ROIC design and qualified fab capacity, hybridization yields for area arrays, and specialist labor for cooled-detector crystal growth and packaging. The FY2026 NDAA supply-chain restrictions through the January 1, 2030 compliance date are driving more documentation, traceability, and sourcing shifts for optics and IR materials, while OEM channels (including Teledyne FLIR OEM module programs) and subsystem specialists increasingly emphasize modular designs and origin-compliant components to protect lead times and program eligibility in defense and export-sensitive deployments.
Competitive Landscape
The infrared camera market remains moderately consolidated, with the top five vendors controlling roughly half of 2025 revenue. Teledyne FLIR, Raytheon Technologies, and L3Harris preserve leadership in defense and aerospace through long-standing prime contracts, ITAR compliance expertise, and security clearances. Hangzhou Hikvision and Zhejiang Dahua Technology dominate commercial surveillance via vertically integrated manufacturing and aggressive distributor financing, allowing 90-day payment terms that entice channel partners.
Strategic differentiation is shifting from hardware to software ecosystems. Subscription-based analytics platforms generate recurring revenue, as seen with Teledyne’s Prism AI, which charges USD 50 per camera per month and already contributes 18% of segment turnover. Emerging disruptors such as Seek Thermal and Topdon sell sub-USD 500 smartphone cameras, forcing incumbents to respond with entry-level lines or risk losing the prosumer segment. Patent filings reveal a pivot toward multi-spectral fusion, with 23 new Teledyne patents covering algorithms that combine thermal, visible, and radar data for autonomous vehicles.
Industry collaboration is intensifying at standards bodies like the IEC, where 11 vendors are co-authoring thermal-inspection protocols for photovoltaic arrays. The competitive field is bifurcating: a premium tier serving mission-critical defense, aerospace, and scientific users, and a volume tier targeting commercial security and consumer applications. Limited overlap between these tiers creates room for specialists while keeping overall market concentration in the mid-range.
IR (Infrared) Camera Industry Leaders
Teledyne FLIR LLC (Teledyne Technologies)
SPI Corp.
OPGAL Optronic Industries Ltd (Elbit Systems)
Seek Thermal, Inc.
Raytheon Technologies Corporation
- *Disclaimer: Major Players sorted in no particular order
IR (Infrared) Camera Market Companies Covered in this Report
- Teledyne FLIR LLC
- Raytheon Technologies Corporation
- Hangzhou Hikvision Digital Technology Co., Ltd
- Axis Communications AB
- Zhejiang Dahua Technology Co., Ltd
- Opgal Optronic Industries Ltd
- Leonardo DRS, Inc.
- Guide Sensmart Tech Co., Ltd
- Seek Thermal, Inc.
- Fluke Corporation
- Testo SE & Co. KGaA
- InfraTec GmbH Infrarotsensorik und Messtechnik
- SPI Corp.
- Bosch Security Systems GmbH
- Honeywell International Inc.
- L3Harris Technologies, Inc.
- Princeton Infrared Technologies, Inc.
- Excelitas Technologies Corp.
- Xenics nv
- Workswell s.r.o.

Market Opportunities and Future Outlook
Opportunities are expanding in automated thermography and machine-integrated inspection, where buyers prioritize continuous, analytics-ready thermal data over periodic manual scans. One concrete signal is the June 2026 technical collaboration announced by FLIR (Teledyne) and edevis GmbH, integrating the FLIR A6450 MWIR cooled camera into automated non-destructive testing (NDT) systems for real-time structural anomaly detection. This points to a route for cooled MWIR cameras beyond traditional defense and laboratory use into industrial automation cells and inline QA.
Another whitespace involves smaller, lower-power infrared sensing stacks that can be embedded into compact robots, drones, and portable diagnostic tools, supported by ongoing academic and applied R&D in new detector and optics concepts. In 2026, published work demonstrated silicon-compatible and monolithically integrated infrared imaging approaches, including switchable spectral response architectures spanning near-IR to SWIR. That reinforcement of interest in multi-spectral, software-driven platforms supports product strategies centered on compact dual-sensor modules, automated inspection workflows, and standardized thermography practices aligned with emerging ISO test methods, particularly as ITAR-free and export-flexible modules gain traction in commercial channels.
Recent Industry Developments in IR (Infrared) Camera Market
- July 2026: Teledyne FLIR Defense partnered with STORM to extend Black Recon missions across additional vehicle platforms by integrating the autonomous reconnaissance capability onto RADS Rapid Adapt and Deploy System configurations. The partnership improves interoperability for EO/IR-enabled reconnaissance kits and supports broader deployment through modular vehicle integration instead of platform-specific redesigns.
- April 2026: Teledyne FLIR Defense won a contract with WB Electronics S.A. to supply TacFLIR 280-HDEP multi-spectral surveillance systems for reconnaissance vehicles. The award supports the TacFLIR production program and stabilizes thermal imaging systems used in mobile ISR roles.
- October 2025: Teledyne FLIR launched the Hadron 640R dual-sensor module for drones and robots, combining a 640x512 LWIR detector with a 64 MP visible camera in an 84 g package. The release broadens addressable OEM designs that need tight SWaP integration and accelerates adoption of bi-spectral perception stacks in autonomous and semi-autonomous platforms.


IR (Infrared) Camera Market Report Scope and Research Methodology
Market Definition and Coverage
This market covers revenue earned from selling infrared (IR) cameras that capture images using IR wavelengths for detection, monitoring, and measurement across commercial, industrial, automotive, and defense uses, counted at the equipment level in USD.
Scope exclusions: We exclude downstream services such as installation labor, extended maintenance contracts, and unrelated analytics software that can be purchased separately.
Segments Covered in This Report
- By Detector
- Cooled
- Uncooled
- By Material
- Germanium
- Silicon
- Sapphire
- Rest of Materials
- By Wavelength Type
- Near and Short-wavelength IR (SWIR)
- Medium-wavelength IR (MWIR)
- Long-wavelength IR (LWIR)
- By End-user Vertical
- Military and Defense
- Automotive
- Industrial
- Commercial and Public
- Residential
- Rest of End-user Verticals
- By Geography
- North America
- United States
- Canada
- Mexico
- South America
- Brazil
- Argentina
- Rest of South America
- Europe
- United Kingdom
- Germany
- France
- Italy
- Spain
- Rest of Europe
- Asia-Pacific
- China
- Japan
- India
- South Korea
- Australia and New Zealand
- Rest of Asia Pacific
- Middle East and Africa
- Middle East
- Saudi Arabia
- United Arab Emirates
- Turkey
- Rest of Middle East
- Africa
- South Africa
- Nigeria
- Rest of Africa
- Middle East
- North America
Data Sources, Market Sizing, and Validation
Desk Research
For desk work, we first map the product boundary and demand signals using public sources that are easy to verify. Useful inputs came from sources such as U.S. Department of Defense budget documents, U.S. Bureau of Labor Statistics and Census manufacturing data, UN Comtrade trade statistics for imaging and optical equipment, and published materials from standards and safety bodies that influence thermal inspection needs.
Along with those, we review company annual reports, investor decks, product catalogs, and credible press to understand where IR cameras are being adopted and what features are pushing pricing up or down. Patent databases and an import and export shipment-level database were used selectively to sanity-check technology direction and cross-border movement trends when public detail was thin. These desk sources are illustrative only, and we used additional public references for data collection, validation, and clarification.
Primary Interviews and Surveys
Primary inputs came from interviews and surveys with manufacturers, component and channel participants, system integrators, and end users that procure IR cameras for inspection, security, automotive testing, and defense programs. Because the market is global, we cross-checked assumptions across APAC, EMEA, and the Americas so pricing, adoption timing, and the regulatory pull-through were not overgeneralized from one region.
Distribution of primary research fieldwork respondents
| Company type | Respondent position | Region |
|---|---|---|
| Top tier: 34% | CXOs: 18% | APAC: 37% |
| Mid tier: 48% | Functional/Unit leaders: 24% | EMEA: 36% |
| Smaller Players: 18% | Managers: 58% | Americas: 27% |
Market-Sizing & Forecasting
The core sizing is built using a top-down approach where production, trade, and end-use adoption indicators are used to reconstruct the addressable demand pool for IR cameras by region and key use cases, and then translated into revenue. After that, we apply selective bottom-up approximations to keep totals realistic, using sampled average selling prices (ASPs) tied to expected unit volumes, plus channel checks on mix between cooled and uncooled systems.
In practice, the model is guided by variables such as defense and public safety procurement activity, industrial thermography adoption for predictive maintenance, automotive safety and battery testing intensity, pricing movement in uncooled microbolometer based cameras, and the mix shift by wavelength classes (SWIR, MWIR, LWIR). Where unit counts are not directly observable, gaps are handled by using proxy penetration rates from interviews, then stress-testing those assumptions against trade flows and known application build cycles.
For forecasting, scenario analysis is used to reflect how sensitive demand is to security spending cycles, industrial capex timing, and the pace of automotive integration. The final growth path is then aligned with what primary respondents described as the most likely adoption curve across major regions and end-user groups.
Data Validation & Update Cycle
Validation is done through multiple checks so the final totals do not rely on one data trail. We compare outputs against independent signals such as import and export trends, procurement and budget direction in large end-user programs, and observed pricing ranges by camera type, then review outliers before sign-off.
If a variance is material, we re-check assumptions and re-contact relevant experts to confirm whether it is a real market shift or a modeling artifact. The report is refreshed annually, and interim updates are made when major policy, trade, or technology events can shift volumes or ASPs. Right before delivery, an analyst runs a fresh pass to ensure the latest public updates are reflected consistently in the model.
Mordor Intelligence's Ir Camera Market Sizing Compared With Other Published Estimates
Published market sizes for IR cameras can look far apart even when the topic sounds the same, because the counting boundary is not always consistent. Differences usually come from what gets treated as a camera versus a broader infrared imaging system, which end uses are included, and how pricing is projected across cooled and uncooled products.
By tracking detector mix, wavelength class splits (SWIR, MWIR, LWIR), and realistic ASP movement through the forecast window, Mordor Intelligence keeps the IR camera total anchored to equipment revenue only, which avoids inflating the number with adjacent software, services, or loosely defined imaging modules.
Benchmark comparison
| Source | Market Size | Gaps in Research Methodology |
|---|---|---|
| Mordor Intelligence | USD 10.72 B (2026) | |
| Industry Publisher A | USD 8.33 B (2024) | Uses an earlier base year and can understate nearer-term demand if defense and industrial inspection cycles are not normalized, and if cooled system adoption is treated as a slow-moving niche across regions. |
| Global Consultancy B | USD 10.05 B (2025) | Broader component and offering coverage can shift the boundary toward full infrared camera ecosystems, and currency timing plus longer forecast windows can change how ASP decline and mix shift are applied. |
The spread mainly comes from boundary choices and from how ASPs are carried forward when product mix changes between cooled and uncooled cameras. With clear equipment-only rules, measurable demand indicators, and repeatable checks against trade and procurement signals, the estimate stays balanced and easier to audit year to year.


Key Questions Answered in the Report
What is the current value of the infrared camera market?
The infrared camera market size reached USD 10.72 billion in 2026 and is forecast to hit USD 15.72 billion by 2031.
Which segment of thermal detectors is growing fastest?
Cooled detectors are set to grow at a 9.21% CAGR through 2031 as defense and scientific users demand higher sensitivity.
Why are thermal cameras important for electric vehicles?
They provide real-time cell-level temperature mapping that detects hotspots seconds earlier than embedded sensors, preventing thermal runaway.
How do export controls affect infrared camera suppliers?
ITAR and Wassenaar rules delay shipments of high-spec detectors by up to a year and drive up compliance costs, encouraging buyers to seek domestic alternatives.
What is driving Asia-Pacific demand for thermal imaging?
Smart-city deployments, indigenous detector R&D funding, and semiconductor inspection uses are pushing Asia-Pacific toward an 8.55% CAGR through 2031.
Page last updated on:


 Your data is secure and never sold or shared.


