
Machine Vision Camera Market Size and Share
Market Overview
| Study Period | 2020 - 2031 |
|---|---|
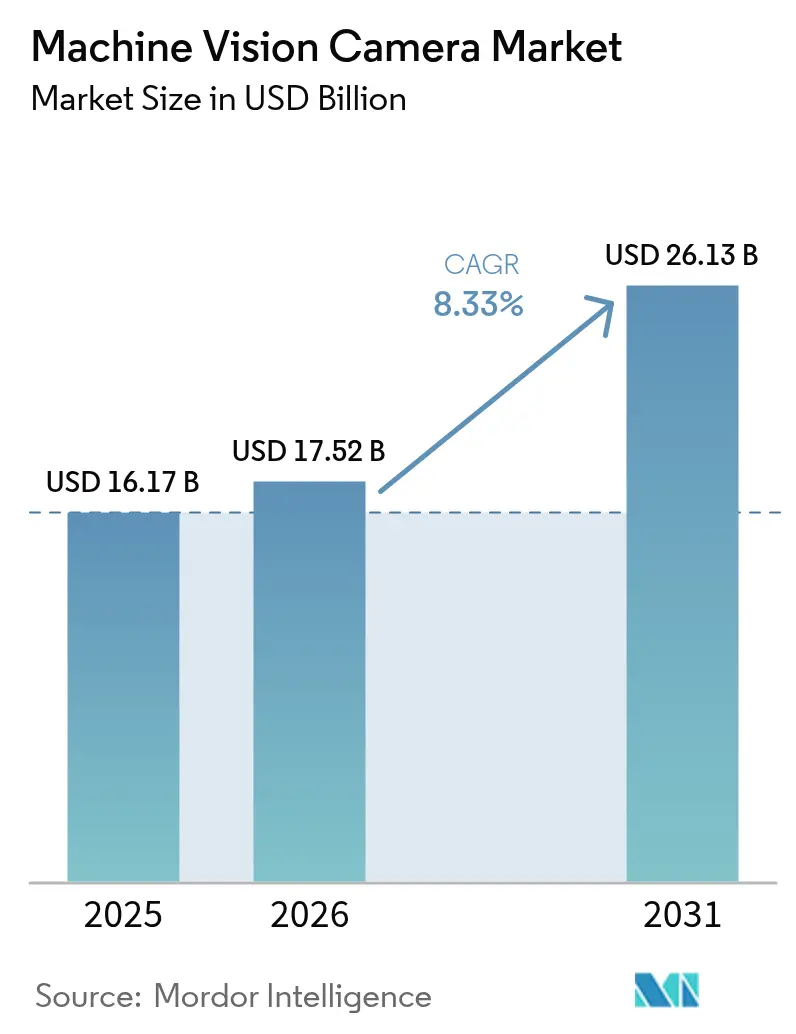
| Market Size (2026) | USD 17.52 Billion |
| Market Size (2031) | USD 26.13 Billion |
| Growth Rate (2026 - 2031) | 8.33 % |
| Fastest Growing Market | Asia Pacific |
| Largest Market | North America |
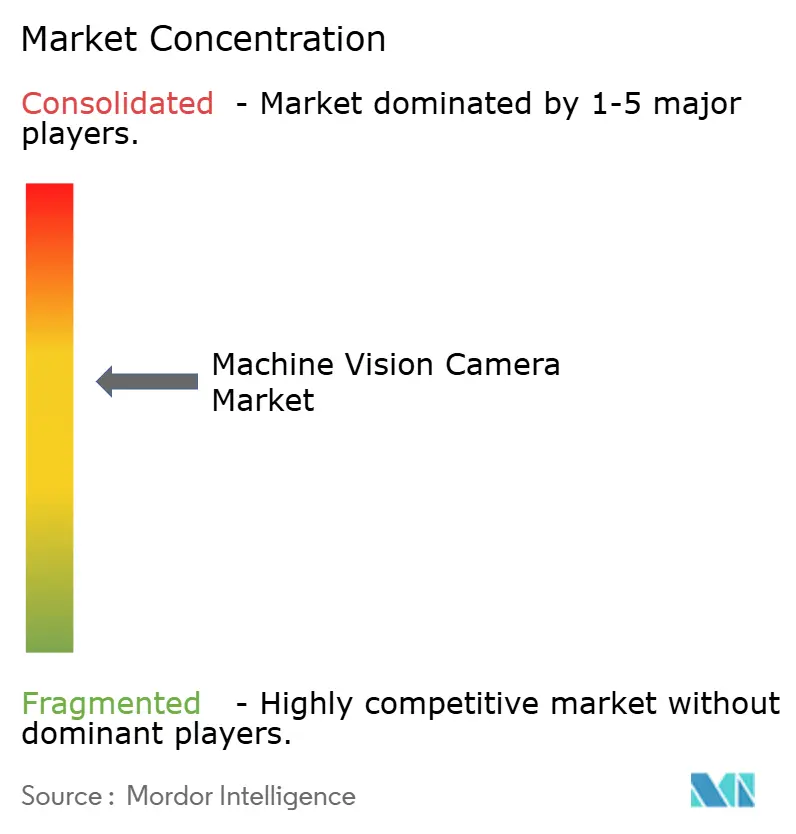
| Market Concentration | Medium |
Major Players *Disclaimer: Major Players sorted in no particular order Image © Mordor Intelligence. Reuse requires attribution under CC BY 4.0. | |
Machine Vision Camera Market Analysis by Mordor Intelligence
The machine vision camera market size is expected to grow from USD 16.17 billion in 2025 to USD 17.52 billion in 2026 and is forecast to reach USD 26.13 billion by 2031 at 8.33% CAGR over 2026-2031. Intensifying factory-floor automation, tighter quality-control mandates in electronics and EV battery production, and the rapid pairing of cameras with edge-AI processors are propelling demand. Area scan models retain the broadest reach because of their versatility, while line scan units post the quickest gains as continuous-process industries scale inspection widths. Global-shutter CMOS sensors remain the performance-to-cost sweet spot, yet SWIR devices are carving new opportunities in battery moisture analysis and semiconductor wafer metrology. Interface selection is also reshaping competition; USB3 Vision dominates volume shipments, whereas CoaXPress races ahead in bandwidth-hungry inspection lines. Regional momentum is shifting: North America still commands the revenue lead, but Asia Pacific is registering the briskest expansion on the back of massive smart-factory build-outs in China, South Korea, and the ASEAN bloc.
Key Report Takeaways
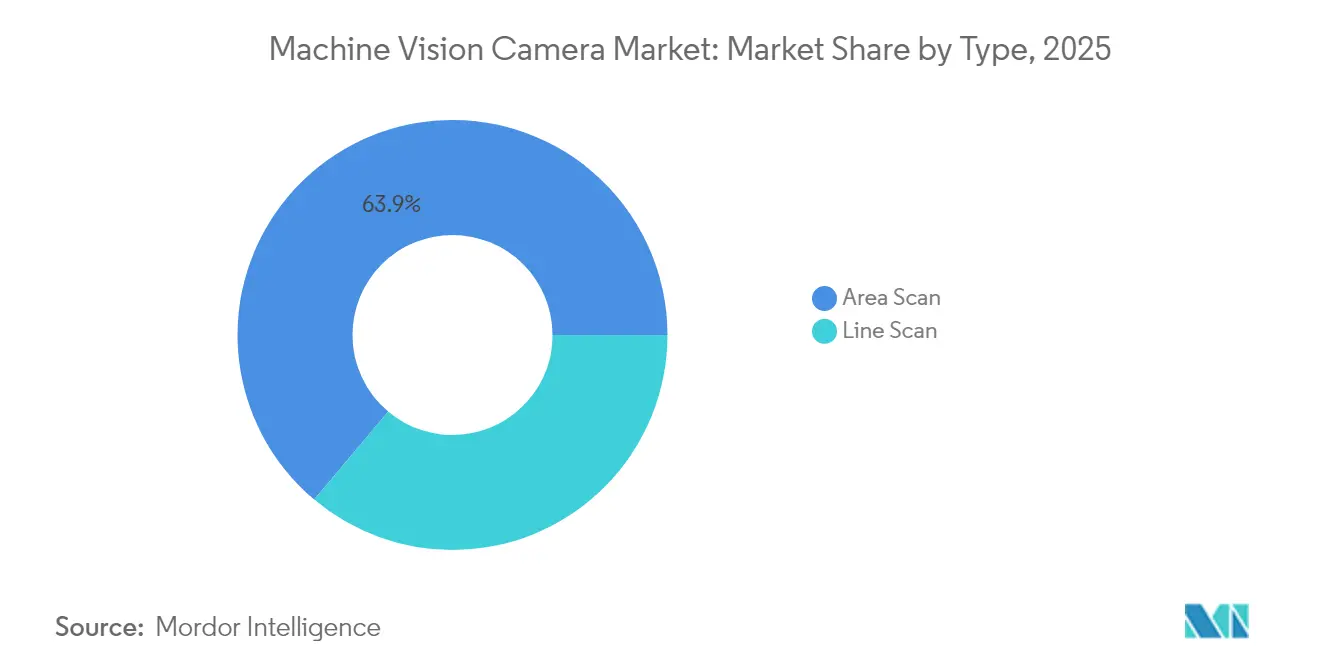
- By type, area scan cameras led with 63.88% of machine vision camera market share in 2025; line scan cameras are projected to expand at a 9.27% CAGR to 2031.
- By interface, USB3 Vision held 41.08% share of the machine vision camera market size in 2025, while CoaXPress records the highest projected CAGR at 9.05% through 2031.
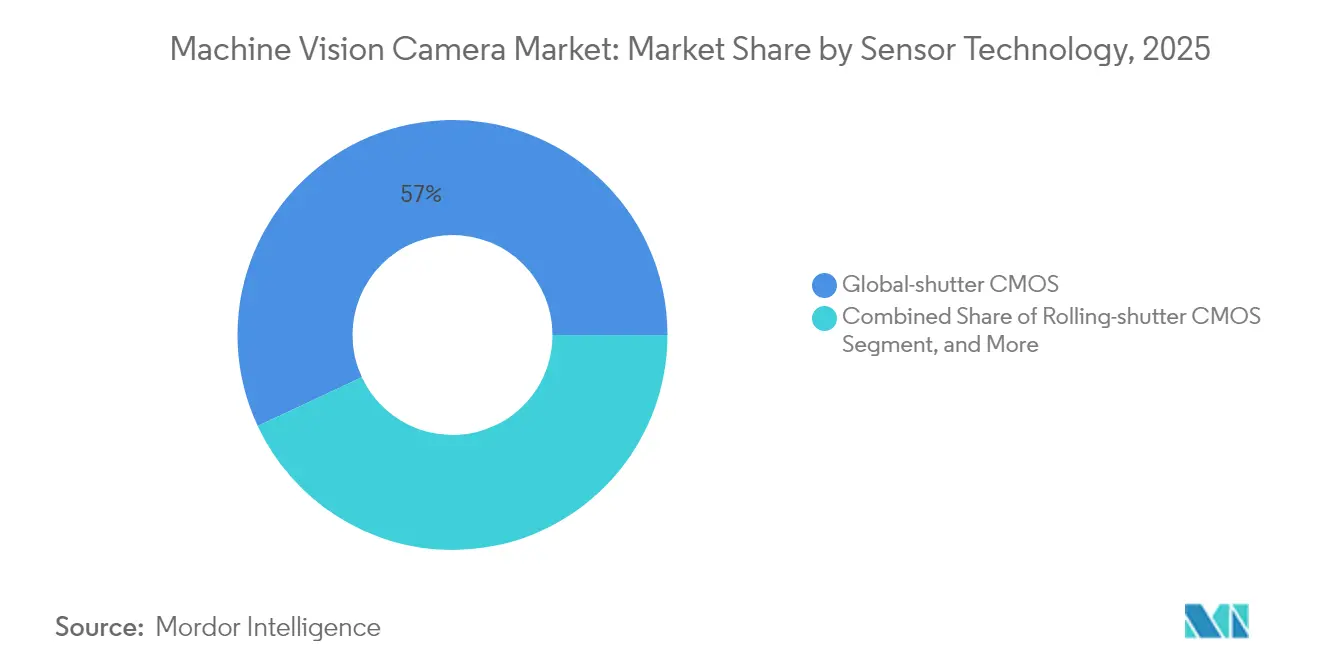
- By sensor technology, global-shutter CMOS accounted for 56.95% share of the machine vision camera market size in 2025 and SWIR sensors are advancing at a 9.16% CAGR to 2031.
- By end-user industry, electronics and semiconductor manufacturing captured 32.14% of machine vision camera market share in 2025; automotive and EV battery inspection is rising at an 8.76% CAGR through 2031.
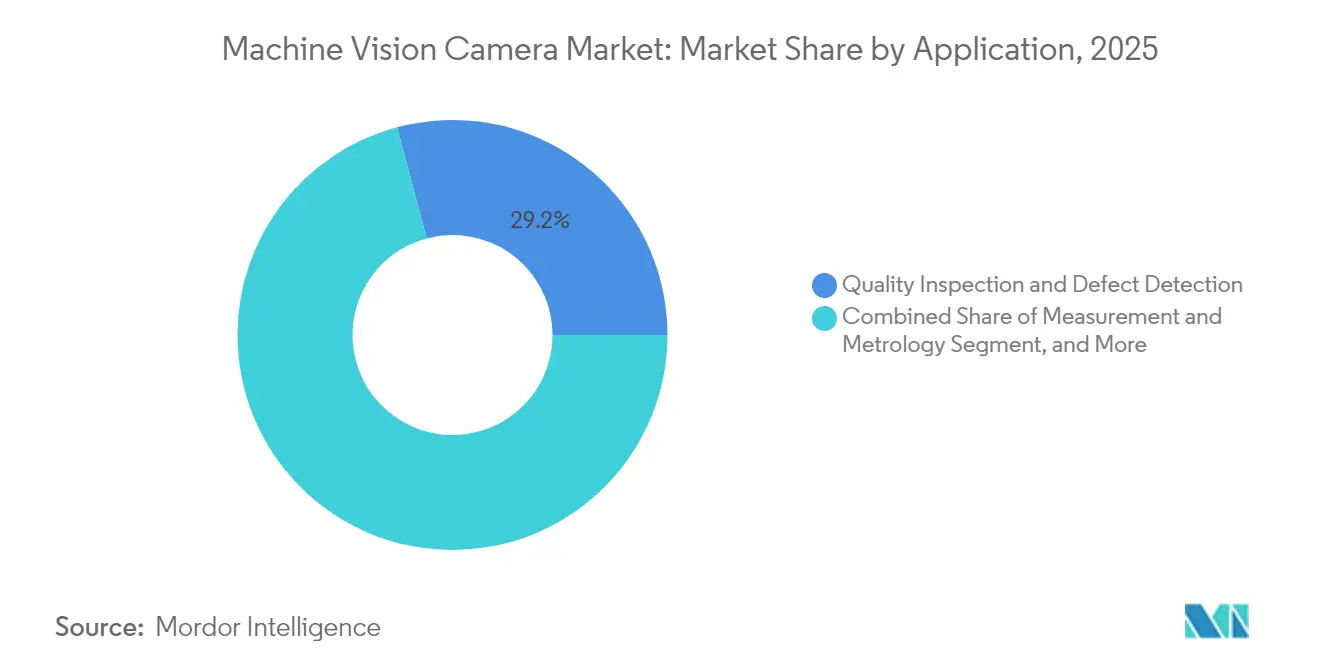
- By application, quality inspection and defect detection accounted for 29.15% share of the machine vision camera market size in 2025 and predictive / condition monitoring are advancing at a 8.59% CAGR to 2031.
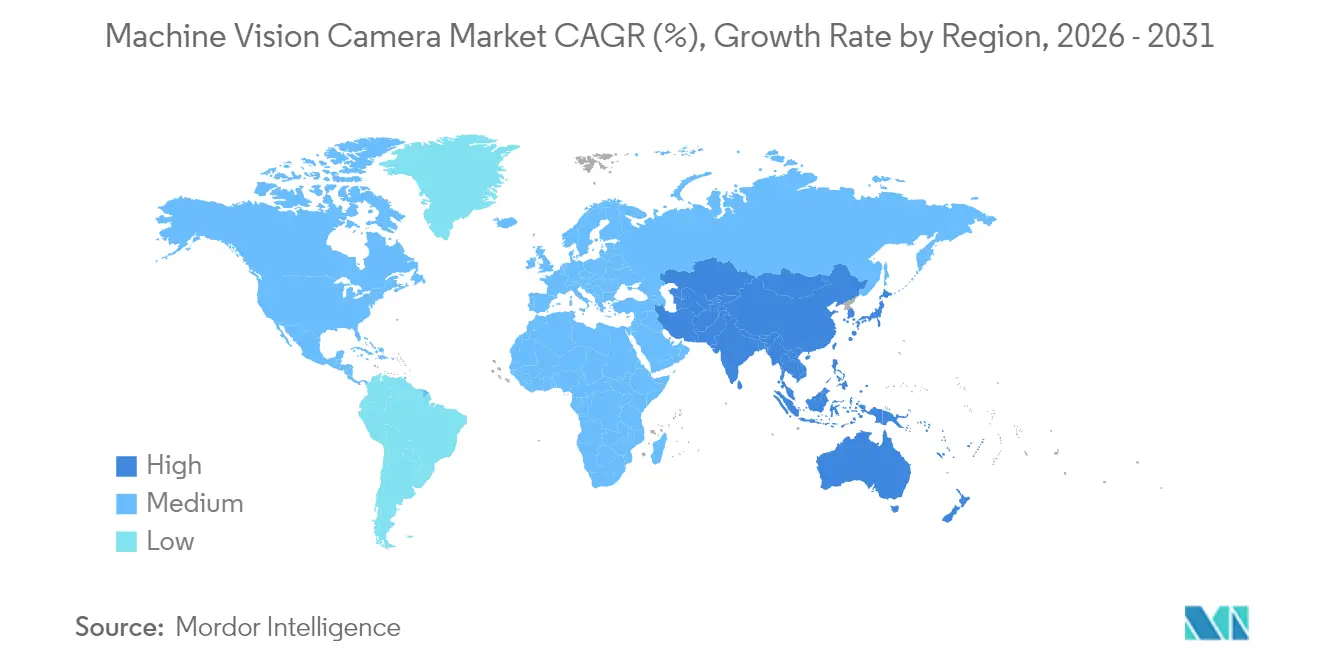
- By geography, North America led with 39.32% revenue share in 2025 in machine vision camera market, whereas Asia Pacific is forecast to progress at a 8.93% CAGR to 2031.
Note: Market size and forecast figures in this report are generated using Mordor Intelligence’s proprietary estimation framework, updated with the latest available data and insights as of 2026.
Global Machine Vision Camera Market Trends and Insights
Drivers Impact Analysis*
| Driver | (~) % Impact on CAGR Forecast | Geographic Relevance | Impact Timeline |
|---|---|---|---|
| Rapid factory-floor automation wave | +2.1% | Global, with APAC leading adoption | Medium term (2-4 years) |
| Falling camera ASPs with CMOS and USB3 adoption | +1.8% | Global, particularly emerging markets | Short term (≤ 2 years) |
| Tightening quality-control mandates in 3C and EV | +1.5% | APAC core, spill-over to North America and EU | Medium term (2-4 years) |
| Edge-AI cameras slashing bandwidth costs | +1.3% | Global, with early adoption in North America and EU | Long term (≥ 4 years) |
| Subsidised smart factory loans in ASEAN | +0.9% | ASEAN nations, expanding to broader APAC | Short term (≤ 2 years) |
| On-robot SWIR vision for lithium-battery QC | +0.8% | Global, concentrated in EV manufacturing hubs | Medium term (2-4 years) |
| Source: Mordor Intelligence | |||
Rapid Factory-Floor Automation Wave
Labor shortages and uniform-quality goals are pushing manufacturers to adopt vision-guided robotics at scale. Taiwan Semiconductor Manufacturing Company broadened automated optical inspection to 16 fabs in 2024, shortening feedback loops for sub-10 nm nodes.[1]Taiwan Semiconductor Manufacturing Company, “Technology Platform and Manufacturing Excellence,” tsmc.com Food processors now rely on vision to isolate contaminants, aligning with stricter safety codes. Small-batch producers are also moving in, as collaborative robots paired with compact cameras cut changeover losses. This breadth of adoption lifts the machine vision camera market across both high-volume and custom production lines.
Falling Camera ASPs with CMOS and USB3 Adoption
Global-shutter CMOS output has grown quickly, driving 15-20% annual price drops since 2024. Standardized USB3 Vision connectors remove frame-grabber fees and simplify cabling, making entry-level deployments viable for mid-tier factories.[2]USB Implementers Forum, “USB3 Vision Standard Specifications,” usb.org In Southeast Asia, first-time buyers are equipping SMT lines with USB3 cameras priced below USD 800. Margin pressure is steering legacy brands toward differentiating through device-side AI and specialty optics rather than raw hardware.
Tightening Quality-Control Mandates in 3C and EV
The European Union Battery Regulation took effect in 2024 and obliges traceable, full-field inspection of lithium-ion cells, pushing camera installations from sampling to 100% coverage.[3]European Commission, “Regulation on Batteries and Waste Batteries,” europa.eu Apple’s supply partners spent more than USD 2 billion on defect-detection equipment in 2024 to police micro-cracks in foldable displays. As product tolerances shrink, manufacturers prioritize resolution and dynamic range, boosting demand for high-pixel-count global-shutter and SWIR designs.
Edge-AI Cameras Slashing Bandwidth Costs
Intel’s 2024 acquisition of on-sensor inference IP highlights how embedded neural engines can cut outbound data by 90%.[4]Intel Corporation, “Edge AI and Computer Vision Solutions,” intel.com Plants in remote locations use such units to sidestep unreliable networks while still gaining real-time anomaly alerts. As firmware upgrades unlock new algorithms post-installation, buyers begin to value software lifecycles as much as sensor specs, repositioning competitive criteria across the machine vision camera market.
Restraints Impact Analysis*
| Restraint | (~) % Impact on CAGR Forecast | Geographic Relevance | Impact Timeline |
|---|---|---|---|
| Shortage of skilled machine-vision engineers | -1.4% | Global, acute in North America and EU | Long term (≥ 4 years) |
| Fragmented interface standards inflate BOM | -0.9% | Global, particularly affecting system integrators | Medium term (2-4 years) |
| Rising export controls on high-speed sensors | -0.7% | US-China trade corridor, expanding globally | Short term (≤ 2 years) |
| Thermal design limits for onboard AI SoCs | -0.5% | Global, concentrated in harsh industrial environments | Long term (≥ 4 years) |
| Source: Mordor Intelligence | |||
Shortage of Skilled Machine-Vision Engineers
Vacancy rates for advanced vision roles top 40% in North America and Europe. Universities struggle to update curricula that merge optics, AI frameworks, and real-time protocol stacks. As a result, plants outsource projects to turnkey integrators, trading flexibility for quicker deployment. The talent gap is more acute in emerging fields like SWIR spectroscopy and 3D time-of-flight, lengthening project schedules and dampening the overall machine vision camera market growth.
Fragmented Interface Standards Inflate BOM
USB3 Vision, GigE Vision, CoaXPress, Camera Link, and legacy LVDS all vie for share, forcing integrators to stock multiple cables, connectors, and frame grabbers. Global manufacturers pay up to 12% higher spare-parts overhead because each region favors a different protocol. Lack of cross-compatibility complicates multi-plant rollouts and slows upgrade cycles.
*Our forecasts treat driver/restraint impacts as directional, not additive. The impact forecasts reflect baseline growth, mix effects, and variable interactions.
Segment Analysis
By Type: Advanced Line Scan Adoption Outpaces Area Scan Dominance
Line scan cameras address continuous materials such as rolled steel, textiles, and photovoltaic ribbons and are forecast to compound at 9.27% through 2031. High-resolution arrays paired with multi-spectral filters uncover sub-surface defects during blister-pack production and grain-level anomalies in pharmaceutical tablets. Continuous web processes, once reliant on stroboscopic lighting, now leverage faster line rates that match conveyor speeds above 500 m per minute, underscoring why this niche is climbing inside the broader machine vision camera market.
Area scan units still command 63.88% of 2025 revenue. Recent sensor shifts to global-shutter exposure removed motion-blur, unlocking inspection of fast-moving bottle caps, PCB solder joints, and EV power-module leads. Integrating polarizing filters enables detection of stress patterns in molded plastic, while embedded time-of-flight modules extend capability into basic 3D gauging. Vendors thereby safeguard area scan relevance even as line scan adoption widens.



By Interface Standard: CoaXPress Closes the Gap with USB3 Vision
USB3 Vision delivers 41.08% of 2025 shipments owing to universal PC compatibility. In low-cost electronics assembly, plug-and-play driver stacks and power-over-cable set-ups slash installation hours. Price-sensitive buyers equate standard USB components with serviceability, which helps sustain top-line volume for this interface within the machine vision camera market size.
CoaXPress addresses the opposite end of the bandwidth spectrum and is rising at 9.05% CAGR. Single-cable links now stream 25 Gbps while powering a 65 MP sensor, crucial for inspecting micro-via diameters on advanced PCBs. Automotive battery cell plants adopt CoaXPress to image electrode coatings at 700 fps, a feat beyond USB3. Meanwhile, GigE Vision and its 5 Gig and 10 Gig variants remain relevant where in-plant Ethernet backbones already exist, trading lower frame rates for easy network routing.
By Sensor Technology: SWIR Broadens Use-Cases Beyond CMOS Core
Global-shutter CMOS underpins 56.95% of shipments and continues to fall in price as 65 nm fabs scale volume. Pixel-size downsizing preserves quantum efficiency gains, which keeps CMOS ahead of CCD in most high-throughput lines. Rolling-shutter formats retain a foothold in fixed-part inspection where costs dictate and motion is minimal.
SWIR climbs at 9.16% CAGR as lithium-ion battery makers exploit water-detection at 1,450 nm to prevent dendrite formation, and wafer fabs verify silicon stoichiometry at 1,200 nm. Vendors integrate thermo-electric cooling to restrain dark current, expanding exposure windows in low-light setups. CCD and intensified CCD remain niche for long-exposure scientific imaging, while time-of-flight arrays edge into palletizing robots that need depth mapping within a single housing.
By End-User Industry: EV Battery Lines Lead Growth
Electronics and semiconductor fabs absorbed 32.14% of 2025 sales, driven by chiplet bonding yields and foldable-phone hinge checks. However, automotive battery inspection vaults forward at 8.76% CAGR, with cell-to-pack designs requiring multiple vision checkpoints per line. Tesla’s investments in inline electrode thickness analytics illustrate the scale of camera demand. Life-sciences plants pivot to 100% tablet coating inspection, and food plants install hyperspectral cameras to flag mycotoxin contamination. Aerospace shops hold steady, tethered to traceability codes etched on turbine parts.
By Application: Predictive Monitoring Takes Off
Quality inspection and defect detection holds 29.15% of 2025 revenue and remains the launchpad for newcomers to automation. Vision-guided robotics now tackles complex insertions inside EV inverter assemblies, merging pick-and-place with guidance at sub-0.1 mm precision. Metrology expands as aerospace primes validate 5-axis machined parts without coordinate-measuring machines. Predictive and condition monitoring advances at 8.59% CAGR, embedding cameras on press brakes and reflow ovens to classify anomalies before failure, thereby reinforcing Industry 4.0 objectives.
Geography Analysis
North America recorded 39.32% of 2025 revenue, capitalizing on early adoption in aerospace, medical devices, and advanced driver-assistance systems. Federal incentives for domestic semiconductor fabs sustain camera retrofits that verify 300 mm wafer uniformity. The machine vision camera market size in the region is projected to keep pace as carmakers shift to local battery cell production lines.
Asia Pacific is advancing at a 8.93% CAGR, underpinned by China’s smart-manufacturing subsidies and South Korea’s semiconductor clean-room expansions. ASEAN incentives for SME digitization broaden the customer base, while Japan doubles down on high-speed CoaXPress cameras for 3D IC inspection. The cluster effect of component suppliers, integrators, and academic labs accelerates cycle times for pilot projects and bolsters collective know-how, deepening the machine vision camera market penetration.
Europe maintains balanced momentum rooted in stringent regulatory frameworks. Pharma plants install serialization-ready cameras to meet EU Falsified Medicines Directive renewal, and automakers roll out combined 2D-plus-3D stations to validate laser-weld seams on battery enclosures. Sustainability targets spur vision-based scrap sorting in metal recycling, underscoring green mandates as a secondary driver. Emerging economies in South America and the Middle East begin to deploy vision-aided logistics hubs, foreshadowing gradual expansion beyond core manufacturing heartlands.

Regulatory Landscape
Compliance for machine vision cameras is increasingly shaped by standardized performance and interface frameworks alongside region-specific product and AI governance. Sensor and camera characterization practices commonly reference ISO 24942 and EMVA 1288, while interoperability on factory networks is influenced by the GigE Vision standard maintained by the Association for Advancing Automation (AIA). In Europe, the AI Act (Regulation (EU) 2024/1689) sets a formal timeline, with full application referenced for August 2026, and it intersects with product safety obligations under the EU Machinery Regulation (EU) 2023/1230 for equipment placed on the EU market.
Trade and data governance also affect sourcing and deployment choices. In the United States, tariff administration through the Harmonized Tariff Schedule and subsequent federal actions introduced additional cost and documentation considerations; a January 2026 presidential proclamation imposed a 25% ad valorem duty on certain semiconductors and manufacturing equipment effective January 15, 2026, influencing BOM planning and supplier selection for high-speed sensors and related electronics. In China, MIIT released reference guidance in May 2026 on industrial data element application for smart sensors, and industrial AI deployment guidance from national standardization bodies is being used as an input for audit checklists for systems that combine cameras with edge AI, tightening expectations around explainability, local data storage, and human review in visual inspection workflows.
Value Chain Analysis
The value chain spans image sensor and semiconductor components, optics and illumination, camera electronics and interface stacks (USB3 Vision, GigE Vision, CoaXPress), and downstream system integration that bundles cameras with lighting, software, and edge compute for vertical deployments such as electronics, EV batteries, logistics, and food inspection. Sensor supply, including global-shutter CMOS and specialty SWIR, together with interface ecosystems, drives cost, lead time, and upgrade cadence. System integrators and OEM automation partners then translate component availability into validated inspection cells and multi-site rollout playbooks.
Recent supply chain moves point to continued regionalization and shifts in manufacturing footprints alongside platform standardization. HyVision System broke ground in February 2025 on an INR 400 million plant near Foxconn’s Devanahalli, Bengaluru facility to localize production of camera inspection equipment. Machine Vision Products, Inc. expanded manufacturing in Malaysia in May 2025 to assemble MVP 900 Series AOI systems, reflecting efforts to shorten lead times and reduce exposure to cross-border cost volatility. On the technology supply side, the December 2025 launch of a production-ready MIPI A-PHY machine vision platform by Valens Semiconductor and CIS Corporation underscores automotive-grade, EMI-resilient connectivity moving into industrial vision designs, enabling smaller camera modules and broadening the supplier ecosystem beyond legacy frame-grabber-centric architectures.
Competitive Landscape
The machine vision camera market hosts a moderately fragmented field with no firm exceeding 15% share, granting room for both large incumbents and nimble specialists. Cognex emphasizes edge analytics and turnkey integration, positioning software as its moat. Basler leverages German production discipline to supply high-volume, mid-price cameras and lengthens its reach via AI-enabled firmware updates. Keyence invests in regional manufacturing footprints to sidestep tariff exposure and accelerate delivery.
Strategic activity has pivoted from sensor counts to embedded intelligence. Patent filings in 2024 cluster around neural network compression and thermally optimized board layouts for inference chips, an indicator of emerging competitive levers. Regional players in China and South Korea win battery and display contracts by bundling SWIR optics with localized support. System integrators meanwhile craft vertical-specific modules that couple cameras, lighting, and edge boxes, compressing rollout times for tier-two manufacturers and intensifying pressure on component-only suppliers.
Long-term prospects hint at selective consolidation as ASIC costs climb and customers favor vendors that guarantee multi-year silicon roadmaps. Still, specialized niches, ultra-high-speed event cameras and micro-spectral imagers, stay open to start-ups that can translate academic breakthroughs into rugged industrial form factors.
Machine Vision Camera Industry Leaders
Keyence Corporation
Adimec Advanced Image Systems BV
Allied Vision Technologies GmbH
Basler AG
Cognex Corporation
- *Disclaimer: Major Players sorted in no particular order

Market Opportunities and Future Outlook
White space is expanding around edge-AI vision architectures, high-bandwidth interfaces, and specialty sensing where buyers want 100% inspection coverage and faster deployment across multiple sites. The EU Battery Regulation taking effect in 2024 is pushing more traceable, full-field inspection of lithium-ion cells, which supports demand for high-resolution global-shutter CMOS and for SWIR in moisture and material analysis use cases. At the same time, fragmented interface standards keep inflating integrator BOM and spares overhead, creating opportunity for camera vendors and ecosystem partners that deliver validated, interoperable reference designs across USB3 Vision, CoaXPress, and emerging options such as MIPI-based approaches.
Capacity build-out and ecosystem formation are visible in 2026 activity and reinforce commercialization pathways beyond core discrete manufacturing. In April 2026, Goertek Technology Vina announced a USD 20 million investment to expand camera production at its Bac Ninh, Vietnam facility, and Orbbec held a May 2026 groundbreaking for an RVMC factory in Bac Ninh planned for 3D vision sensors and smart hardware production, indicating deeper supply availability for 3D and smart sensor categories used in automation and logistics. On the product side, major vendors are integrating AI compute into vision systems, including Cognex launching powered by NVIDIA Jetson and Qualcomm Dragonwing platforms in 2026, supporting deployments where inference runs locally and reducing dependence on external PCs and high-throughput backhaul, which fits the remote-plant and high-mix manufacturing constraints shaping camera selection.
Recent Industry Developments
- May 2026: Cognex launched the In-Sight 3900 Vision System, an integrated embedded AI vision system powered by Qualcomm Dragonwing platforms. The release advances the shift toward higher-performance, device-side inference for inspection use cases such as battery defect detection, reducing reliance on external PCs and simplifying deployment in space-constrained cells.
- October 2025: Basler signed an agreement to acquire a majority stake in its distribution partner in India. The move strengthens channel control and local execution in a fast-growing manufacturing geography, improving responsiveness for camera supply, support, and integration coordination.
- June 2024: Basler acquired a 25.1% stake in Roboception to expand its 3D solution capabilities for factory automation and logistics. The investment deepens Basler's access to 3D vision know-how and accelerates portfolio expansion beyond 2D cameras into application-ready sensing stacks for robotics and material handling.


Research Methodology Framework and Report Scope
Market Definition and Coverage
This market covers revenue generated from machine vision camera hardware used to capture images for industrial inspection, measurement, identification, and vision-guided automation in production and logistics environments.
Scope exclusions: The sizing excludes general-purpose consumer cameras, security and surveillance cameras, and imaging devices used mainly for medical diagnostics or aerial or satellite imaging.
Segmentation Overview
- By Type
- Area Scan
- Line Scan
- By Interface Standard
- USB3 Vision
- GigE / 5-10 GigE Vision
- Camera Link / HS
- CoaXPress
- Other / Emerging (MIPI, Thunderbolt)
- By Sensor Technology
- Global-shutter CMOS
- Rolling-shutter CMOS
- CCD
- SWIR / MWIR
- Time-of-Flight 3D
- By End-user Industry
- Electronics and Semiconductor
- Automotive and EV Battery
- Healthcare and Life-science
- Food and Beverage Processing
- Aerospace and Defence
- Logistics and Warehousing
- Other Industries
- By Application
- Quality Inspection and Defect Detection
- Measurement and Metrology
- Identification / OCR and Traceability
- Vision-Guided Robotics
- Predictive / Condition Monitoring
- By Geography
- North America
- South America
- Europe
- Asia Pacific
- Middle East and Africa
Data Sources, Market Sizing, and Validation
Desk Research
Desk work starts by mapping what drives demand for machine vision cameras, then tying those drivers to measurable data points that can be tracked each year. We mainly use public sources that reflect automation intensity and manufacturing activity by region and industry.
Examples include industrial production and trade statistics from agencies such as the US Census Bureau and Eurostat, customs and tariff-line import and export datasets, and manufacturing surveys published by central banks and national statistics offices. We also use standards and interface documentation from industry bodies, such as the organizations behind GigE Vision and USB3 Vision, along with patent databases to see where sensor and interface innovation is concentrating, and peer-reviewed journals covering industrial imaging and metrology. Company filings, investor presentations, reputable press coverage, and paid subscriptions for company financials, news, patents, and shipment-level import and export data are used to cross-check assumptions. These sources are not exhaustive, and we reviewed additional public materials for data collection, validation, and clarification.
Primary Interviews and Surveys
Primary inputs come from interviews and structured surveys with camera and component ecosystem participants, system integrators, and end-user engineering and operations teams that buy or specify cameras for automation lines. We use these discussions to confirm adoption rates by industry, typical price bands by camera class, and how interface and sensor choices are shifting across APAC, EMEA, and the Americas.
Distribution of primary research fieldwork respondents
| Company type | Respondent position | Region |
|---|---|---|
| Top tier: 25% | CXOs: 13% | APAC: 40% |
| Mid tier: 59% | Functional/Unit leaders: 27% | EMEA: 34% |
| Smaller Players: 16% | Managers: 60% | Americas: 26% |
Market-Sizing & Forecasting
The core model is built using a top-down approach where manufacturing output, automation intensity, and inspection requirements are used to reconstruct the addressable demand pool for machine vision camera hardware by region. Once that demand pool is framed, it is converted into annual revenue using adoption and replacement timing assumptions validated with industry practitioners.
To keep totals realistic, we corroborate with selective bottom-up approximations, including sampling camera shipments and average selling prices by interface class, such as GigE Vision, USB3 Vision, and CoaXPress, and checking results against channel feedback and integrator ordering patterns. Key inputs include factory automation investments, production growth in electronics and automotive, the mix shift between area scan and line scan use cases, the pace of CMOS versus CCD substitution, and average price differences driven by resolution, frame rate, and ruggedization requirements. When bottom-up signals are incomplete for niche camera types, we use conservative penetration bands and then recheck the implied spend per automated line with interview feedback.
For forecasting, we use scenario analysis supported by simple multivariate relationships, where camera demand is linked to industrial output, automation spending, and inspection intensity by end-use. Assumptions are reviewed with primary experts so the forecast reflects expected interface adoption, sensor cost trends, and practical procurement cycles, rather than producing only a smooth curve.
Data Validation & Update Cycle
Validation is done through triangulation across independent indicators, then through repeated variance checks before sign-off. We compare model outputs with external signals such as manufacturing output trends, trade flows of industrial imaging equipment, and observed pricing movement, and any large mismatch is investigated until the driver is clearly explained.
Anomalies are flagged at regional and application levels, and the underlying assumptions are rechecked. A second analyst review follows to reduce avoidable errors. The report is refreshed annually, and interim updates are made when material events occur, such as sharp changes in industrial demand, supply constraints, or major interface transitions. Before delivery, a final pass is completed so clients receive the most current view available at that time.
Mordor Intelligence's Machine Vision Camera Market Size Measured Against Other Published Estimates
Published market values for machine vision cameras can look far apart because firms do not always count the same product boundary, they choose different base years, and they may treat industrial versus non-industrial cameras differently. Differences also show up when pricing is modeled using broad averages instead of camera class level price bands.
Import and export trends for industrial imaging equipment, plus checks on interface-level adoption in factories, are used as reality tests that keep Mordor Intelligence tied to camera hardware used for industrial machine vision, which leads to a larger 2025 total than estimates that start from narrower camera categories or older bases. In other cases, the spread comes from including adjacent imaging categories or using longer forecast horizons that assume faster price and adoption uplift without recontacting the market as frequently.
Benchmark comparison
| Source | Market Size | Gaps in Research Methodology |
|---|---|---|
| Mordor Intelligence | USD 16.17 B (2025) | |
| Industry Publisher A | USD 4.17 B (2024) | Uses an earlier base year and a narrower counted set that appears closer to specific camera subsets and technology groupings, which can undercount broader industrial machine vision camera hardware demand in high-volume manufacturing. |
| Industry Publisher B | USD 4.55 B (2026) | Starts from a smaller 2026 base and applies a long-horizon forecast to 2036, and its scope notes emphasize industrial cameras but can differ in what camera classes and adjacent imaging hardware are included in the revenue boundary. |
Across the three figures, the biggest driver of the gap is the counted scope and the timing of the base year, followed by how camera pricing and adoption are carried forward. By keeping the inputs anchored to visible manufacturing and trade signals, and then checking the implied volumes and prices with practitioners, our estimate stays traceable to clear steps that can be repeated when the market shifts.


Key Questions Answered in the Report
How large is the machine vision camera market in 2026?
The machine vision camera market size is USD 17.52 billion in 2026 and is projected to grow at an 8.33% CAGR to 2031.
Which camera type is expanding fastest?
Line scan units post the quickest gains, registering a 9.27% CAGR because they serve continuous-process industries such as steel and paper.
What region shows the highest growth pace?
Asia Pacific records the fastest expansion at a 8.93% CAGR due to strong semiconductor and EV battery investments supported by government incentives.
Which interface standard leads shipments?
USB3 Vision holds 41.08% share in 2025 thanks to its plug-and-play architecture and wide component availability.
What restrains broader adoption of machine vision?
A global shortage of skilled machine-vision engineers, particularly in North America and Europe, slows some projects and raises integration costs.
Page last updated on:





