
Uncooled Infrared Imaging Market Size and Share
Market Overview
| Study Period | 2020 - 2031 |
|---|---|
| Market Size (2026) | USD 5.14 Billion |
| Market Size (2031) | USD 7.63 Billion |
| Growth Rate (2026 - 2031) | 8.21 % |
| Fastest Growing Market | Asia Pacific |
| Largest Market | Asia Pacific |
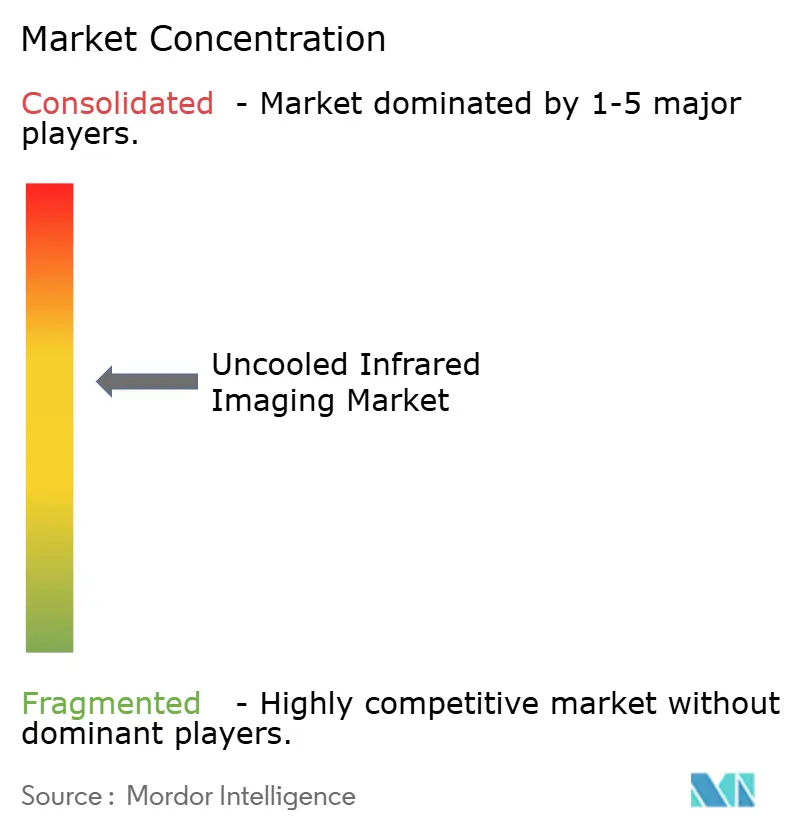
| Market Concentration | Medium |
Major Players *Disclaimer: Major Players sorted in no particular order Image © Mordor Intelligence. Reuse requires attribution under CC BY 4.0. | |
Uncooled Infrared Imaging Market Analysis by Mordor Intelligence
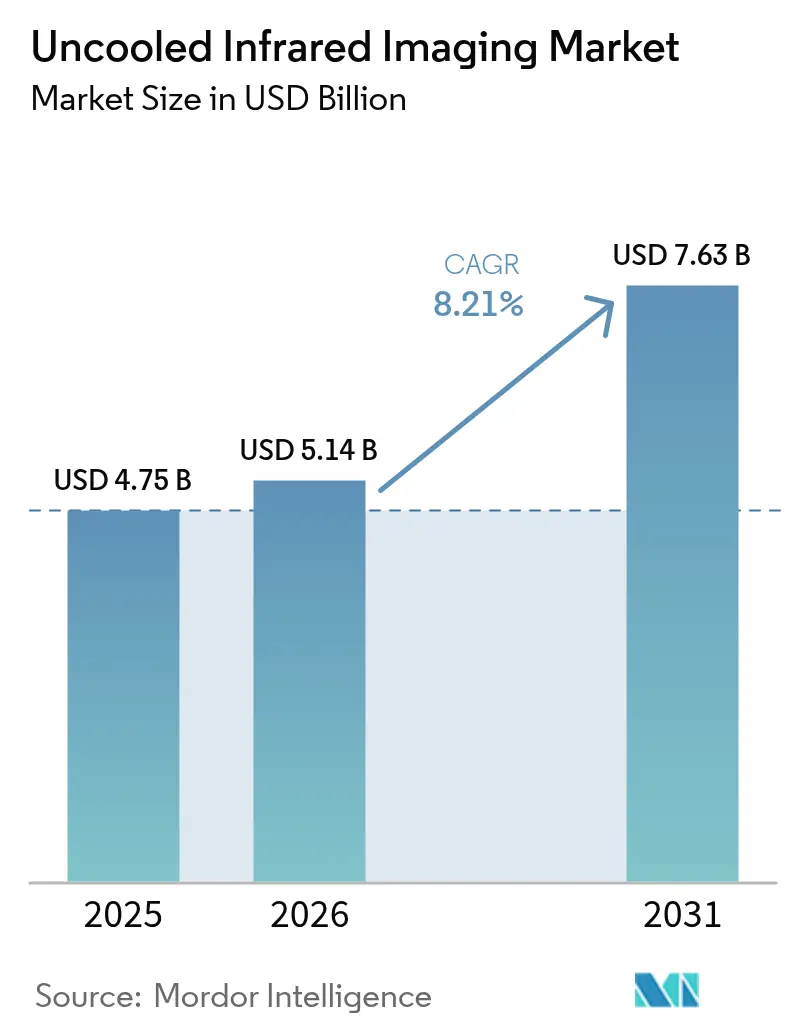
The uncooled infrared imaging market size is expected to grow from USD 4.75 billion in 2025 to USD 5.14 billion in 2026 and is forecast to reach USD 7.63 billion by 2031 at 8.21% CAGR over 2026-2031. Wafer-level packaging has driven pixel pitch below 12 µm, allowing uncooled cameras to approach visible-sensor pricing in automotive, security, and industrial inspection. Regulatory momentums pecially proposed U.S. rules that require night-time pedestrian detection places thermal imaging on the critical-path sensor list for next-generation advanced driver-assistance systems. Defense modernization and infrastructure hardening continue to fund high-margin orders, while smartphone integrations underscore the march toward consumer ubiquity. Price erosion remains a double-edged sword: it widens addressable demand yet pressures gross margins, forcing suppliers to invest in edge-analytics firmware and CMOS-compatible fabrication to differentiate.
Key Report Takeaways
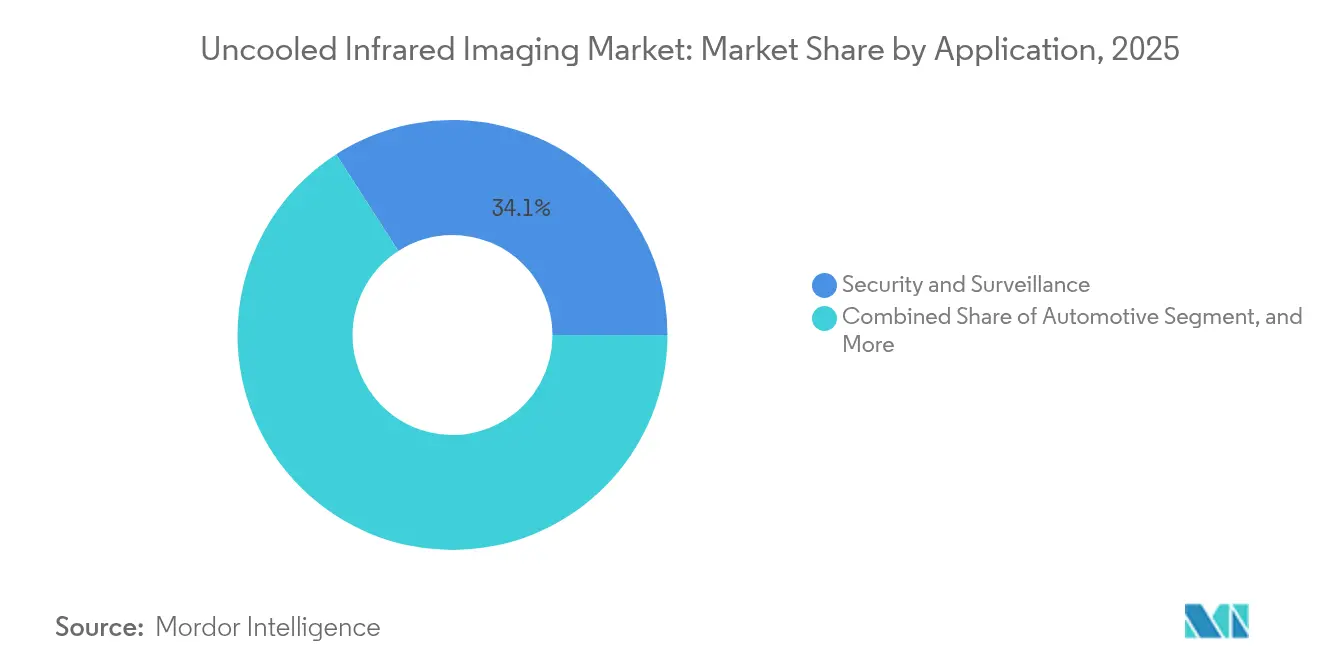
- By application, security and surveillance led with 34.10% revenue share in 2025, whereas automotive is forecast to expand at a 10.05% CAGR through 2031.
- By detector technology, vanadium-oxide microbolometers captured 48.60% share in 2025, while amorphous silicon is set to rise at a 9.62% CAGR through 2031.
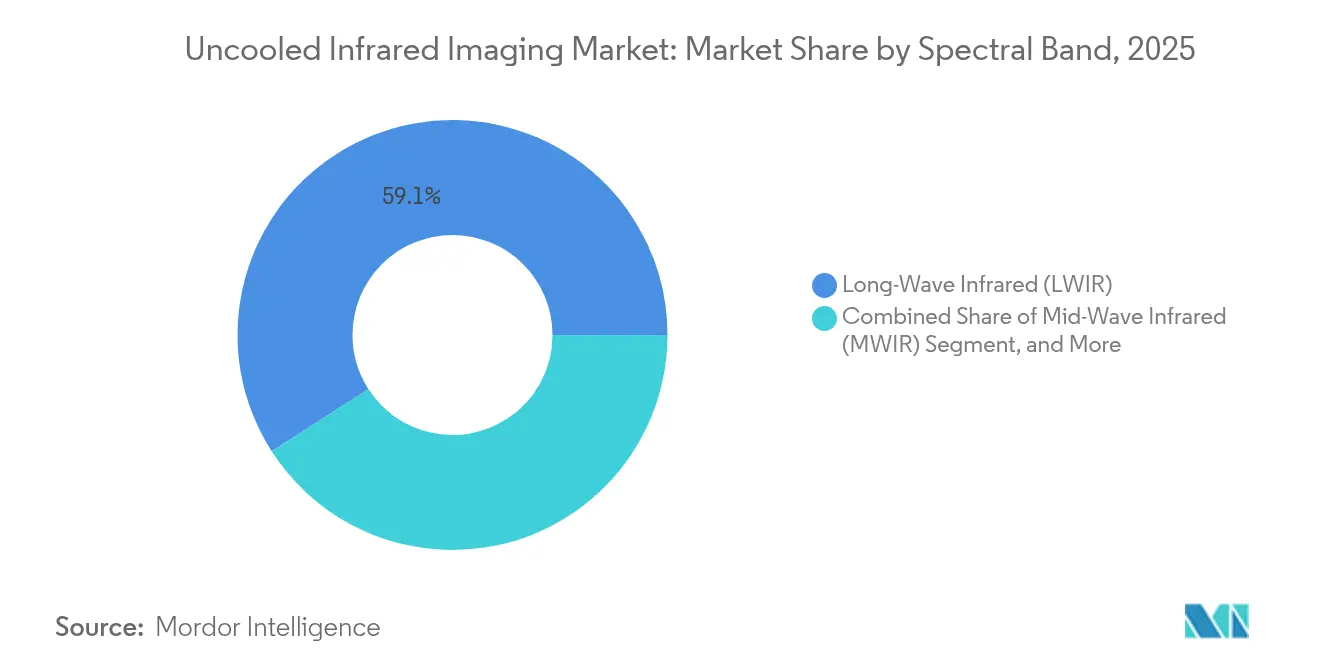
- By spectral band, long-wave infrared accounted for 59.10% of 2025 revenue and is expected to grow at a 9.51% CAGR through 2031.
- By product type, handheld cameras held 44.10% share in 2025, yet smartphone modules are projected to post a 10.18% CAGR through 2031.
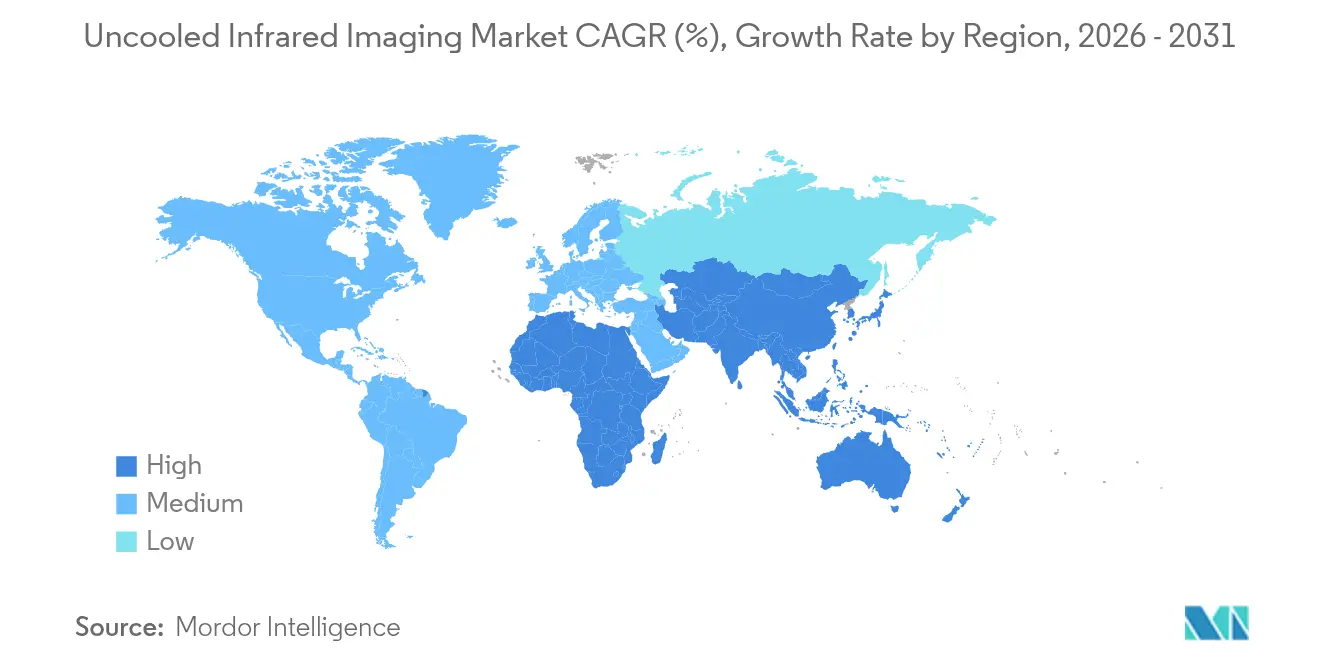
- By geography, Asia-Pacific commanded 41.10% revenue share in 2025 and is forecast to register an 11.29% CAGR through 2031.
Note: Market size and forecast figures in this report are generated using Mordor Intelligence’s proprietary estimation framework, updated with the latest available data and insights as of 2026.
Market Trends and Insights
Drivers Impact Analysis of Uncooled Infrared Imaging Market*
| Driver | (~) % Impact on CAGR Forecast | Geographic Relevance | Impact Timeline |
|---|---|---|---|
| Rising Adoption in Automotive ADAS and Night Vision Systems | +1.8% | Global, with early concentration in North America, Europe, and China | Medium term (2-4 years) |
| Growing Demand for Industrial Predictive Maintenance and Inspection | +1.2% | Global, strongest in North America, Europe, and Asia-Pacific manufacturing hubs | Medium term (2-4 years) |
| Increasing Defense and Security Expenditure on Thermal Imaging | +1.5% | Global, led by United States, NATO members, India, and Middle East | Long term (≥ 4 years) |
| Decreasing Cost of Microbolometer Sensors | +2.0% | Global, with manufacturing scale benefits in Asia-Pacific | Short term (≤ 2 years) |
| Emergence of Smartphone Integrated Thermal Cameras | +0.8% | Global, early adoption in North America and Europe prosumer segments | Medium term (2-4 years) |
| Wafer-Level Packaging Advancements Reducing Pixel Pitch Below 10 µm | +0.5% | Global, R&D concentrated in France, United States, and China | Long term (≥ 4 years) |
| Source: Mordor Intelligence | |||
Rising Adoption in Automotive ADAS and Night Vision Systems
Pending National Highway Traffic Safety Administration rules that mandate automatic emergency braking capable of night-time pedestrian detection are propelling thermal cameras from luxury options to mainstream safety equipment.[1]Debbie Sniderman, “Valeo and Teledyne FLIR Announce Agreement and First Contract for Thermal Imaging for Automotive Safety Systems,” ASM International, asminternational.org Valeo and Teledyne FLIR secured the first Automotive Safety Integrity Level B contract in 2024, validating production readiness for high-volume models. Radar struggles to classify living objects in clutter, lidar performance degrades in rain, and visible sensors fail in low light; thermal imaging closes these gaps at ranges beyond 100 m. Analysts now forecast annual microbolometer volumes exceeding 16 million units by 2030 versus fewer than 2 million in 2024, a scale shift that drives the uncooled infrared imaging market toward single-digit dollar die costs. Magna has already deployed more than 1.2 million thermal systems across its driver-assistance suite, signaling growing OEM confidence.
Growing Demand for Industrial Predictive Maintenance and Inspection
Unplanned downtime in semiconductor fabs, chemical plants, and power stations costs upwards of USD 50,000 per hour, sharpening the business case for real-time thermal inspection. Uncooled handheld cameras priced below USD 5,000 let technicians scan hundreds of assets per shift, flagging hot spots weeks before failures emerge. Edge-inferencing modules embedded within the sensor conduct convolutional-network analysis on-device, removing latency and bandwidth barriers. Electric-vehicle battery lines rely on thermal arrays to catch cell-stacking defects before runaway events, protecting entire production batches. ISO 50001 energy-efficiency audits further stimulate purchases as building managers translate temperature maps into retrofit priorities that cut operating costs.
Increasing Defense and Security Expenditure on Thermal Imaging
The U.S. Army’s USD 168.3 million upgrade program for Stryker reconnaissance vehicles exemplifies defense migration from cooled to uncooled arrays, where size, weight, power, and cost trump extreme sensitivity.[2]Editors, “Teledyne FLIR Defense Awarded $168M IDIQ Contract,” Photonics Media, photonics.com NATO commitments to spend 2% of GDP underpin steady orders for soldier-portable sights, counter-drone sensors, and perimeter systems. India’s 60% domestic-content rule is diverting demand from European primes toward local joint ventures, while Gulf states deploy AI-enhanced, fixed-mount cameras along pipelines and borders. Uncooled solutions, at roughly one-fifth the lifecycle cost of cooled mid-wave systems, now dominate bulk procurement outside long-range sniper optics, broadening the uncooled infrared imaging market footprint across combat and surveillance roles.
Decreasing Cost of Microbolometer Sensors
CEA-LETI’s wafer-level techniques have shrunk pixel pitch to 12 µm, and Asian foundries run mixed-signal CMOS lines that produce visible and infrared dies side by side, cutting capex per wafer. Crossing the sub-USD 100 module threshold unlocks automotive tier-one volume, a milestone Lynred executives flagged as pivotal in 2024. Vertically integrated Chinese suppliers compress detector-to-camera lead times to eight weeks and underprice Western peers by up to 40% on perimeter systems, expanding the uncooled infrared imaging market into schools, warehouses, and smart-home devices. Rising yields now above 95% feed a virtuous cost loop, paving the way for occupancy sensors and livestock monitors that demand sub-USD 20 detector dies.
Restraints Impact Analysis of Uncooled Infrared Imaging Market*
| Restraint | (~) % Impact on CAGR Forecast | Geographic Relevance | Impact Timeline |
|---|---|---|---|
| Performance Limitations Compared to Cooled Infrared Detectors | -0.4% | Global, most acute in defense and scientific applications | Long term (≥ 4 years) |
| Export Control Regulations on Infrared Components | -0.6% | Global, enforced by United States (ITAR), European Union (dual-use), and Wassenaar Arrangement signatories | Medium term (2-4 years) |
| Price Sensitivity in Mass-Market Consumer Applications | -0.3% | Global, strongest in price-sensitive Asia-Pacific and Latin America markets | Short term (≤ 2 years) |
| Germanium Supply Constraints Impacting Infrared Optics | -0.2% | Global, supply concentrated in China, Belgium, and United States | Medium term (2-4 years) |
| Source: Mordor Intelligence | |||
Performance Limitations Compared to Cooled Infrared Detectors
Noise-equivalent temperature differences of 50–100 mK limit long-range surveillance, precision munitions, and research spectroscopy, domains that still specify cooled mid-wave arrays capable of sub-20 mK performance. Uncooled frame-rates top out near 60 Hz due to thermal time constants, well below the kilohertz speeds needed for ballistic imaging. Military sniper systems and turbine diagnostics therefore keep cooled technology on contract, capping the ceiling for uncooled penetration despite its cost and power benefits.
Export Control Regulations on Infrared Components
International Traffic in Arms Regulations treat microbolometers above 640 × 480 as defense articles, forcing suppliers to maintain dual product lines and navigate protracted licensing cycles. The Wassenaar Arrangement mirrors these thresholds, while China’s 2024 germanium export license requirement pressures Western lens makers that source 60% of refined supply from Chinese smelters. Compliance overhead and asymmetric access fragment global supply chains, slowing the pace at which the uncooled infrared imaging market can scale high-definition modules for civilian customers.
*Our forecasts treat driver/restraint impacts as directional, not additive. The impact forecasts reflect baseline growth, mix effects, and variable interactions.
Uncooled Infrared Imaging Market Segment Analysis
By Application:
Automotive Surges as Regulatory Tailwinds AccelerateSecurity and surveillance retained 34.10% of 2025 revenue, fueled by perimeter systems that cut false alarms from shadows and headlights. In contrast, automotive applications, though smaller, are forecast to grow at 10.05% through 2031, the fastest among all end-uses, driven by proposed U.S. braking rules that require nighttime detection of pedestrians, cyclists, and large animals. This regulation anchors the uncooled infrared imaging market size opportunity within mass-production vehicle platforms, moving beyond premium marques.
Industrial maintenance gains from thermal scans of switchgear and rotating machinery, while consumer electronics expand via sub-USD 200 smartphone cores that blur professional and prosumer boundaries. Mapping and surveying segments attach uncooled cameras to drones for crop health and power-line inspection, yet remain niche. Healthcare fever-screening demand has normalized post-pandemic, leaving a stable base in hospitals and transit hubs.



By Detector Technology:
Amorphous Silicon Rides CMOS CompatibilityVanadium-oxide designs captured 48.60% revenue in 2025, a legacy of defense funding that honed sensitivity, but amorphous silicon is climbing at 9.62% CAGR as fabs leverage standard CMOS tooling. Amorphous silicon’s process affinity slashes per-die costs and simplifies monolithic integration with read-out circuits, critical for automotive economies of scale. The uncooled infrared imaging market share for vanadium-oxide may erode as car volumes dwarf defense demand, tilting capital investment toward silicon lines.
Thermopile and pyroelectric arrays hold low single-digit slices for motion sensing, where resolution is secondary. Emerging quantum-dot prototypes promise short-wave coverage at ambient temperature, yet manufacturability hurdles keep them in labs. Lynred’s October 2024 purchase of New Imaging Technologies highlights supplier moves to hedge with short-wave assets as long-wave niches mature
By Spectral Band:
Long-Wave Infrared Remains the MainstayLong-wave sensors accounted for 59.10% of 2025 revenue and will advance at a 9.51% CAGR through 2031, mirroring the overall uncooled infrared imaging market trajectory. Objects near room temperature emit peak energy in the 8–14 µm band, enabling passive detection without cryogenic cooling. Mid-wave arrays, while more sensitive, need active cooling and thus serve sniper sights and scientific labs willing to pay for millikelvin resolution.
Short-wave arrays, historically cooled InGaAs, may open fresh ground if quantum-dot devices mature, but volume remains limited. Far-infrared plays a marginal role due to atmospheric absorption beyond 14 µm. Regulatory frameworks such as the EU Energy Performance of Buildings Directive entrench long-wave devices as default tools for mandated thermal audits, sustaining volume and reinforcing the uncooled infrared imaging market size dominance within this band.
By Product Type:
Smartphone Modules Challenge Handheld CamerasHandheld cameras retained 44.10% revenue share in 2025 thanks to ruggedized designs for electricians, firefighters, and law enforcement. Yet smartphone modules are slated for a 10.18% CAGR, the fastest among product types, as sub-USD 200 cores are embedded in mid-tier phones, turning every contractor’s handset into a thermal scanner. This shift broadens the uncooled infrared imaging market beyond industrial budgets and into consumer channels.
Fixed-mount units support traffic and perimeter analytics, while pan-tilt-zoom platforms guard borders and critical infrastructure at premium pricing. Vehicle-mounted sensors sit at the intersection of automotive ADAS and military turrets; volumes will spike once regulatory clarity arrives, but present shipments trail handheld and fixed-mount categories.
Geography Analysis
APAC Uncooled Infrared Imaging Market
Asia-Pacific generated 41.10% of 2025 revenue and is projected to post an 11.29% CAGR to 2031, well above the uncooled infrared imaging market average, as Chinese vendors integrate detector growth, wafer processing, and camera assembly under one roof . Vertical integration trims lead times to eight weeks and undercuts Western quotes by up to 40%, winning perimeter and industrial bids across Southeast Asia. India’s 60% local-content clause reroutes defense orders to joint ventures, catalyzing domestic fab investment and broadening supply resilience.
North America and Europe Uncooled Infrared Imaging Market
North America contributed roughly 29.80% of 2025 revenue. Defense programs such as Stryker NBCRV upgrades, soldier-borne sights, and counter-drone payloads continue to anchor demand, while automotive pilots ramp ahead of night-vision brake mandates. Growth, however, lags Asia as commercial uptake waits for the final regulatory text. Europe secured about 15.20% revenue, buoyed by NATO’s 2% GDP defense pledge and EU building-audit mandates. Fragmented procurement and strict export controls temper growth despite world-class R&D.
MEA and South America Uncooled Infrared Imaging Market
The Middle East and Africa combined for around 8.10% of 2025 revenue, led by Gulf infrastructure projects that deploy AI-enabled thermal cameras along pipelines and airports. Political risk and currency volatility dampen multi-year forecasts, yet critical-infrastructure protection sustains baseline spending. South America’s 5.80% share stems from mining, utility, and wildfire-monitoring use cases in Brazil and Chile; import tariffs and limited incentives restrain broader adoption, yet regional energy-transition projects may unlock incremental demand.

Regulatory Landscape
Export controls and compliance requirements continue to shape market access for higher-performance uncooled infrared cameras and modules. In the United States, Export Administration Regulations (EAR) cover thermal imaging cameras under categories such as ECCN 6A003, and licensing is destination-based, with reporting requirements under 15 CFR 743.3 for certain thermal imaging camera exports. For OEM and module suppliers shipping globally, these obligations can add lead time and administrative cost, and enforcement activity remains a parallel constraint. A February 2026 Bureau of Industry and Security (BIS) final order involving Teledyne FLIR, tied to historic export-control compliance issues that pre-dated the 2021 acquisition, highlights the need for screening, classification, and recordkeeping across acquired product lines and legacy SKUs.
In Europe, export controls for dual-use items are governed by Regulation (EU) 2021/821, with compliance also intersecting with national restrictions for specific end uses such as weapon-mounted night vision. On product compliance, the EU RoHS Directive 2011/65/EU continues to influence material choices for sensors, electronics, and optics. The European Commission circulated a draft amendment in July 2026 addressing exemptions related to lead and cadmium in optical materials, which can feed into IR optics supply decisions and qualification timelines. Customs and trade classification decisions, including US Customs and Border Protection rulings for imported IR components, also affect duty treatment and can influence procurement strategies for lenses, modules, and finished cameras.
Value Chain Analysis
The value chain begins with upstream materials and components, including infrared optics inputs (such as germanium and alternative chalcogenide glasses), microbolometer wafers, ROICs, and packaging consumables. Midstream manufacturing covers detector fabrication (vanadium-oxide or amorphous silicon microbolometers), wafer-level packaging and test, lens fabrication and coating, and then module and camera assembly with calibration software and embedded processing. Downstream channels include defense primes and integrators (vehicle and soldier systems), industrial tool brands and distributors for handheld inspection, security and surveillance OEMs for fixed and PTZ platforms, and consumer-electronics pathways for smartphone cores and accessories.
Key bottlenecks and cost levers sit in optics sourcing and high-volume manufacturability. Germanium export controls introduced in 2023 contributed to sharp ingot price movements over the following year, which encouraged more designs toward chalcogenide-glass optics. These optics choices require tighter process control during molding or diamond turning and can shift yield-management responsibilities into the integrator layer. Scale also increasingly depends on vertically integrated setups, especially in Asia-Pacific, where detector-to-camera integration compresses lead times and supports more aggressive pricing. In parallel, programs such as US Army SBIR topics focused on uncooled thermal sensor component enhancement kept emphasis on standardized interfaces and test/verification readiness, which can shorten qualification cycles and reduce integration friction for defense and dual-use deployments.
Competitive Landscape
Moderate concentration defines the field: Teledyne FLIR, BAE Systems, L3Harris, Lynred, and four major Chinese manufacturers shipped about 62% of global units in 2024. Commoditization of wafer-level packages tightens margins, prompting differentiation through edge analytics firmware, AI-assisted object classification, and multispectral fusion. Lynred’s October 2024 acquisition of New Imaging Technologies secures short-wave silicon at 8 µm pixel pitch, allowing the firm to pitch single-supplier portfolios that span 1–14 µm bands as a hedge against long-wave price erosion.[3]Semiconductor Today Staff, “Lynred Acquires SWIR Imaging Provider New Imaging Technologies,” Semiconductor Today, semiconductor-today.com
Automotive is shaping the next battleground. Valeo and Teledyne FLIR obtained the first ASIL-B thermal camera award in late 2024, signaling OEM intent to treat thermal as a core ADAS modality, not an optional package. Chinese integrators leverage domestic germanium supply and relaxed export rules to bypass ITAR bottlenecks, winning cost-sensitive contracts across Asia, Africa, and Latin America. Start-ups targeting colloidal quantum-dot arrays tout short-wave sensitivity without cooling, but must prove yield stability at 300 mm wafer scale.
Strategic moves increasingly revolve around ecosystem play. Module makers offer OPC UA-ready firmware for Industry 4.0 platforms, while drone vendors bundle thermal payloads with AI crop-analysis software to capture downstream service revenue. Patent portfolios remain active, yet cross-licensing spreads designs quickly, allowing tier-two players to crowd low-to-mid-resolution brackets of the uncooled infrared imaging market.
Uncooled Infrared Imaging Industry Leaders
Teledyne FLIR LLC
Xenics NV
Cantronic Systems Inc.
BAE Systems plc
VIGO System S.A.
- *Disclaimer: Major Players sorted in no particular order
Uncooled Infrared Imaging Market Companies Covered in this Report
- Teledyne FLIR LLC
- Xenics NV
- Cantronic Systems Inc.
- BAE Systems plc
- Teledyne DALSA Inc.
- Zhejiang ULIRVISION Technology Co., Ltd.
- VIGO System S.A.
- Axis Communications AB
- Lynred USA Inc.
- Seek Thermal Inc.
- Wuhan Guide Infrared Co., Ltd.
- Zhejiang Dali Technology Co., Ltd.
- Yantai IRay Technology Co., Ltd.
- Raytheon Technologies Corporation
- L3Harris Technologies, Inc.
- Leonardo DRS, Inc.
- Fluke Corporation
- Opgal Optronic Industries Ltd.
- Honeywell International Inc.
- Excelitas Technologies Corp.
- InfraTec GmbH Infrarotsensorik und Messtechnik
- Hamamatsu Photonics K.K.

Market Opportunities and Future Outlook
Near-term whitespace is concentrating around manufacturable, high-resolution, small-pixel uncooled modules that satisfy procurement-origin requirements while fitting automotive and drone SWaP constraints. The evidence for this shift shows up in a cluster of 2026 launches tied to pixel pitches and higher resolutions, including Lynred introducing the YOCTO family (starting with a 1024-format sensor) in January 2026, SCD announcing the Robin family of 12 micrometer VGA LWIR uncooled detectors in April 2026, and Teledyne FLIR OEM releasing the NDAA-compliant Boson SX8 8 micrometer SXGA LWIR module with embedded Prism software in June 2026. These launches suggest ongoing investment in pairing sensor performance with packaging and software layers that reduce integration time for tier-ones and system houses.
A second opportunity sits in packaging and assembly approaches that reduce the reliance on specialized cleanroom workflows, particularly for high-volume industrial monitoring, security nodes, and consumer-adjacent modules. Raytron has pointed to wafer-level packaging approaches for 8 micrometer detectors and surface-mount-technology compatible module concepts in 2025-2026 announcements, which aligns with the broader push toward wafer-level packaging and electronics-assembly compatibility. At the same time, regulatory and procurement constraints are influencing go-to-market, with NDAA-compliant variants and export-control-aware SKU strategies creating room for suppliers that can offer traceability, compliant sourcing, and dual product lines without slowing delivery. Applications that benefit from embedded analytics, including perimeter surveillance and industrial predictive maintenance, also support differentiation through firmware, on-device inference, and standardized interfaces that connect into Industry 4.0 platforms.
Recent Industry Developments in Uncooled Infrared Imaging Market
- July 2026: Teledyne FLIR Defense partnered with STORM at Eurosatory 2026 to integrate the Black Recon vehicle reconnaissance system with the Rapid Adapt and Deploy System (RADS). The integration focus supports modular fielding across more vehicle platforms and aligns uncooled imaging payloads with open-architecture deployment concepts used in defense procurement.
- November 2025: Exosens launched the Hyper-Cam Airborne Nano, an uncooled long-wave infrared hyperspectral imaging solution designed for UAV and airborne applications. The introduction extends uncooled sensing from conventional thermal imaging into hyperspectral workflows, enabling richer detection and identification use cases in remote inspection and surveillance payloads.
- October 2024: Lynred acquired New Imaging Technologies, adding short-wave imaging assets and expanding internal capacity to support broader wavelength portfolio offerings. The move strengthened Lynred's ability to offer multi-band solutions alongside its uncooled LWIR focus, supporting customers that want fewer supplier handoffs across imaging modalities.


Uncooled Infrared Imaging Market Report Scope and Research Methodology
Market Definition and Coverage
For this methodology, the uncooled infrared imaging market includes revenue from infrared imaging products that operate without cryogenic cooling, covering the detector and camera modules used to convert heat signatures into images for end users.
Scope exclusions: Cooled infrared imaging systems and cryogenic cooling hardware are excluded, as are purely analog optics and basic temperature sensors that do not produce an infrared image.
Segments Covered in This Report
- By Application
- Automotive
- Military and Defense
- Industrial and Manufacturing
- Security and Surveillance
- Consumer Electronics
- Mapping and Surveying
- Healthcare
- By Detector Technology
- Vanadium Oxide Microbolometers
- Amorphous Silicon Microbolometers
- Thermopile Arrays
- Pyroelectric Arrays
- Other Uncooled Detectors
- By Spectral Band
- Long-Wave Infrared (LWIR)
- Mid-Wave Infrared (MWIR)
- Short-Wave Infrared (SWIR)
- Far Infrared (FIR)
- By Product Type
- Handheld Cameras
- Fixed-Mount Cameras
- Pan-Tilt-Zoom Cameras
- Vehicle-Mounted Sensors
- Smartphone Modules
- By Geography
- North America
- United States
- Canada
- Mexico
- South America
- Brazil
- Argentina
- Chile
- Rest of South America
- Europe
- United Kingdom
- Germany
- France
- Italy
- Spain
- Rest of Europe
- Asia-Pacific
- China
- Japan
- India
- South Korea
- Australia and New Zealand
- Rest of Asia-Pacific
- Middle East and Africa
- Middle East
- United Arab Emirates
- Saudi Arabia
- Turkey
- Rest of Middle East
- Africa
- South Africa
- Kenya
- Nigeria
- Rest of Africa
- Middle East
- North America
Data Sources, Market Sizing, and Validation
Desk Research
Desk research was used to set the market boundaries and to anchor demand-side signals that could be checked independently. We relied on public sources such as U.S. Department of Defense budget documents, U.S. Department of Energy efficiency and building data, U.S. Bureau of Labor Statistics industrial activity series, U.S. International Trade Commission and UN Comtrade trade statistics, and published standards and testing references from bodies such as ISO and IEC.
On the supply side, we reviewed company annual reports, investor presentations, product catalogs, and earnings call transcripts to understand shipment mix, pricing ranges, and new product introductions. Patent databases were also used to track innovation direction across microbolometer materials and packaging, which helped sanity check adoption curves. A limited set of paid databases was used only for company financials and news verification, and then those inputs were cross-checked with publicly available disclosures. The desk sources listed above are illustrative, and additional public documents and references were used for data collection, validation, and clarification.
Primary Interviews and Surveys
Primary interviews and surveys focused on validating what gets purchased, by whom, and at what typical price points across major regions and end-use settings. We spoke with a mix of camera and module ecosystem participants, system integrators, distributors, and procurement or operations leaders in industrial inspection, security, automotive sensing, and defense-related programs, then reconciled differences across viewpoints.
Because adoption varies by geography, the fieldwork was balanced across APAC, EMEA, and the Americas, so the model could reflect different procurement cycles, regulation, and integration intensity.
Distribution of primary research fieldwork respondents
| Company type | Respondent position | Region |
|---|---|---|
| Top tier: 32% | CXOs: 20% | APAC: 47% |
| Mid tier: 47% | Functional/Unit leaders: 25% | EMEA: 34% |
| Smaller Players: 21% | Managers: 55% | Americas: 19% |
Market-Sizing & Forecasting
The sizing model starts with a top-down build where application-level demand pools are reconstructed using adoption rates and device intensity, and then converted into value using typical selling prices observed in the market. For uncooled infrared imaging, key inputs included installed base growth of security and industrial inspection cameras, automotive ADAS and cabin sensing fitment trends, defense and public safety procurement timing, the mix shift toward smaller modules (including smartphone attachments), and average selling price movement by performance class and form factor.
After that, selective bottom-up checks were used to keep totals realistic, including sampled supplier and channel roll-ups, unit volume estimates for common camera types, and ASP x unit sanity checks in a few high-volume use cases. When product or regional data was thin, gaps were handled using proxy indicators such as import trends for imaging devices, published program counts, and expert-confirmed mix splits that could be traced back to observable market behavior.
For forecasting, scenario analysis was used around a core path, since demand can shift quickly with defense budgets, automotive design wins, and building safety upgrades. The forward assumptions were pressure-tested in interviews, then applied consistently across regions and applications to avoid overstating short-term spikes.
Data Validation & Update Cycle
Model outputs were validated through multiple checkpoints so unusual jumps could be explained before finalization. We compared totals against independent signals such as procurement spending patterns, trade value trends, and the expected pace of module miniaturization and price erosion, then reviewed any variance that did not align with these indicators.
Before sign-off, the work was reviewed in steps, including internal cross-checks across related infrared and thermal imaging markets, plus follow-up outreach when assumptions conflicted across sources. The report is refreshed on an annual schedule, with interim updates when material events occur that can change demand or pricing. Right before delivery, a final pass is completed so clients receive the most current view supported by the latest available information.
Mordor Intelligence's Uncooled Infrared Imaging Market Size Compared With Other Published Estimates
Published market values for uncooled infrared imaging often differ because the included product set, the base year selected, and the way prices are normalized are not consistent across publishers. Differences also show up when some studies mix cooled and uncooled systems, or when they rely on a single end-use signal that does not translate cleanly across regions.
The benchmark table shows a spread in reported values, and in Mordor Intelligence's model the 2026 value is tied to uncooled-only imaging across defined applications and product types, rather than mixing in cooled infrared systems or adjacent sensing categories that do not produce an infrared image.
Benchmark comparison
| Source | Market Size | Gaps in Research Methodology |
|---|---|---|
| Mordor Intelligence | USD 5.14 B (2026) | |
| Industry Research Publisher A | USD 5.80 B (2024) | Uses an earlier base year and a broader bucketed definition, where adjacent thermal sensing and component revenue can be blended into the total, and the price progression logic is not clearly tied to form factor mix. |
| Market Tracking Publisher B | USD 4.10 B (2024) | Uses a narrower equipment-only framing and a different base-year presentation, which can undercount module-level demand and system integration value that is captured in many real purchase decisions. |
Taken together, the main reason for the gaps is not the math but the input boundaries, especially what is counted as imaging revenue and how the base year is set. By linking totals to observable adoption drivers, practical ASP ranges, and cross-checked mix assumptions, the estimate stays traceable to clear steps that can be repeated and reviewed as new information comes in.


Key Questions Answered in the Report
How large is the uncooled infrared imaging market in 2026?
The uncooled infrared imaging market size is USD 5.14 billion in 2026.
What is the expected growth rate for uncooled infrared imaging through 2031?
The market is projected to register an 8.21% CAGR, reaching USD 7.63 billion by 2031.
Which application is growing fastest?
Automotive, supported by impending U.S. night-vision braking mandates, is forecast at a 10.05% CAGR to 2031.
Why are long-wave infrared sensors dominant?
They operate at room temperature within the 8–14 µm atmospheric window, removing the need for cooling and lowering system cost.
Which region leads in revenue and growth?
Asia-Pacific leads with 41.10% 2025 revenue and an 11.29% forecast CAGR as vertically integrated Chinese suppliers scale production.
How concentrated is supplier power?
The top five vendors hold about 62% of unit shipments, indicating moderate concentration with increasing competition from new entrants.
Page last updated on:





