Blockchain IoT Market Size and Share
Market Overview
| Study Period | 2020 - 2031 |
|---|---|
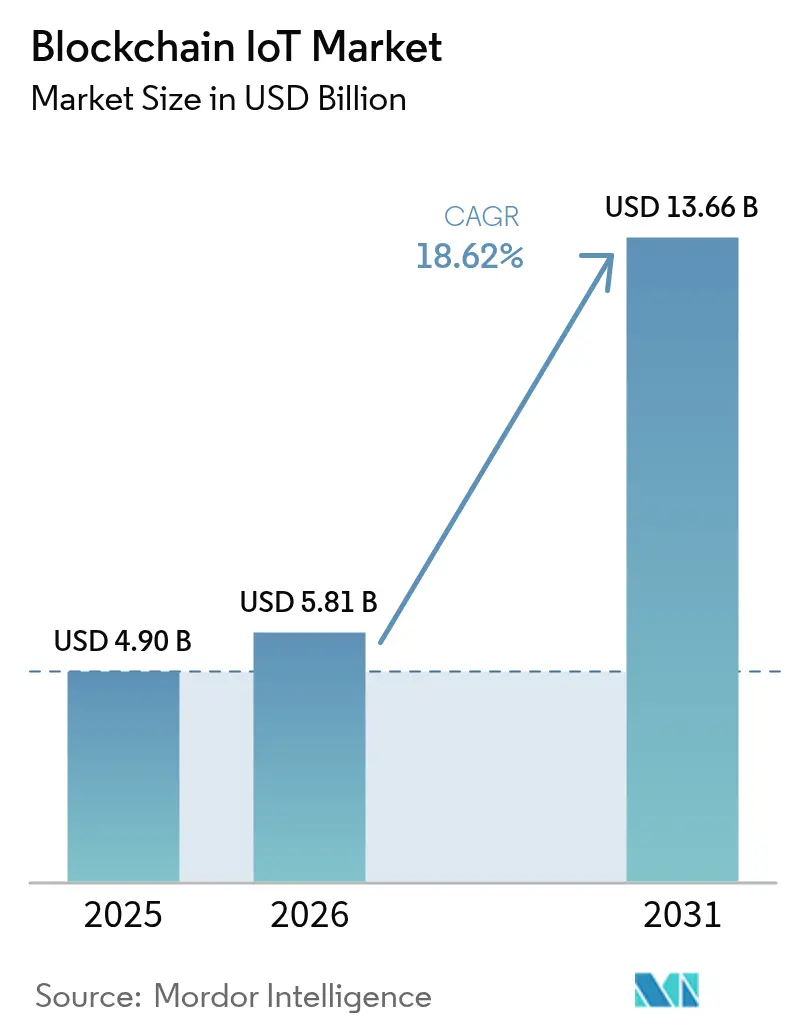
| Market Size (2026) | USD 5.81 Billion |
| Market Size (2031) | USD 13.66 Billion |
| Growth Rate (2026 - 2031) | 18.62% CAGR |
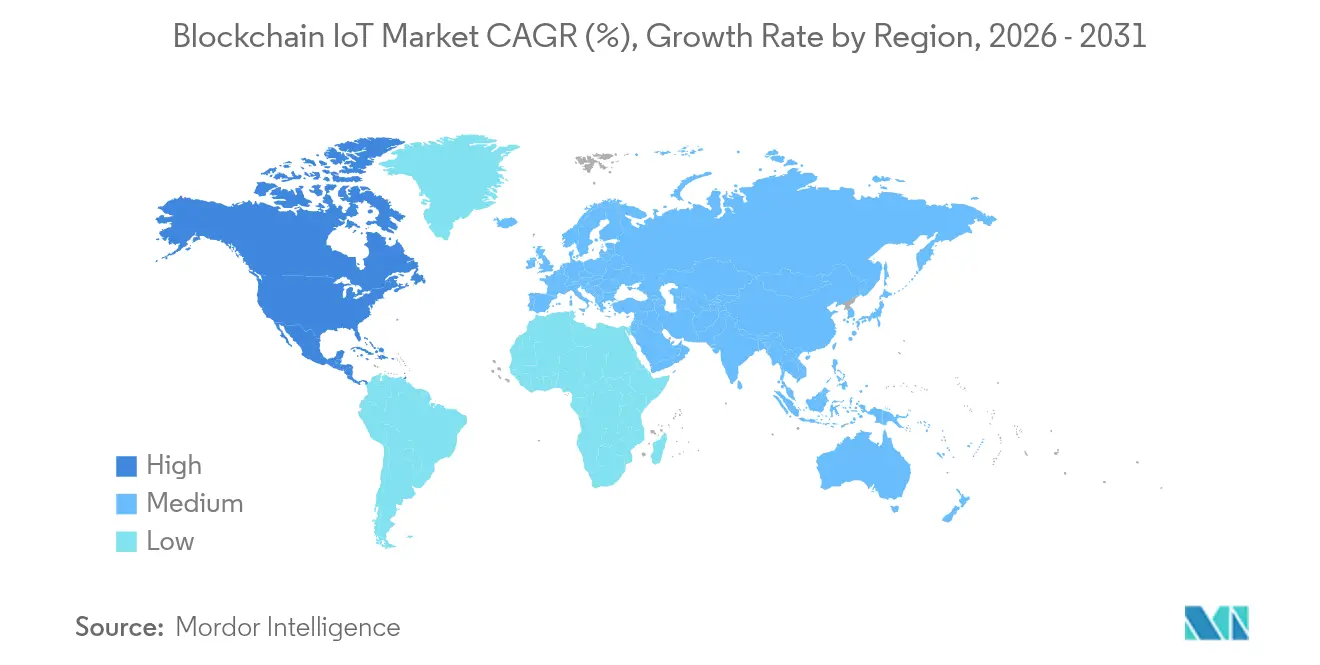
| Fastest Growing Market | Asia Pacific |
| Largest Market | North America |
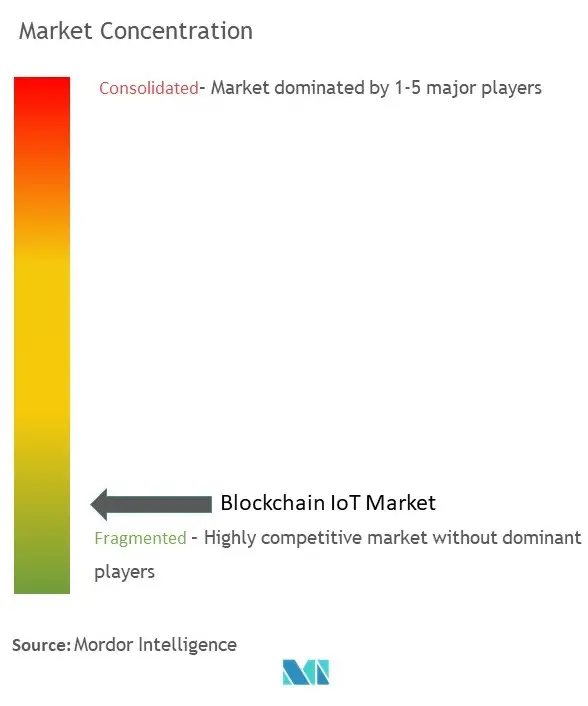
| Market Concentration | Low |
Major Players *Disclaimer: Major Players sorted in no particular order Image © Mordor Intelligence. Reuse requires attribution under CC BY 4.0. | |
Blockchain IoT Market Analysis by Mordor Intelligence
The Blockchain IoT Market size was valued at USD 4.90 billion in 2025 and estimated to grow from USD 5.81 billion in 2026 to reach USD 13.66 billion by 2031, at a CAGR of 18.62% during the forecast period (2026-2031).
Escalating cyber-attacks on connected devices, tightening supply-chain transparency mandates, and enterprise demand for tamper-proof data flows reinforce rapid adoption. Layer-2 roll-ups and edge-native consensus engines lower latency limits that once restrained industrial use, while Decentralized Physical Infrastructure Networks (DePIN) create token-driven business models that monetise idle sensor capacity. Hardware spending leads short-term growth as organisations embed secure elements, yet infrastructure services generate the strongest mid-term upside as firms shift from monolithic to modular blockchain stacks. Regulatory clarity in North America and the European Union accelerates deployments, but energy and compute constraints on low-cost devices remain a drag.
Key Report Takeaways
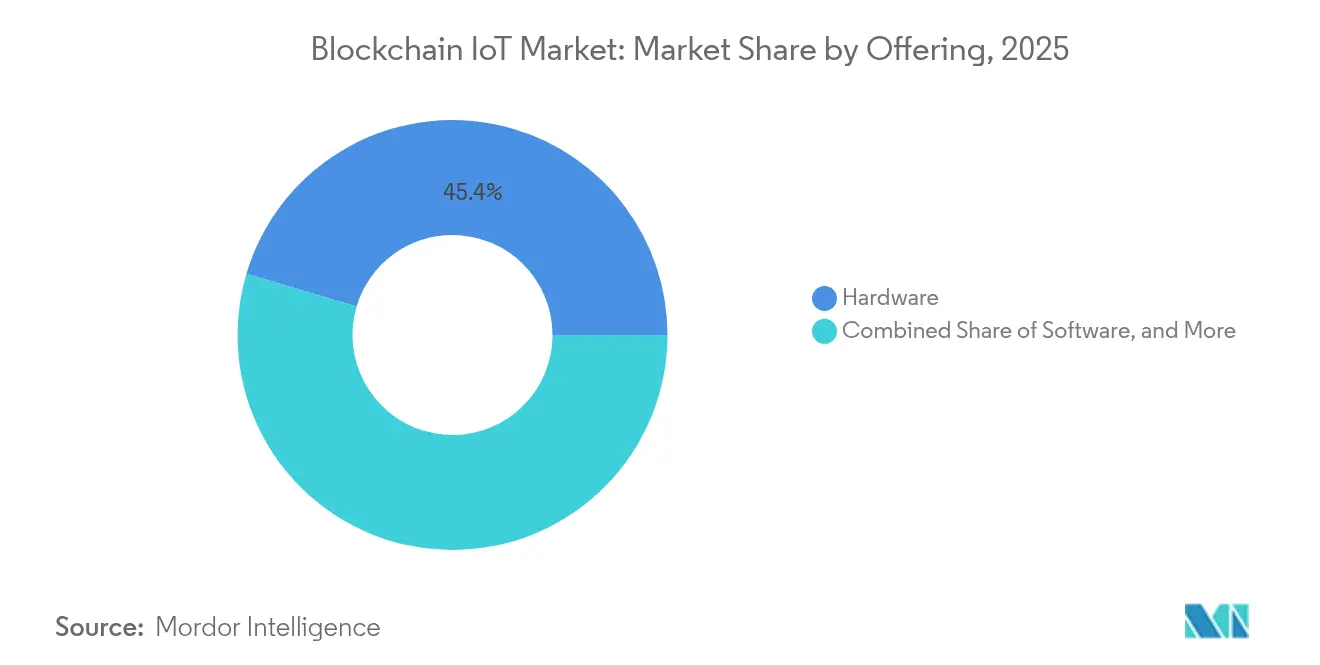
- By offering, hardware captured 45.40% revenue share of the blockchain IoT market in 2025; infrastructure solutions are projected to grow at a 20.90% CAGR through 2031.
- By application, asset tracking held 30.85% of the blockchain IoT market share in 2025, while smart contracts and automation are expected to advance at a 23.10% CAGR to 2031.
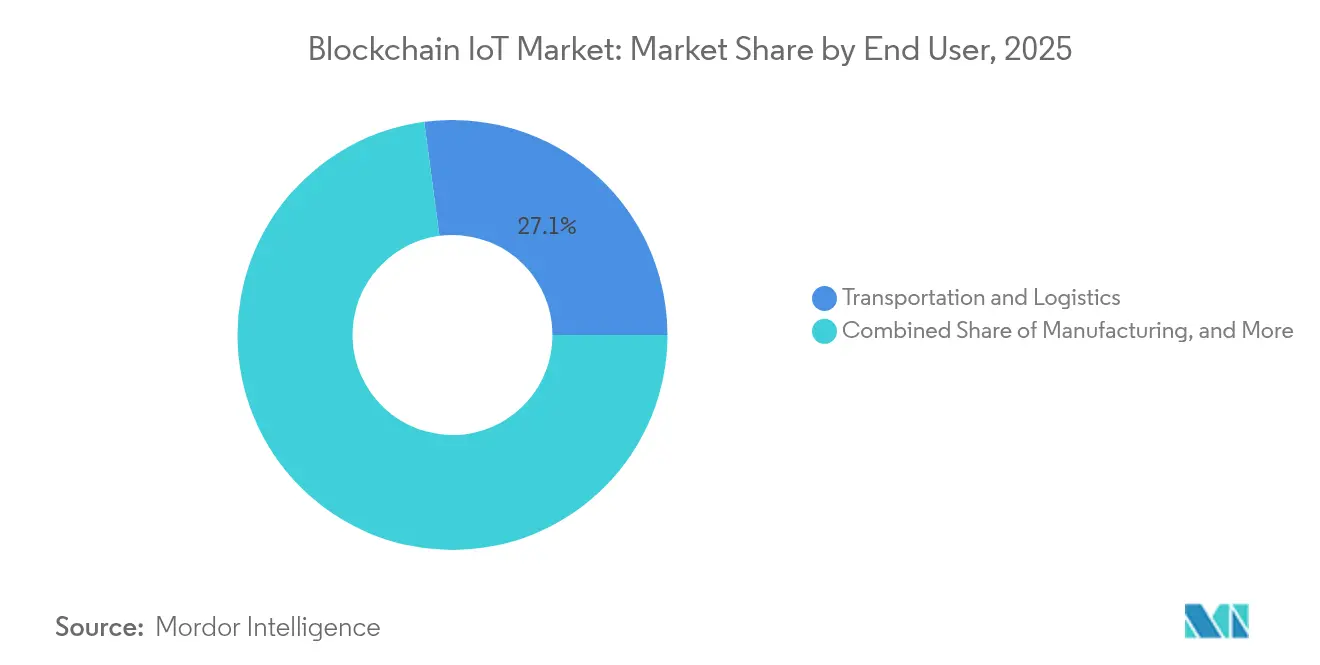
- By end user, transportation and logistics led with a 27.10% share in 2025; smart cities and government are forecast to expand at a 21.90% CAGR through 2031.
- By application, asset tracking held 30.85% of the blockchain IoT market share in 2025, while smart contracts and automationDriver (~) % Impact on CAGR Forecast Geographic Relevance Impact Timeline
- Surge in IoT-centric cyber-attacks elevating demand for tamper-proof ledgers +4.20% Global, acute in North America & the EU Short term (≤ 2 years)
- Acceleration of supply-chain transparency mandates (ESG, eIDAS 2.0, US FSLMDA) +3.80% North America & EU primary, APAC emerging Medium term (2–4 years)
- Edge-computing investments coupled with Layer-2 roll-ups for low-latency consensus +3.10% APAC core, spill-over to North America Medium term (2–4 years)
- Standardization of device identities via DID / Verifiable Credentials frameworks +2.90% Global, led by the IEEE consortium Long term (≥ 4 years)
- Emergence of DePIN token-incentivized sensor networks +2.60% US, EU early, scaling fastest in APAC smart-city clusters Medium term (2–4 years)
- Digital-twin monetization through on-chain provenance tokens +2.40% Global industrial manufacturing ecosystems Long term (≥ 4 years)
- advance at a 23.10% CAGR to 2031.
Note: Market size and forecast figures in this report are generated using Mordor Intelligence’s proprietary estimation framework, updated with the latest available data and insights as of 2026.
Global Blockchain IoT Market Trends and Insights
Drivers Impact Analysis*
| Driver | (~) % Impact on CAGR Forecast | Geographic Relevance | Impact Timeline |
|---|---|---|---|
| Surge in IoT-centric cyber-attacks elevating demand for tamper-proof ledgers | +4.20% | Global, acute in North America & the EU | Short term (≤ 2 years) |
| Acceleration of supply-chain transparency mandates (ESG, eIDAS 2.0, US FSLMDA) | +3.80% | North America & EU primary, APAC emerging | Medium term (2–4 years) |
| Edge-computing investments coupled with Layer-2 roll-ups for low-latency consensus | +3.10% | APAC core, spill-over to North America | Medium term (2–4 years) |
| Standardization of device identities via DID / Verifiable Credentials frameworks | +2.90% | Global, led by the IEEE consortium | Long term (≥ 4 years) |
| Emergence of DePIN token-incentivized sensor networks | +2.60% | US, EU early, scaling fastest in APAC smart-city clusters | Medium term (2–4 years) |
| Digital-twin monetization through on-chain provenance tokens | +2.40% | Global industrial manufacturing ecosystems | Long term (≥ 4 years) |
| Source: Mordor Intelligence | |||
Surge in IoT-centric cyber-attacks elevating demand for tamper-proof ledgers
Exploding malware volumes force enterprises to embed security at the protocol level. A lightweight blockchain consensus achieved 95.2% malicious-device detection with 15% higher throughput and 20% lower latency than centralised models. Chief information security officers increasingly regard distributed ledgers as mandatory for zero-trust architectures.
Acceleration of supply-chain transparency mandates
Regulations such as the US Federal Supply Chain Localisation and Manufacturing Development Act and EU eIDAS 2.0 oblige verifiable provenance. California’s DMV moved 42 million car titles on-chain, proving large-scale public deployment viability.
Edge-computing investments with Layer-2 roll-ups
Delegated proof-of-stake chains processed over 4,000 tps on industrial edge nodes without sacrificing cryptographic integrity.[2]Research Team, “High-Throughput Edge Blockchains,” Nature, nature.comSharding across micro-data-centres positions the blockchain IoT market for real-time robotics and predictive-maintenance workloads.
Standardisation of device identities via DID / VCs
An IEEE working group involving Bosch, Ericsson and Lenovo is finalising a Decentralised Identifier framework for cross-chain IoT authentication.[1]Standards Committee, “Decentralized Identifier Framework for IoT,” IEEE, ieee.orgInteroperable credentials dismantle proprietary silos, boosting ecosystem liquidity and developer uptake.
Restraints Impact Analysis*
| Restraint | (~) % Impact on CAGR Forecast | Geographic Relevance | Impact Timeline |
|---|---|---|---|
| Limited on-device computing power for cryptographic workloads | -2.80% | Global, acute in cost-sensitive IoT deployments | Short term (≤ 2 years) |
| Rising energy cost for Proof-of-Work / Proof-of-History edge nodes | -2.10% | Energy-intensive regions, industrial applications | Medium term (2–4 years) |
| Fragmented interoperability across blockchain protocols and IoT standards | -1.90% | Global, multi-protocol brownfield legacy estates | Medium term (2–4 years) |
| Regulatory ambiguity surrounding tokenized machine data ownership | -1.60% | US/EU highest legal exposure | Medium → Long term (3–5+ years) |
| Source: Mordor Intelligence | |||
Limited on-device computing power for cryptographic workloads
Proof-of-Work tests on micro-controllers showed untenable energy draw, pushing vendors toward offloaded or hardware-accelerated hashing. FPGA SHA-256 cores cut dynamic power nearly 1,000-fold versus software. Cost barriers split the market between premium blockchain-capable devices and lightweight authenticators.
Rising energy cost for consensus edge nodes
Projected AI electricity demand of 23 GW by 2025 competes directly with distributed ledger workloads.[3]J. G. Miller, “AI Electricity Demand Forecast,” Foreign Affairs, foreignaffairs.com Industrial operators are pivoting to Proof-of-Stake schemes that lower energy use by 99%, despite reduced decentralization guarantees.
*Our forecasts treat driver/restraint impacts as directional, not additive. The impact forecasts reflect baseline growth, mix effects, and variable interactions.
Segment Analysis
By Offering: Hardware Dominance Drives Infrastructure Innovation
Hardware held 45.40% share of the blockchain IoT market in 2025, anchored by secure elements and cryptographic co-processors that safeguard device keys. The segment safeguards the blockchain IoT market size against firmware tampering across industrial robots and connected vehicles. Infrastructure, spanning Layer-2 roll-ups and edge validators, is projected to expand at 20.90% CAGR as enterprises migrate from pilot clouds to production-grade networks. Software platforms complete the stack by masking ledger complexity through API gateways.
The infrastructure boom reflects the maturity of blockchain-as-a-service portfolios from hyperscalers that bundle orchestration, compliance, and monitoring. Public chains struggle to match deterministic latency thresholds, so private or consortium-ledgers dominate mission-critical workloads. Hybrid architectures fuse on-prem edge clusters with public settlement layers, trading full decentralisation for deterministic performance. Token-incentivised gateways reward operators for bandwidth and compute contributions, nurturing a self-financing backbone that underpins future growth of the blockchain IoT market.


By Application: Asset Tracking Leads, Smart Contracts Accelerate
Asset tracking commanded 30.85% of the blockchain IoT market share in 2025 through mandated provenance across pharma, aerospace, and luxury goods. Verified location and temperature logs underpin recall avoidance and counterfeit mitigation. Smart contracts and automation should record a 23.10% CAGR to 2031, enlarging the blockchain IoT market size as firms convert static ledgers into autonomous process engines that trigger payments and warranty claims.
Data-security suites remain steady as baseline defences, while predictive-maintenance offerings monetise verified equipment logs to extend service intervals. Digital-twin tokens introduce secondary-market liquidity for refurbished machinery, translating operational transparency into capital efficiency. Over time, bundled platforms that unite multiple use cases outperform point solutions, supporting long-run stickiness within the blockchain IoT market.
By End User: Transportation Dominance Challenged by Smart-City Surge
Transportation and logistics led with 27.10% revenue in 2025, leveraging tamper-proof e-bill-of-lading and cold-chain monitoring. Yet smart-city and government programmes are forecast to grow at 21.90% CAGR, propelled by municipal identity wallets and on-chain public-service logs. The resulting re-ordering diversifies the blockchain IoT market, lessening over-reliance on supply-chain budgets.
Manufacturing sustains double-digit momentum under Industry 4.0 retrofits, embedding verifiable process data into quality audits. Energy and utilities experiment with transactive-grid pilots that share surplus rooftop power, while healthcare players secure patient-generated sensor data through zero-knowledge proofs. Agricultural uptake is nascent but rising where provenance premiums justify device costs.
Geography Analysis
North America retained 35.60% of the blockchain IoT market revenue in 2025, aided by the US FSLMDA and deep venture funding pools. Federal and state pilots—such as 42 million blockchain-verified car titles—canonicalise ledger usage in public registries. Canadian utilities deploy peer-to-peer energy marketplaces, whereas Mexican exporters adopt provenance ledgers to satisfy USMCA traceability clauses.
APAC posts a 19.23% CAGR outlook to 2031, anchored by China’s goal of 3.6 billion cellular IoT links by 2027 . Japan spearheads blockchain-IoT interoperability standards, South Korea couples 5G and distributed ledgers in smart-city grids, and India pilots blockchain in crop-insurance schemes. Australia applies verified sensing to mining compliance.
Europe gains from the Markets in Crypto-Assets Regulation and eIDAS 2.0, supplying robust legal scaffolding for cross-border device identity. Germany champions industrial roll-outs, the Netherlands tracks port cargo, and France digitises luxury supply chains. The European Data Protection Board’s 2025 guidelines detail privacy-by-design ledger architectures
The Middle East and Africa leverage blockchain to leapfrog legacy grids, piloting smart-meter roll-outs and drone-based asset inspection. Selected South-American mines record ESG metrics on-chain to secure premium export pricing.

Competitive Landscape
The blockchain IoT market remains moderately fragmented. IBM pairs Hyperledger Fabric with Red Hat OpenShift to bundle containerised edge nodes, winning aviation parts traceability contracts. Microsoft embeds Confidential Computing enclaves in Azure Sphere to secure device roots of trust and recently partnered with Schneider Electric on predictive-maintenance ledgers. Cisco integrates blockchain into its IoT Control Center, targeting telecom carriers that monetize managed connectivity.
Emerging specialists pursue energy-efficient consensus chips and cross-chain routers. Helium-style DePIN operators tokenise last-mile connectivity, challenging telecom incumbents with community hotspots. Standards bodies such as IEEE level the playing field by codifying interoperable identity frameworks that commoditise baseline functions, shifting competition to value-added analytics and SLA guarantees.
Strategic investments shape the field. Bosch earmarked EUR 2.5 billion for blockchain-AI convergence, focusing on automated driving stacks. Honeywell collaborates with Verizon to connect smart meters over 5G, marrying near-real-time tariffs with blockchain-verified readings . Such cross-sector alliances highlight the shift from proof-of-concepts to production ecosystems.
Blockchain IoT Industry Leaders
IBM Corporation
Microsoft Corporation
Intel Corporation
Cisco Systems Inc.
Amazon Web Services Inc.
- *Disclaimer: Major Players sorted in no particular order

Recent Industry Developments
- June 2025: Bosch pledged EUR 2.5 billion for AI and blockchain IoT R&D, prioritising Economy-of-Things use cases Bosch Press
- May 2025: Microsoft recorded USD 70.1 billion Q1 revenue, crediting hybrid-cloud demand for blockchain-IoT workloads.
- March 2025: Honeywell and Verizon integrated 5G into smart meters to surf blockchain-verified energy data Honeywell.
- February 2025: Alectra launched GridExchange, a blockchain energy marketplace enabling real-time peer trading Alectra.


Global Blockchain IoT Market Report Scope
Blockchain, at its core, is a cryptographically secured, decentralized, distributed public ledger that allows users within the network to transfer data between parties, where miners verify the transaction before entering the chain. In contrast, IoT systems, with their centralized architecture, allow data transfer from devices to a central authority. The integration of both technologies led to the development of blockchain IoT platforms, such as IOTA, a platform designed for IoT to provide data transfer and transaction settlement between connected devices. Similar platforms include VeChain, Waltonchain, and Hdac.
The blockchain IoT market is segmented by offering (hardware, software, infrastructure), application (data security, smart contracts, data communication, asset tracking and management, and other applications), end user (manufacturing, energy utility, transportation and logistics, building management, retail, smart city), and geography (North America (United States, Canada), Europe (Germany, United Kingdom, France, Rest of Europe), Asia-Pacific (India, China, Japan, Rest of Asia-Pacific), Latin America, Middle East and Africa).The market sizes and forecasts are provided in terms of value in USD for all the above segments.
Core Offerings: The Blockchain IoT market is segmented by offering, application, end-user, and geography. Hardware, software, and infrastructure components form the core offerings, with applications ranging from data security and smart contracts to asset management.
Regional Leadership: Regionally, North America, particularly the United States, is a key market due to the early adoption of IoT and blockchain technologies. Europe and Asia-Pacific also show significant potential, with countries like Germany, the United Kingdom, China, and Japan leading in blockchain IoT implementations. Each region presents unique opportunities and challenges, influenced by factors such as regulatory environments, technological infrastructure, and market maturity.
| Hardware | IoT Sensors and Actuators |
| Gateways and Edge Devices | |
| Connectivity Modules | |
| Blockchain Chipsets | |
| Software | Middleware Platforms |
| Smart-Contract Management | |
| Identity and Access Management | |
| Analytics and Visualization | |
| Infrastructure | Public Chains |
| Private/Consortium Chains | |
| Cloud and Edge Services |
| Data Security |
| Smart Contracts and Automation |
| Data Communication and Integrity |
| Asset Tracking and Management |
| Predictive Maintenance |
| Other Niche Applications |
| Manufacturing |
| Energy and Utilities |
| Transportation and Logistics |
| Building Management and Smart Facilities |
| Retail and eCommerce |
| Smart Cities and Government |
| Healthcare and Life Sciences |
| Agriculture |
| North America | United States | |
| Canada | ||
| Mexico | ||
| South America | Brazil | |
| Argentina | ||
| Rest of South America | ||
| Europe | Germany | |
| United Kingdom | ||
| France | ||
| Italy | ||
| Spain | ||
| Russia | ||
| Rest of Europe | ||
| Asia-Pacific | China | |
| India | ||
| Japan | ||
| South Korea | ||
| Australia and New Zealand | ||
| Rest of Asia-Pacific | ||
| Middle East and Africa | Middle East | Saudi Arabia |
| United Arab Emirates | ||
| Turkey | ||
| Rest of Middle East | ||
| Africa | South Africa | |
| Nigeria | ||
| Rest of Africa | ||
| By Offering | Hardware | IoT Sensors and Actuators | |
| Gateways and Edge Devices | |||
| Connectivity Modules | |||
| Blockchain Chipsets | |||
| Software | Middleware Platforms | ||
| Smart-Contract Management | |||
| Identity and Access Management | |||
| Analytics and Visualization | |||
| Infrastructure | Public Chains | ||
| Private/Consortium Chains | |||
| Cloud and Edge Services | |||
| By Application | Data Security | ||
| Smart Contracts and Automation | |||
| Data Communication and Integrity | |||
| Asset Tracking and Management | |||
| Predictive Maintenance | |||
| Other Niche Applications | |||
| By End User | Manufacturing | ||
| Energy and Utilities | |||
| Transportation and Logistics | |||
| Building Management and Smart Facilities | |||
| Retail and eCommerce | |||
| Smart Cities and Government | |||
| Healthcare and Life Sciences | |||
| Agriculture | |||
| By Geography | North America | United States | |
| Canada | |||
| Mexico | |||
| South America | Brazil | ||
| Argentina | |||
| Rest of South America | |||
| Europe | Germany | ||
| United Kingdom | |||
| France | |||
| Italy | |||
| Spain | |||
| Russia | |||
| Rest of Europe | |||
| Asia-Pacific | China | ||
| India | |||
| Japan | |||
| South Korea | |||
| Australia and New Zealand | |||
| Rest of Asia-Pacific | |||
| Middle East and Africa | Middle East | Saudi Arabia | |
| United Arab Emirates | |||
| Turkey | |||
| Rest of Middle East | |||
| Africa | South Africa | ||
| Nigeria | |||
| Rest of Africa | |||


Key Questions Answered in the Report
What is the current size of the blockchain IoT market?
The blockchain IoT market is valued at USD 5.81 billion in 2026 and is projected to hit USD 13.66 billion by 2031, reflecting an 18.62% CAGR.
Which region leads the blockchain IoT market?
North America holds 35.60% share in 2025 owing to supportive regulation and mature enterprise adoption.
Which application segment is growing fastest?
Smart contracts and automation post a 23.10% CAGR through 2031 as firms shift to autonomous, rules-based workflows.
What is the biggest restraint on adoption?
Limited compute capacity on low-power IoT devices reduces feasibility of on-device cryptographic operations, subtracting an estimated 2.8% from forecast CAGR.
Why are Layer-2 roll-ups important for blockchain IoT?
They boost throughput to industrial thresholds (>4,000 tps) while keeping latency low, enabling real-time control workloads.
How fragmented is the vendor landscape?
Top players IBM, Microsoft, Cisco, Bosch and Honeywell account for roughly 60% combined revenue, indicating moderate concentration with active specialist competition.
Page last updated on:


