
IoT Chip Market Size and Share
Market Overview
| Study Period | 2020 - 2031 |
|---|---|
| Market Size (2026) | USD 0.77 Trillion |
| Market Size (2031) | USD 1.51 Trillion |
| Growth Rate (2026 - 2031) | 14.45 % |
| Fastest Growing Market | Middle East and Africa |
| Largest Market | Asia Pacific |
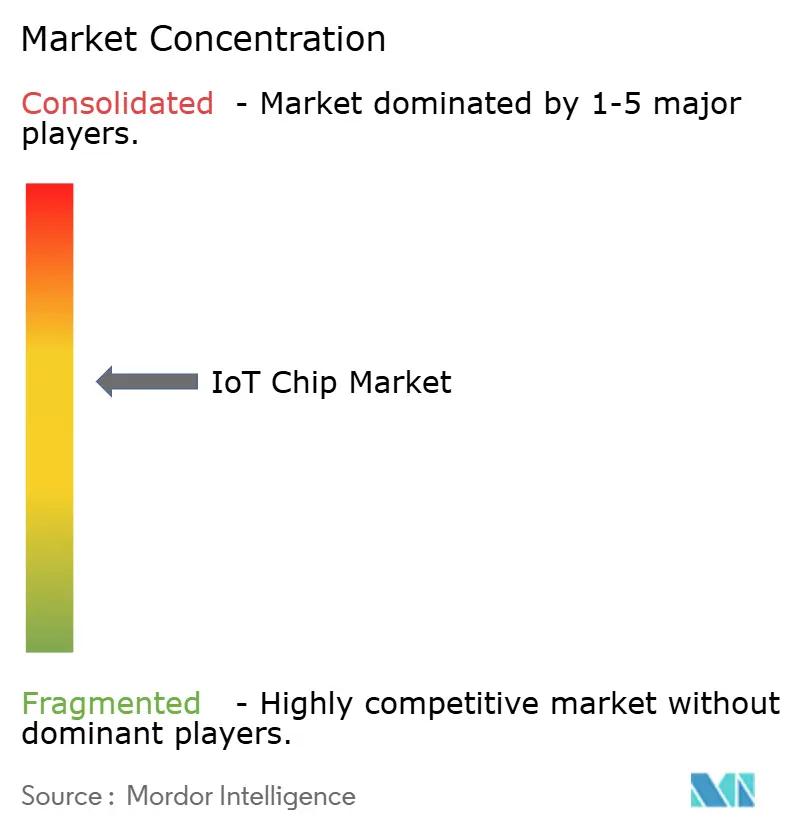
| Market Concentration | Medium |
Major Players *Disclaimer: Major Players sorted in no particular order Image © Mordor Intelligence. Reuse requires attribution under CC BY 4.0. | |
IoT Chip Market Analysis by Mordor Intelligence
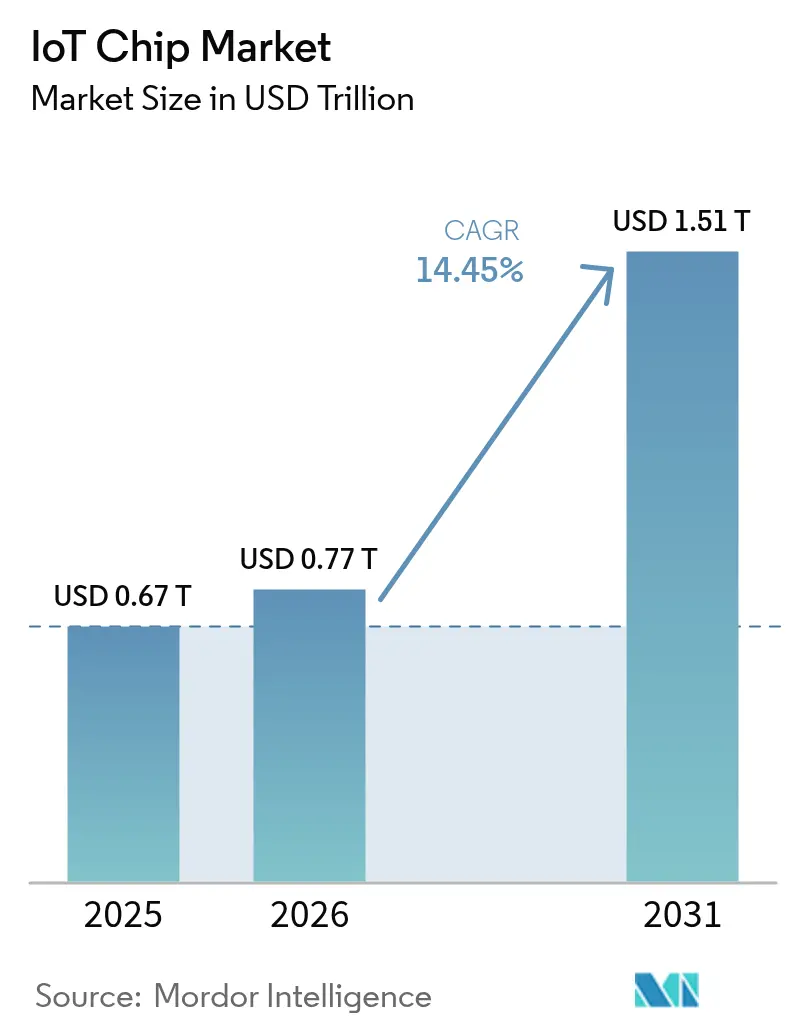
The IoT Chip market size is expected to grow from USD 0.67 trillion in 2025 to USD 0.77 trillion in 2026 and is forecast to reach USD 1.51 trillion by 2031 at 14.45% CAGR over 2026-2031. The Global IoT chip market size expansion is driven by distributed edge AI processing, industrial automation programs, and a steady increase in connected consumer devices. Manufacturers are shifting workloads from the cloud to the edge, compelling IoT silicon to incorporate neural acceleration while maintaining power budgets below single-digit milliwatts. Government incentives aimed at regionalizing semiconductor fabrication are encouraging new fabs in North America and Europe, while reshoring policies are altering sourcing strategies across the Global IoT Chip market. Supply-chain diversification aligns with technology-node bifurcation: advanced nodes (<14 nm) enable resource-intensive AI inference, while mature nodes (28–40 nm) maintain competitive costs for mass-market sensors.[1]U.S. Department of Commerce, “Semiconductor Industry,” commerce.gov
Key Report Takeaways
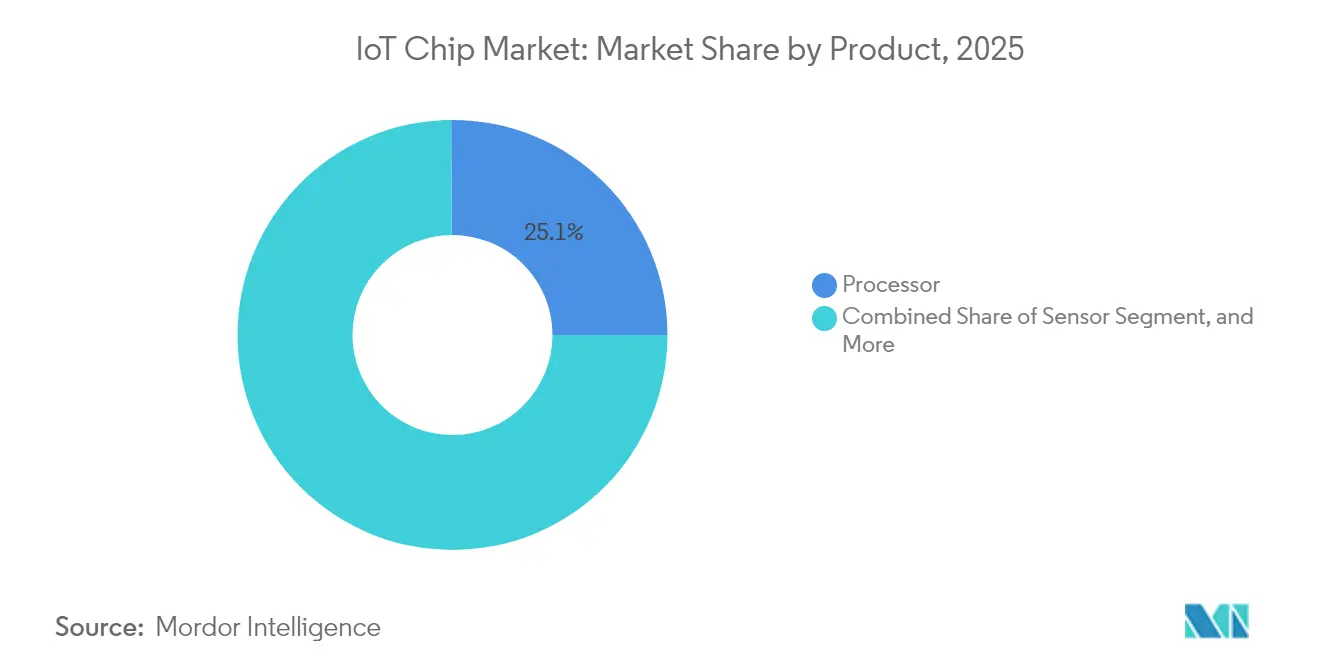
- By product, processors held 25.10% of the IoT Chip market share in 2025; security ICs are projected to expand at a 17.55% CAGR through 2031.
- By end-user, the industrial and manufacturing sector commanded a 22.20% share of the IoT Chip market in 2025, while the automotive sector is poised to grow at a 16.45% CAGR to 2031.
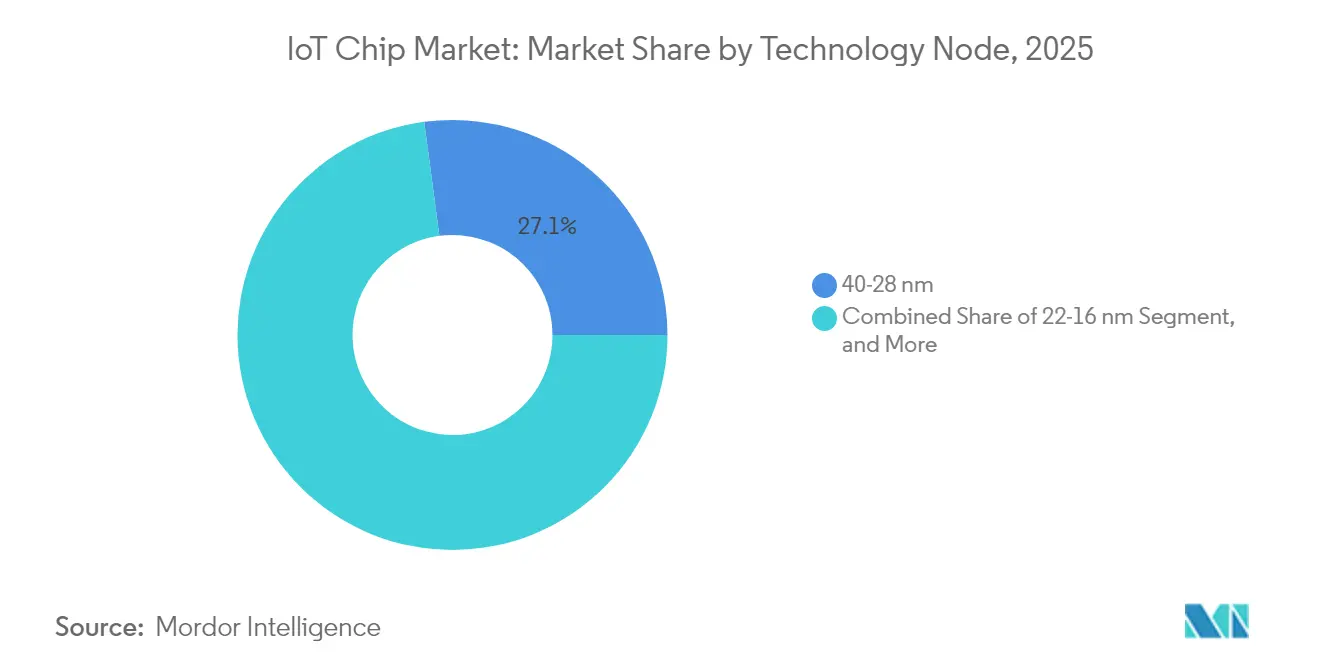
- By technology node, the 40-28 nm segment led with a 27.10% share of the IoT Chip market in 2025; the ≤14 nm segment is forecast to advance at a 18.72% CAGR.
- By connectivity technology, Wi-Fi captured a 38.05% revenue share of the IoT Chip market in 2025; 5G RedCap is the fastest-growing segment at a 18.85% CAGR.
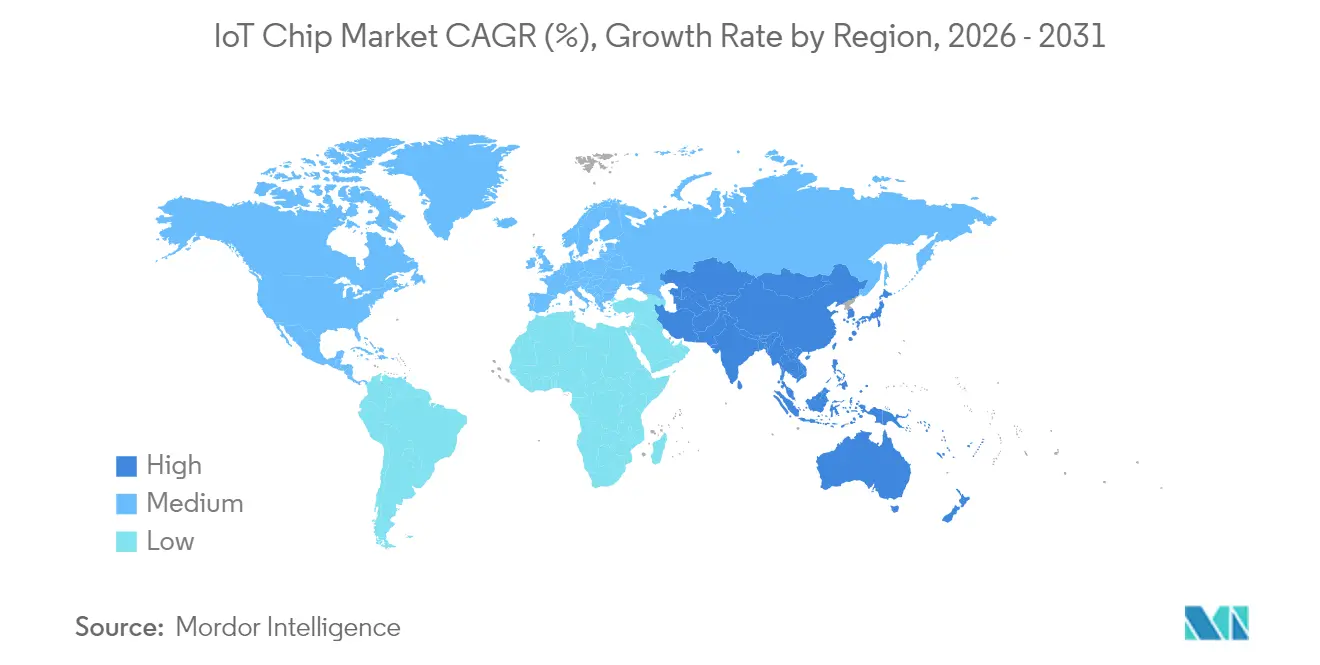
- By geography, Asia-Pacific accounted for 34.40% of the IoT Chip market size in 2025; the Middle East and Africa region is forecast to rise at a 18.35% CAGR.
Note: Market size and forecast figures in this report are generated using Mordor Intelligence’s proprietary estimation framework, updated with the latest available data and insights as of 2026.
Market Trends and Insights
Drivers Impact Analysis of IoT Chip Market*
| Driver | (~) % Impact on CAGR Forecast | Geographic Relevance | Impact Timeline |
|---|---|---|---|
| Proliferation of connected consumer and wearable devices | +3.20% | Global, with concentration in North America and Asia Pacific | Medium term (2-4 years) |
| Industry 4.0-led demand for low-power MCUs | +2.80% | Asia Pacific core, spill-over to Europe and North America | Long term (≥ 4 years) |
| Automotive ADAS and V2X silicon requirements | +2.40% | Global, early adoption in Europe and North America | Medium term (2-4 years) |
| Edge-AI inference inside IoT SoCs | +2.10% | Global, led by North America and Asia Pacific | Short term (≤ 2 years) |
| Matter protocol accelerating smart-home refresh cycles | +1.80% | North America and Europe, expanding to Asia Pacific | Short term (≤ 2 years) |
| Satellite and sub-GHz connectivity for remote asset tracking | +1.50% | Global, with emphasis on rural and remote regions | Long term (≥ 4 years) |
| Source: Mordor Intelligence | |||
Proliferation of Connected Consumer and Wearable Devices
Demand for ambient computing experiences is lifting volumes for ultra-low-power chips that keep sensors and radios active at all times. Health-focused wearables now integrate medical-grade photoplethysmography, temperature, and ECG sensors that need secure data paths to comply with tightening privacy rules. Qualcomm reported USD 1.5 billion in IoT revenue for Q1 2025, up 36% year over year, underscoring consumer momentum. As 5G modems converge with on-device AI, designers shift to heterogeneous SoCs that fuse application processors, NPUs, and connectivity on one die, driving silicon-area efficiency across the Global IoT Chip market.
Industry 4.0-Led Demand for Low-Power MCUs
Factories deploying digital twins and predictive maintenance lean on microcontrollers that ingest vibration, thermal, and acoustic data locally, cutting network latency. Intel’s smart-factory line achieved near-theoretical yield through real-time lithography calibration, proving the value of edge analytics inside harsh environments. Rugged MCUs now combine machine-learning instruction sets with secure boot and OTA updates, positioning the Global IoT Chip market for sustained industrial orders through the decade.[2]NXP Semiconductors, “NXP Agrees to Acquire Edge AI Pioneer Kinara to Redefine the Intelligent Edge,” nxp.com
Automotive ADAS and V2X Silicon Requirements
Sensor-fusion workloads for L2+ autonomy require chips that process multiple 4 k video streams while meeting ASIL-D functional-safety targets. Qualcomm’s automotive revenue rose 59% year over year to USD 959 million in Q2 2025, reflecting automaker adoption of centralized compute platforms. Dedicated V2X modems that aggregate 5G, Wi-Fi 6E, and sidelink channels are moving into mass production, expanding the Global IoT Chip market beyond infotainment domains.
Edge-AI Inference Inside IoT SoCs
On-device learning reduces cloud roundtrips and safeguards data. NXP’s USD 307 million acquisition of Kinara brings energy-efficient NPUs that deliver 0.5 TOPS per milliwatt for predictive-maintenance models. Advanced packaging such as fan-out RDL stacks high-bandwidth memory next to compute blocks, enabling small footprints for wearables and industrial sensors within the Global IoT Chip market.
Restraints Impact Analysis of IoT Chip Market*
| Restraint | (~) % Impact on CAGR Forecast | Geographic Relevance | Impact Timeline |
|---|---|---|---|
| End-to-end security and privacy vulnerabilities | -2.10% | Global, with heightened concerns in Europe and North America | Short term (≤ 2 years) |
| Fragmented communications standards | -1.80% | Global, particularly affecting interoperability initiatives | Medium term (2-4 years) |
| Legacy-node (28/40 nm) foundry capacity crunch | -1.50% | Global, concentrated in Asia Pacific manufacturing hubs | Short term (≤ 2 years) |
| Export-control limits on advanced RF IP | -1.20% | China and restricted regions, indirect global impact | Long term (≥ 4 years) |
| Source: Mordor Intelligence | |||
End-to-End Security and Privacy Vulnerabilities
The White House Cyber Trust Mark requires compliance with NIST IR 8425, raising the bar for secure-element integration in resource-limited devices. Cost-sensitive OEMs face additional silicon area and firmware validation expenses. Rising quantum-computing threats press chipmakers to support lattice-based cryptography, delaying product launches and tempering short-term Global IoT Chip market growth.[3]OpenSystems Media, “U.S. Cyber Trust Mark: Security Guidance for IoT Product Designers,” embeddedcomputing.com
Legacy-Node (28/40 nm) Foundry Capacity Crunch
Foundries prioritize high-margin 5 nm and 3 nm lines, limiting mature-node wafers essential for ultra-low-cost sensors. Supply tightness elevates die-cost curves and sparks design migrations to smaller geometries sooner than roadmaps anticipated, pressuring profit margins across the Global IoT Chip market.
*Our forecasts treat driver/restraint impacts as directional, not additive. The impact forecasts reflect baseline growth, mix effects, and variable interactions.
IoT Chip Market Segment Analysis
By Product:
Processors Lead, Security ICs AccelerateProcessors generated the largest revenue slice in 2025 at 25.10%, anchored by single-die combos that merge CPU, NPU, and multi-protocol radios. Enhanced integration trims printed-circuit area and shortens certification cycles, fortifying processor dominance in the Global IoT Chip market. Security ICs are poised for the fastest expansion with a 17.55% CAGR as zero-trust architectures embed hardware roots-of-trust into every node of the IoT Chip market. Sensor, connectivity, memory, logic, and power-management lines track broader unit shipment curves, with specialized low-power DRAM commanding premium price points.
Upgrades in in-package voltage regulation now supply sub-0.5 V rails for AI accelerators, extending battery life in wearables. MEMS makers push shippable pressure sensors below 0.8 mm height, opening design space in rings and earbuds. SEALSQ secured contracts for 24 million quantum-resistant chips that protect UK smart meters, showcasing a security shift across critical infrastructure.



By End-User:
Industrial Commands Volume, Automotive Scales FastIndustrial and manufacturing retained a 22.20% share in 2025 as digital-twin rollouts scaled across Asia Pacific plants. Demand for condition-monitoring MCUs sustains double-digit unit growth through 2030. Automotive leads in CAGR at 16.45% as software-defined vehicles centralize compute domains. The IoT Chip market size for automotive silicon is projected to climb sharply on the back of zonal architectures that cut harness weight and enable OTA feature upsells.
Healthcare extends beyond remote monitoring to regulated device connectivity frameworks, strengthening demand for certified secure elements. Retail pilots using AI-powered inventory robots enlist vision-optimized SoCs to reconcile shelf stock in real time, diversifying the IoT Chip market revenue base. Building-automation orders rise as passive optical networks connect HVAC, lighting, and security over a single fibre backbone.
By Technology Node:
Mature Nodes Dominate, Advanced Nodes SurgeThe 40–28 nm tier held 27.10% share in 2025, underpinning cost-sensitive wearables and sensors in the IoT Chip market. Design reuse and fully depreciated tooling keep die costs low, though capacity constraints tighten supply. The ≤14 nm tier grows at 18.72% CAGR as edge-AI workloads need dense SRAM and LPDDR interfaces. TSMC’s nanosheet-based 2 nm path promises 15% speed gains with 30% lower power, pointing to further AI-centric growth.
In parallel, 22–16 nm FinFET nodes balance performance and cost for mid-range gateways. Legacy ≥90 nm lines remain viable for ultra-low-end sensors, although volumes slide as integration benefits. Favor mixed-signal SoCs at smaller geometries within the IoT Chip market.
By Connectivity Technology:
Wi-Fi Rules, 5G RedCap EmergesWi-Fi held 38.05% revenue in 2025, buoyed by Wi-Fi 6E rollouts that triple available spectrum. Thread and Zigbee gain renewed attention under the Matter umbrella, simplifying commissioning flows. 5G RedCap chips scale at 18.85% CAGR, bridging the gap between NB-IoT and full 5G, with AT&T executing the first U.S. carrier launch in 2024. Satellite IoT startups launch low-earth constellations, extending coverage to maritime and mining assets, expanding total addressable endpoints for the IoT Chip market.
Ultra-wideband anchors precision ranging in automotive keyless entry and asset-tracking tags. NB-IoT and LTE-M hold steady in utilities, where 10-year battery life outweighs bandwidth needs. Combined protocol SoCs mitigate PCB area growth, reinforcing multi-radio coexistence as a design norm.
Geography Analysis
APAC and North America IoT Chip Market
Asia-Pacific contributed 34.40% of the IoT Chip market revenue in 2025, propelled by Taiwan’s 63.8% share of total semiconductor output and China’s capacity build-out. Vertical integration from wafer to packaging lowers lead times, letting OEMs iterate faster. Yet export controls nudge multinational OEMs toward capacity hedging in Japan, India, and the United States, reshaping the IoT Chip market supply map.
MEA IoT Chip Market
The Middle East and Africa exhibit the fastest trajectory at 18.35% CAGR. Gulf smart-city budgets allocate billions for traffic analytics, energy dashboards, and public-safety sensor grids, demanding robust, wide-temperature-range silicon. 5G rollouts across North Africa unlock low-latency telemetry for logistics corridors stretching from ports to inland free-trade zones, enlarging the endpoint base for the IoT Chip market.
North America and Europe IoT Chip Market
North America and Europe remain innovation centers. The U.S. CHIPS Act channels USD 50 billion into fabs across 16 states, doubling domestic advanced-node capacity to 22% by 2027. Europe’s Chips Act targets a 20% global share by 2030, with Intel and STMicroelectronics investing in Germany and France clusters. These regions prioritize high-value automotive and medical silicon, forming lucrative slices of the IoT Chip market size despite moderate unit growth.

Regulatory Landscape
IoT chip suppliers are working within a more prescriptive, security-led compliance environment that increasingly links device eligibility to hardware-backed controls. In the United States, the FCC Cyber Trust Mark program aligns with NIST guidance such as NIST IR 8425, and NIST advanced federal IoT security guidance further references the June 2026 initial public draft of SP 800-213r1 (comment window open through August 24, 2026). These updates are driving higher attach rates for secure elements, secure boot, and authenticated OTA mechanisms across consumer and industrial IoT platforms.
Regulation is also influencing sourcing and go-to-market through trade actions and region-specific labeling schemes. The United States implemented a Section 301 tariff action on semiconductors from China effective December 23, 2025 (initial rate set at 0% with a scheduled increase on June 23, 2027), while other national measures continue to reinforce trusted supply-chain requirements for sensitive silicon. In Asia-Pacific, Australia brought the Cyber Security (Security Standards for Smart Device) Rules 2025 into effect on March 4, 2026, and Japan expanded its JC-STAR program with STAR-3 requirements for network devices and network cameras released on July 13, 2026; mutual recognition between Japan JC-STAR and Singapore CLS began on June 1, 2026, providing a pathway to harmonize documentation and test evidence across select markets.
Value Chain Analysis
The IoT chip value chain covers IP and EDA enablement, fabless design and firmware stacks, wafer fabrication across advanced and mature nodes, OSAT assembly and test, module manufacturing, and distribution into OEMs and industrial integrators. Mature-node dependence remains structurally important for mass-market sensors, MCUs, connectivity ICs, and PMICs, while advanced nodes support edge-AI SoCs that combine CPU, NPU, and multi-protocol radios. Regionalization initiatives such as the US CHIPS Act and the EU Chips Act are pulling portions of the chain toward new geographies, but the ecosystem still relies heavily on Asia-Pacific foundry and packaging capacity, keeping qualification, second-source strategies, and long-term wafer agreements central to procurement.
Supply-chain friction points continue to cluster around mature-node wafer availability, specialty materials, and packaging and test capacity for high-mix IoT products. As of mid-2026, 32-bit industrial MCUs and PMICs have faced lead times reported up to 52 weeks in constrained categories, reflecting competition for mature-node capacity as fabs prioritize higher-margin programs. The 2026 materials backdrop added risk through a temporary helium export ban tightening global supplies, while industry responses included efforts to rebalance mature-node output toward industrial demand, including reports of a 28 nm capacity increase starting in Q3 2026 and lead-time reductions for certain industrial-grade MCUs to around 12 weeks where reallocation occurred. On the back end, sector-specific OSAT capacity for telecom and industrial hardware has been highlighted by ecosystem participants, reinforcing packaging and test as a strategic bottleneck alongside wafer starts.
Competitive Landscape
The IoT Chip market shows moderate fragmentation. Top vendors exploit scale advantages in lithography R&D and multi-year wafer agreements, sustaining price leverage. Yet specialist start-ups differentiate with post-quantum security cores, sub-100 µW NPUs, and satellite-ready RF front ends. Partnerships multiply: Qualcomm joined STMicroelectronics to couple AI radios with STM32 MCUs shipping in 2025, providing turnkey boards for OEMs. Vertical integration trends push giants to secure silicon, software, and services under one brand, raising entry barriers.
Mid-tier suppliers collaborate with cloud hyperscalers for edge-SDK support. White-label ODMs in China and Taiwan iterate on reference designs to serve long-tail device makers, keeping downstream pricing competitive. As mature-node capacity tightens, buyers dual-source die revisions across foundries to hedge risk, amplifying vendor-management complexity throughout the Global IoT Chip market.
Third-party IP licensors open secure-element cores on flexible royalty terms, enabling Tier-2 MCU vendors to integrate cryptography quickly. This dynamic sustains a pipeline of feature-rich yet cost-aware alternatives, preventing rapid consolidation and keeping the Global IoT Chip market structurally competitive.
IoT Chip Industry Leaders
Qualcomm Technologies Inc.
Texas Instruments Incorporated
NXP Semiconductors N.V.
STMicroelectronics N.V.
MediaTek Inc.
- *Disclaimer: Major Players sorted in no particular order
IoT Chip Market Companies Covered in this Report
- Qualcomm Technologies Inc.
- Intel Corporation
- Texas Instruments Incorporated
- NXP Semiconductors N.V.
- Cypress Semiconductor Corporation (Infineon)
- MediaTek Inc.
- Microchip Technology Inc.
- Samsung Electronics Co., Ltd.
- Silicon Laboratories Inc.
- TDK InvenSense Inc.
- STMicroelectronics N.V.
- Nordic Semiconductor ASA
- Analog Devices, Inc.
- Broadcom Inc.
- Infineon Technologies AG
- Renesas Electronics Corporation
- ON Semiconductor Corporation
- Arm Holdings plc
- NVIDIA Corporation
- Marvell Technology Group Ltd.

Market Opportunities and Future Outlook
Opportunities in the IoT chip market are widening where regulatory-grade security, edge AI, and multi-protocol connectivity converge into higher-value silicon content per endpoint. Security labeling and guideline programs, including FCC Cyber Trust Mark aligned to NIST guidance and NISTs June 2026 SP 800-213r1 initial public draft for federal IoT product cybersecurity, are increasing demand for hardware roots of trust, secure update pipelines, and auditable security capabilities that can be delivered cost-effectively in MCUs and companion security ICs. Multi-protocol SoCs that support Matter-era requirements, including Thread, Zigbee, BLE, and Wi-Fi coexistence, are also creating whitespace for vendors that can integrate RF, security, and low-power compute without expanding BOM complexity.
Manufacturing and ecosystem investments are also opening whitespace in mature nodes and advanced packaging that map to IoT device volumes. UMCs Singapore fab expansion opened in April 2025 with volume production of 22 nm and 28 nm semiconductors for IoT and automotive scheduled to begin in 2026, while reported 28 nm capacity actions in 2026 have been framed around serving smart home gateways and industrial sensors, easing procurement pressure for module makers that depend on long-lived nodes. Additional headroom is being created through government-supported capability build-outs in specialty processes and packaging, including Tower Semiconductors July 2026 announcement of a dual-track expansion in Japan spanning Silicon Photonics, Silicon Germanium, and advanced packaging, which can support higher-integration industrial sensing, gateway aggregation, and low-latency edge inference designs. Connectivity remains an active opportunity area as RF component bottlenecks persist, for example acoustic filters, and ecosystem roadmaps emphasize standardized APIs and zero-touch provisioning to reduce deployment friction, pulling more value into reference designs, pre-certified modules, and turnkey silicon-plus-software platforms.
Recent Industry Developments in IoT Chip Market
- June 2026: Quectel launched the FCM365X module based on NXP Semiconductors RW612 wireless MCU for smart home and industrial IoT, integrating Wi-Fi 6 and multiple low-power protocols in one module. The release helps OEMs shorten certification and design cycles while meeting multi-protocol requirements driven by Matter-era interoperability. It also strengthens the module layer of the value chain as a speed-to-market lever when mature-node lead times and RF availability complicate discrete designs.
- February 2026: Texas Instruments signed a definitive agreement to acquire Silicon Labs for approximately USD 7.5 billion in an all-cash transaction. The deal targets expanded embedded wireless connectivity breadth alongside TI microcontrollers and analog portfolios, tightening vertical integration for IoT device makers seeking validated compute-plus-connectivity roadmaps. It also raises competitive pressure on standalone connectivity IC providers and MCU vendors that rely on third-party wireless stacks.
- February 2025: NXP closed its USD 307 million acquisition of Kinara, adding energy-efficient NPUs to its edge-AI lineup. The combination supports on-device inference for industrial monitoring and other edge workloads where latency and data locality drive design choices. It also accelerates heterogeneous IoT SoC and accelerator adoption by bringing a dedicated edge-AI asset under NXP control.


IoT Chip Market Report Scope and Research Methodology
Market Definition and Coverage
This market covers revenue generated from chips that enable connected IoT devices to sense, process, secure, and communicate data, across consumer, industrial, automotive, healthcare, and building uses, and across major geographies.
Scope exclusions: We exclude non-chip IoT hardware, pure software platforms, and services revenue that sits outside semiconductor device sales.
Segments Covered in This Report
- By Product
- Processor
- Sensor
- Connectivity IC
- Memory Device
- Logic Device
- Power-Management IC
- Security IC
- By End-user
- Healthcare
- Consumer Electronics
- Industrial and Manufacturing
- Automotive
- BFSI
- Retail
- Building Automation
- Other End-users
- By Technology Node
- ≥90 nm
- 65-45 nm
- 40-28 nm
- 22-16 nm
- ≤14 nm
- By Connectivity Technology
- Bluetooth / BLE
- Wi-Fi (802.11x)
- NB-IoT / LTE-M
- 5G RedCap
- Ultra-Wideband (UWB)
- Thread / Zigbee
- Satellite IoT
- By Processor Architecture
- Arm-based
- RISC-V
- x86
- Other / Hybrid
- By Geography
- North America
- United States
- Canada
- Mexico
- South America
- Brazil
- Argentina
- Rest of South America
- Europe
- Germany
- United Kingdom
- France
- Italy
- Spain
- Rest of Europe
- Asia-Pacific
- China
- Japan
- South Korea
- India
- Singapore
- Australia
- Rest of Asia-Pacific
- Middle East and Africa
- Middle East
- Saudi Arabia
- United Arab Emirates
- Turkey
- Rest of Middle East
- Africa
- South Africa
- Nigeria
- Egypt
- Rest of Africa
- Middle East
- North America
Data Sources, Market Sizing, and Validation
Desk Research
Desk research is used to set up the first structure of the model, especially for chip shipment direction, node migration, and connectivity adoption. We reviewed public sources such as the International Telecommunication Union (ITU) for connectivity indicators, IEEE publications for protocol and device trends, the U.S. International Trade Commission and UN Comtrade for trade signals on relevant electronics categories, and the World Semiconductor Trade Statistics (WSTS) for semiconductor cycle context.
Along with these, we used company filings and investor presentations to understand mix shifts between processors, sensors, connectivity ICs, and security or power-management ICs, which then guided where ASPs are likely to move. A paid subscription source was also used for company financials and news to time-check major demand events and supply-side constraints. The desk sources referenced above are illustrative only, and many other public materials were also used for collection, validation, and clarification.
Primary Interviews and Surveys
Primary work was used to validate what desk sources cannot show clearly, such as pricing behavior by node, realistic attach rates for connectivity ICs, and what share of device growth converts into chip revenue. We spoke with stakeholders across the value chain, including chip suppliers, module and device integrators, distributors, and large end users, and we covered APAC, EMEA, and the Americas so regional demand patterns were not over-assumed.
Distribution of primary research fieldwork respondents
| Company type | Respondent position | Region |
|---|---|---|
| Top tier: 27% | CXOs: 16% | APAC: 49% |
| Mid tier: 57% | Functional/Unit leaders: 26% | EMEA: 32% |
| Smaller Players: 16% | Managers: 58% | Americas: 19% |
Market-Sizing & Forecasting
Sizing starts with a top-down build where semiconductor demand is reconstructed using IoT device growth signals and then translated into chip revenue by applying category mix and pricing logic. The model is anchored on practical inputs such as connected device additions, connectivity technology penetration (for example Wi-Fi, Bluetooth, cellular LPWAN, and 5G), average chip content per device type, and the technology-node mix shift that changes cost and performance over time.
Once the first total is formed, selective bottom-up checks are used to keep it realistic, including sampled supplier revenue roll-ups by product family, channel feedback on unit movement, and sanity checks on implied ASP times volume for key chip categories. Where unit or price visibility is weaker, we handle gaps by using bounded ranges agreed during interviews, and then the midpoint is tested against observable demand indicators before finalizing.
For forecasting, scenario analysis is used because IoT chip demand is strongly tied to macro cycles and deployment timing across industries. The scenarios are driven by variables like industrial automation spending, automotive electronics content growth, smart home shipment momentum, and regional manufacturing output trends, and the final forecast path is selected after checking what primary respondents see as the most likely adoption and pricing trajectory.
Data Validation & Update Cycle
Outputs are validated through cross-checks, where model totals are compared with independent signals such as semiconductor cycle direction, connectivity adoption markers, and implied shipment and pricing realism by chip category. When a variance looks unusual, assumptions are revisited, and follow-up calls are triggered to confirm whether the issue is scope, timing, or a price or mix change.
Before sign-off, the work is reviewed in multiple steps so input series, formulas, and conversions stay consistent across years and regions. The report is refreshed annually, and interim updates are made when there are material events that can shift demand or pricing, followed by a final pre-delivery pass so clients receive the latest updated view.
Mordor Intelligence's IOT Chip Market Size Versus Other Published Estimates
Published market sizes for IoT chips can look far apart, even when the topic label seems identical. Differences usually come from the year chosen for the headline number, the USD conversion timing, and how average selling prices are treated when product mix moves across nodes and connectivity technologies.
A refresh-led gap shows up when pricing and currency assumptions are not updated in step with semiconductor cycle changes, which then pushes totals up or down even if unit growth is similar. When ASP curves are rechecked during updates and FX conversion is aligned to the stated year for the full time series, the spread versus slower-refresh figures narrows, and that refresh discipline is maintained by Mordor Intelligence.
Benchmark comparison
| Source | Market Size | Gaps in Research Methodology |
|---|---|---|
| Mordor Intelligence | USD 0.67 T (2025) | |
| Industry Publisher A | USD 476.4 B (2024) | Uses an earlier base year and a slower growth arc, and the scope and pricing treatment are not clearly tied to node-driven mix shifts, which can compress the implied ASP progression. |
| Industry Publisher B | USD 186.1 B (2022) | Anchors the market on an older base year and a shorter horizon, and the definition appears more restrictive on what hardware is counted, which reduces the starting pool before forecasting. |
The table shows that timing and scope create most of the spread, and pricing updates can widen it further in fast-moving chip categories. Our approach stays traceable because the market is rebuilt from clear demand signals, then checked with practical supplier and channel validations, and then refreshed so the final number remains aligned to the stated year assumptions.


Key Questions Answered in the Report
What is the current value of the IoT Chip market?
The market is valued at USD 0.77 trillion in 2026 and is projected to reach USD 1.51 trillion by 2031.
Which product category leads the IoT Chip market?
Processors lead with 25.10% revenue share in 2025, supported by high integration of compute and connectivity.
Which end-user industry is growing fastest?
Automotive applications show the highest CAGR at 16.45% through 2031 due to ADAS and V2X adoption.
Which region has the largest IoT Chip market share?
Asia-Pacific holds 34.40% of revenue in 2025, benefiting from concentrated manufacturing capacity.
Why is 5G RedCap important for IoT?
5G RedCap offers a cost-efficient step-up from NB-IoT while supporting higher bandwidth, driving a 18.85% CAGR in connectivity chips.
How are security concerns influencing chip design?
Compliance with initiatives like the U.S. Cyber Trust Mark is pushing secure element attach rates higher, adding dedicated cryptographic hardware into mainstream IoT SoCs.
Page last updated on:





