
Market Overview
| Study Period | 2020 - 2031 |
|---|---|
| Market Size (2026) | USD 0.51 Billion |
| Market Size (2031) | USD 4.08 Billion |
| Growth Rate (2026 - 2031) | 51.57 % |
| Fastest Growing Market | Asia-Pacific |
| Largest Market | North America |
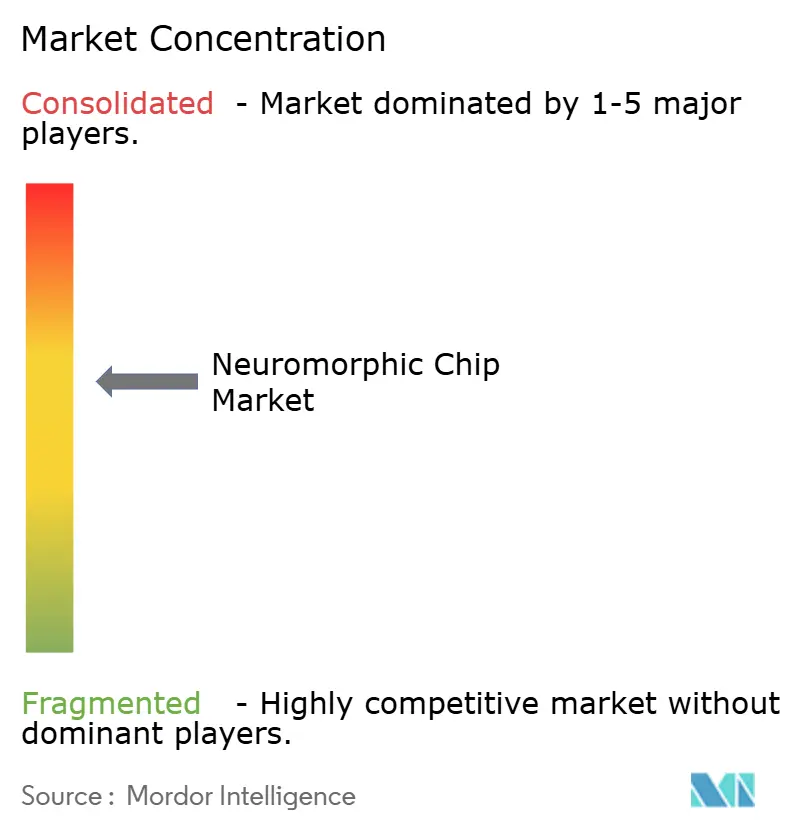
| Market Concentration | Medium |
Major Players *Disclaimer: Major Players sorted in no particular order Image © Mordor Intelligence. Reuse requires attribution under CC BY 4.0. | |
Neuromorphic Chip Market Analysis by Mordor Intelligence
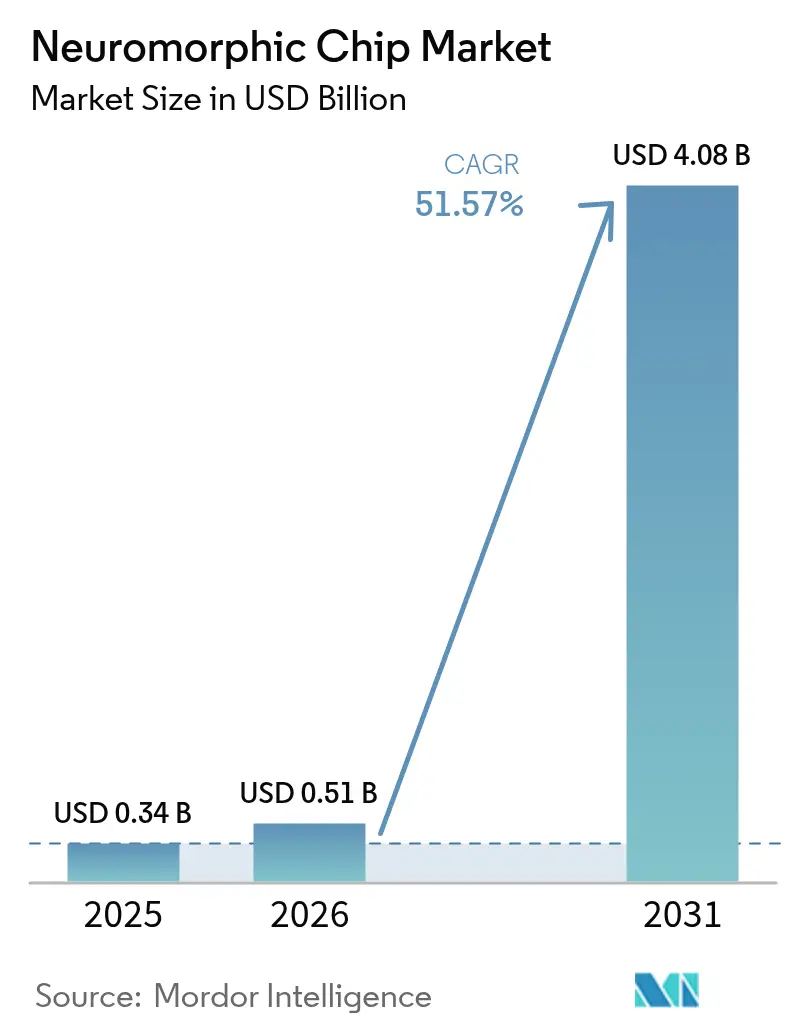
The neuromorphic chip market size is projected to expand from USD 0.34 billion in 2025 and USD 0.51 billion in 2026 to USD 4.08 billion by 2031, registering a CAGR of 51.57% between 2026 to 2031. Growth reflects a decisive shift away from von Neumann computing toward brain-inspired architectures that place memory beside processing, eliminating the energy penalty of data shuttling. Edge devices in consumer electronics, autonomous vehicles, and industrial sensors now target sustained power budgets below 1 milliwatt, a threshold that spiking neural networks in the neuromorphic chip market can consistently meet. In parallel, hyperscale data-center operators face soaring electricity bills due to ever-larger language models, prompting pilot projects to replace GPUs with analog in-memory compute arrays. Governments in the United States, China, and the European Union continue to earmark multi-year funding for brain-inspired hardware, accelerating tool-chain maturity and de-risking silicon tape-outs.
Key Report Takeaways
- By chip type, digital processors held a 43.56% share of the neuromorphic chip market size in 2025; mixed-signal designs are projected to post the fastest 52.19% CAGR through 2031.
- By architecture, ReRAM-based designs accounted for 23.67% of 2025 revenue; the same segment is also set to expand at a 52.11% CAGR through 2031.
- By end-user industry, aerospace and defense led with 29.73% of 2025 revenue; consumer electronics is forecast to advance at a 52.66% CAGR through 2031.
- By deployment model, edge devices captured 59.47% of 2025 revenue; the edge segment is expected to grow at a 51.93% CAGR over the forecast period.
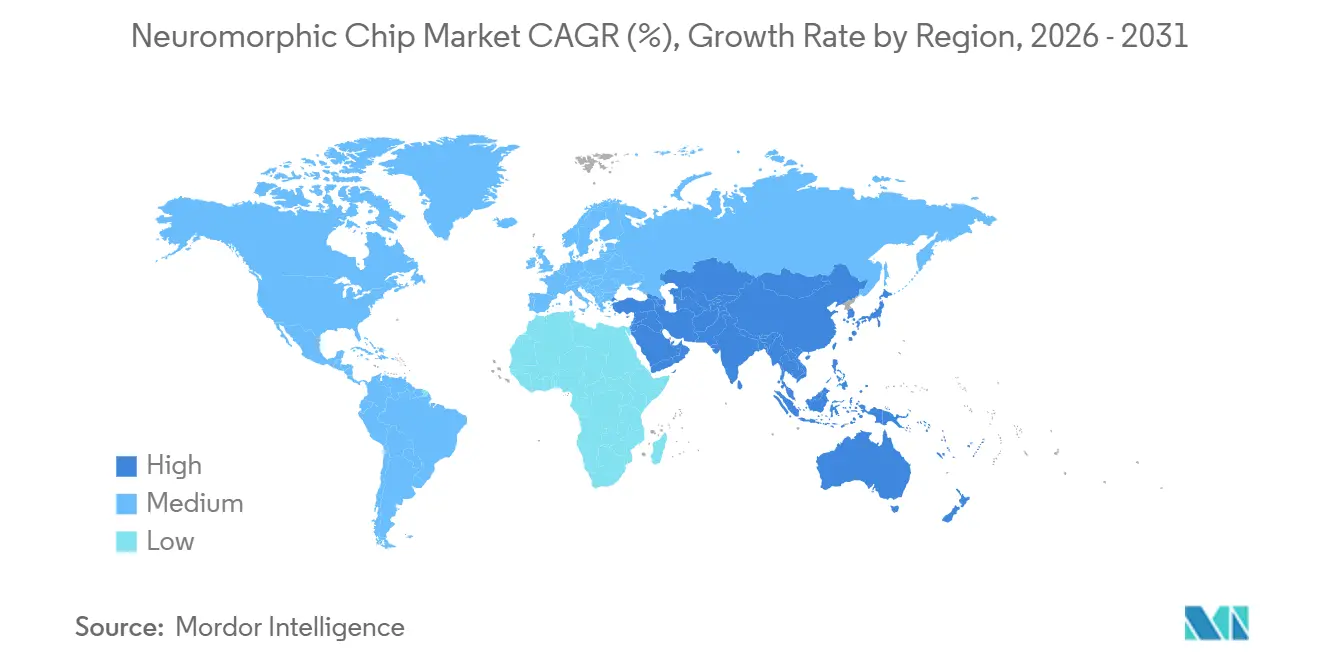
- By geography, North America accounted for 39.31% of 2025 revenue; Asia Pacific is projected to register the highest CAGR of 52.49% between 2026 and 2031.
Note: Market size and forecast figures in this report are generated using Mordor Intelligence’s proprietary estimation framework, updated with the latest available data and insights as of 2026.
Market Trends and Insights
Drivers Impact Analysis of Neuromorphic Chip Market*
| Driver | (~) % Impact on CAGR Forecast | Geographic Relevance | Impact Timeline |
|---|---|---|---|
| Rising Edge AI Demand in Consumer and Automotive | +12.3% | Global, with concentration in Asia Pacific and North America | Medium term (2-4 years) |
| Data-Center Energy Crisis Favoring Ultra-Low-Power Compute | +9.7% | Global, especially North America and Europe data-center hubs | Long term (≥ 4 years) |
| Government Brain-Inspired R&D Programs | +8.1% | North America, Europe, China | Long term (≥ 4 years) |
| Expansion of Autonomous Vehicle Domain Controller Architectures | +7.4% | North America, Europe, China, Japan | Medium term (2-4 years) |
| On-Board Satellite AI Processing Requirements | +5.9% | Global, led by United States, Europe, China space programs | Medium term (2-4 years) |
| OT-Cybersecurity Anomaly Detection at Network Edge | +4.2% | Global, with early adoption in critical infrastructure sectors | Short term (≤ 2 years) |
| Source: Mordor Intelligence | |||
Rising Edge AI Demand in Consumer and Automotive
Smartphone and wearable brands now embed always-on inference engines to enable voice wake-words, gesture control, and wellness analytics without draining batteries. Qualcomm’s Snapdragon platforms integrate event-driven neural engines that maintain real-time responsiveness at 10 milliwatts or less, setting a benchmark that traditional DSPs cannot reach. Automotive suppliers are redesigning domain controllers around spiking neural networks that fuse radar, lidar, and camera streams with sub-10-millisecond latency. BrainChip’s Akida core meets ISO 26262 functional-safety targets in in-cabin monitoring, proving that the neuromorphic chip market can satisfy both compute and safety requirements. As vehicles transition toward software-defined architectures, over-the-air updates intensify demand for re-configurable, ultra-low-power accelerators.
Datacenter Energy Crisis Favoring Ultra-Low-Power Compute
Large language model training already consumes megawatt-hours, and inference volumes grow even faster. Intel Laboratories showed that analog in-memory compute reduces multiply-accumulate energy by three orders of magnitude.[1]Intel Corporation, “Intel Unveils Loihi 2, Second-Generation Neuromorphic Research Chip,” Newsroom, intel.com IBM phase-change prototypes run synaptic operations at 10 picojoules, enabling petaflop-class racks within 1 kilowatt budgets. Regulatory pressure through voluntary carbon disclosure and efficiency certifications nudges operators toward chips that minimize joules per inference. As electricity rates rise and renewable-energy quotas tighten, data centers view the neuromorphic chip market as a direct path to capex savings in power and cooling infrastructure.
Government Brain-Inspired R&D Programs
IARPA’s MICrONS program allocated more than USD 100 million to map cortical micro-circuits and publish open-source datasets.[2]Intelligence Advanced Research Projects Activity, “Machine Intelligence from Cortical Networks (MICrONS) Program,” iarpa.gov The European Union’s Human Brain Project invested EUR 600 million (USD 678 million) over ten years to advance digital brain models and neuromorphic platforms. China’s 14th Five-Year Plan lists brain-inspired computing as a strategic technology priority, channeling state funds toward domestic foundries and IP providers. Such programs compress laboratory-to-market cycles and create a pipeline of graduates proficient in spiking neural network algorithms, enlarging the talent pool essential for scaling the neuromorphic chip market.
Expansion of Autonomous Vehicle Domain Controller Architectures
To consolidate dozens of electronic control units, automakers are migrating toward centralized domain controllers that require sub-10-watt AI accelerators. Prophesee event-based vision sensors reduce data throughput by two orders of magnitude, aligning perfectly with spiking neural networks.[3]Prophesee SA, “Event-Based Vision Sensors for Neuromorphic Computing,” prophesee.ai Tier-one suppliers are piloting neuromorphic co-processors that enable object tracking at 5 watts, extending battery range in electric cars. Pilot programs point to Level 3 rollouts in 2027, giving the neuromorphic chip market a clear automotive revenue stream as autonomy scales.
Restraints Impact Analysis of Neuromorphic Chip Market*
| Restraint | (~) % Impact on CAGR Forecast | Geographic Relevance | Impact Timeline |
|---|---|---|---|
| Immature Software and Toolchain Ecosystem | -6.8% | Global | Medium term (2-4 years) |
| Fabrication Variability of Analog NVM | -4.3% | Global, concentrated in leading-edge foundries | Medium term (2-4 years) |
| Lack of Spike-System Test and Validation Standards | -3.1% | Global | Long term (≥ 4 years) |
| Unclear Medical-Device Regulatory Path | -2.4% | North America, Europe | Long term (≥ 4 years) |
| Source: Mordor Intelligence | |||
Immature Software and Toolchain Ecosystem
Enterprises encounter fragmented frameworks in which converting a convolutional network into spikes requires manual tuning of time constants and encoders, often degrading accuracy. Intel Lava and BrainChip MetaTF ease migration, yet neither supports the full layer diversity data scientists expect. The absence of benchmarks means vendors publish power claims under different workloads, complicating ROI analysis. Development teams must maintain parallel codebases for GPUs and neuromorphic targets, which stretch budgets and extend project timelines. This gap slows procurement and dampens initial enthusiasm inside otherwise receptive organizations.
Fabrication Variability of Analog NVM
ReRAM and phase-change synapses drift by 10% or more across cycles, hurting inference accuracy. Write-verify loops help but raise programming energy, cutting into the headline efficiency of analog compute. Foundries still lack mature process-design kits, forcing designers to sponsor characterization wafers that drive up non-recurring engineering costs. Mixed-signal automatic test equipment extends fab-floor cycles, raising unit cost and limiting the neuromorphic chip market to use cases that tolerate modest accuracy loss or pay for error-correcting redundancy.
*Our forecasts treat driver/restraint impacts as directional, not additive. The impact forecasts reflect baseline growth, mix effects, and variable interactions.
Neuromorphic Chip Market Segment Analysis
By Chip Type:
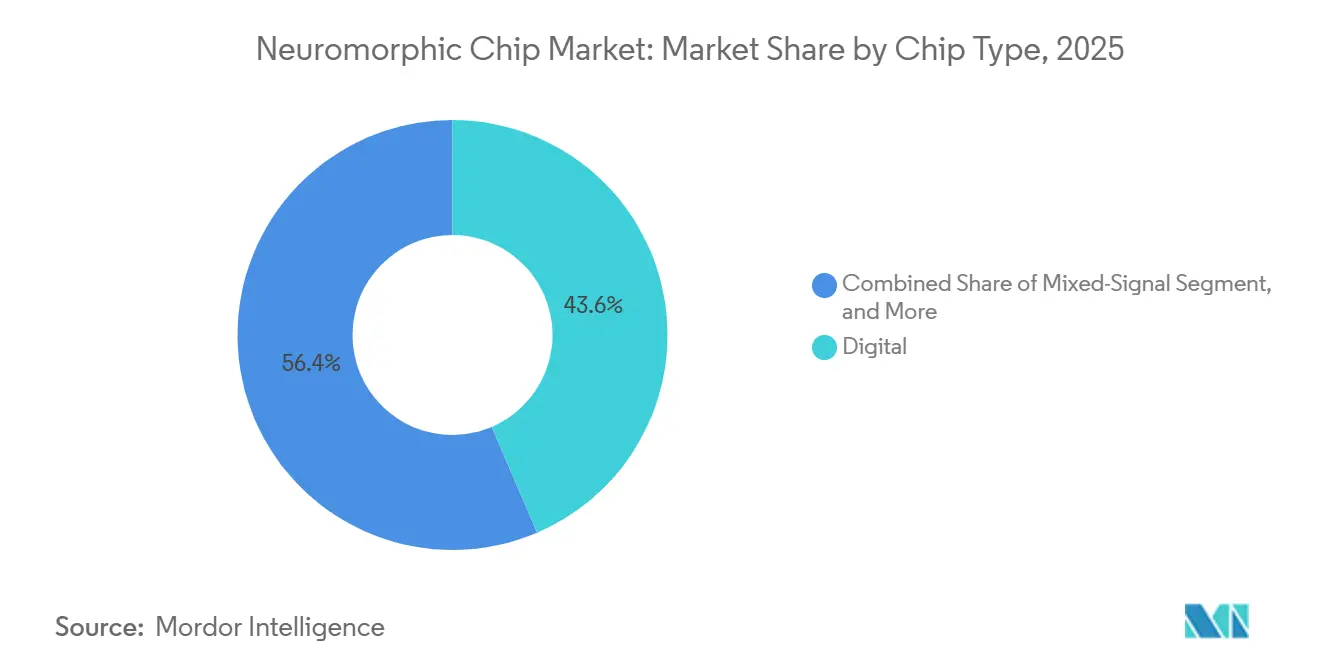
Mixed-Signal Architectures Gain TractionMixed-signal devices are forecast to grow at 52.19%, beating the 51.57% baseline. In 2025, digital processors held a 43.56% share of the neuromorphic chip market, reflecting corporate comfort with deterministic control and rich software stacks. Intel Loihi 2 packs 1 billion synapses in a fully asynchronous digital mesh programmable through Python. Analog crossbars deliver a 100-fold energy edge but struggle with device drift. Mixed-signal chips layer digital control on analog synapses, harvesting the bulk of the efficiency without surrendering programmability. The segment thrives on mature 28-nanometer nodes that cost less to tape-out, giving startups a capital-light path to silicon.
The neuromorphic chip industry recognizes that pure analog prototypes require leading-edge nodes where yield penalties mount. By contrast, mixed-signal layouts tolerate larger transistors and relaxed matching rules. Innatera’s Spiking Neural Processor is taped out on 40-nanometer CMOS yet beats digital rivals on microwatt wake-word detection. As edge OEMs demand annual feature upgrades, mixed-signal chips provide firmware-flexible neurons alongside resistor crossbars, anchoring long-term design wins across consumer and automotive lines.



By Architecture:
ReRAM-Based Designs Lead InnovationReRAM architectures captured 23.67% of the neuromorphic chip market in 2025 and should grow at 52.11% through 2031, aided by seamless back-end-of-line integration with standard copper interconnects. ReRAM crossbars support multi-level cells, increasing synaptic density without enlarging die area. IBM phase-change memory remains a credible alternative, posting 1 million endurance cycles and nanosecond writes. Yet ReRAM’s lower formation temperature and simpler materials stack drive lower wafer cost, a decisive lever in smartphone-scale volumes.
Event-driven spiking neural networks amplify ReRAM benefits through sparse activation. Every inactive synapse draws virtually no current, driving system-level power toward the microwatt floor. Prophesee sensors supply asynchronous spikes that map directly onto these arrays, eliminating frame-based overhead. Over the forecast, roadmaps show ReRAM arrays paired with digital neuron controllers in mobile SoCs, a step that positions the neuromorphic chip market size for consumer electronics to jump once Samsung and SK hynix integrate the blocks natively.
By End-User Industry:
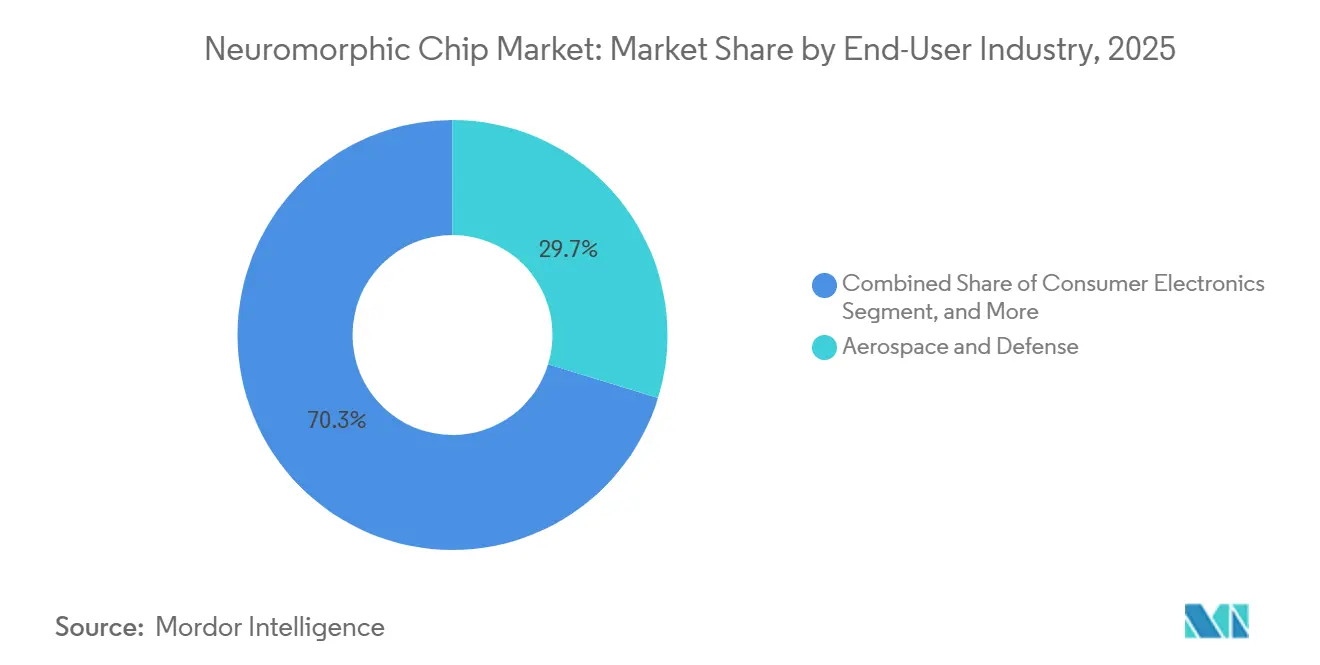
Consumer Electronics Surge AheadConsumer electronics is projected to post a 52.66% CAGR, the fastest among verticals, as smartphone OEMs chase always-on voice and vision without battery penalties. Devices like earbuds and smartwatches already use sub-1-milliwatt keyword engines, and augmented-reality glasses entering mass production in 2027 will require scene understanding at or below 5 milliwatts. Aerospace and defense accounted for 29.73% of the neuromorphic chip market in 2025, driven by satellites where downlink latency is unacceptable. Radiation tolerance research under U.S. Space Force contracts shows spiking neural networks retaining accuracy after 100 krad exposures.
Industrial IoT follows with predictive maintenance nodes that learn on-device, avoiding plant network bottlenecks. Healthcare pilots explore seizure prediction and prosthetic control but face lengthy regulatory cycles. Automotive OEMs integrate event-driven chips for driver monitoring and side-mirror replacement cameras, banking on 5-watt thermal envelopes that preserve electric-vehicle range. As use-case diversity widens, no single architecture will dominate, protecting a fragmented yet vibrant neuromorphic chip market.
By Deployment Model:
Edge Devices DominateEdge deployments accounted for 59.47% of revenue in 2025 and will grow by 51.93%, reflecting the cost of transmitting raw sensor data to centralized clouds. Syntiant's NDP120 runs keyword spotting at below 1 milliwatt, enabling manufacturers to achieve multi-year coin-cell lifetimes. Under GDPR rules, the European Union has become a notable proponent of on-device inference. This trend is largely driven by stringent privacy regulations, which prioritize data security by minimizing the transfer of sensitive information to external servers and promoting local data processing.
While GPUs remain entrenched for training, inference counts dwarf training cycles, and moving those cycles local slashes latency from 100 milliseconds to microseconds. Cloud providers are still testing neuromorphic accelerators at edge colocation sites, pairing them with GPUs for retraining. This hybrid splits workloads so that the neuromorphic chip market captures latency-critical inference while hyperscale infrastructure retains batch training, optimizing total cost of ownership for operators.
Geography Analysis
North America Neuromorphic Chip Market
North America led the neuromorphic chip market with 39.31% in 2025, buoyed by IARPA, NSF, and Department of Energy grants that subsidize early silicon. Intel co-developed Loihi generations with Sandia National Laboratories, moving quickly from academic prototypes to datacenter pilots. Canada’s Vector Institute and Mila deliver algorithmic breakthroughs that feed directly into commercial toolchains, while Mexico’s rising contract-manufacturing sector offers near-shore assembly capacity. The region’s vertically integrated ecosystem, from materials research to system integration, creates resilience but faces competition from the Asia Pacific's manufacturing scale.
APAC Neuromorphic Chip Market
Asia Pacific is forecast to grow at 52.49% through 2031, driven by China’s sovereign AI mandate, Japan’s robotics cluster, and South Korea’s memory leadership. China’s 14th Five-Year Plan funds centers like Tsinghua’s Brain-Inspired Computing Lab, which tape out domestic spiking-network processors on 14-nanometer lines. Japan’s NEDO backs neuromorphic co-processors for humanoid robots, while Samsung and SK Hynix integrate ReRAM crossbars into flagship mobile SoCs. India lures assembly and test operations under its Production Linked Incentive scheme, although design IP largely remains overseas.
EMEA Neuromorphic Chip Market
Europe, the Middle East, and Africa, though smaller in revenue, punch above their weight in academic output. The Human Brain Project published over 1,000 articles on cortical simulation and memristive synapses. German automotive suppliers pilot spiking chips for L3 autonomy, and U.K. graphene labs explore two-dimensional synapses for microwatt devices. Middle Eastern smart-city initiatives demand low-power analytics under harsh climates, carving a specialized niche. South African miners test predictive-maintenance sensors that learn underground, where connectivity is sparse. The spread of design, fabrication, and application hubs underscores the global interdependencies shaping the neuromorphic chip market.

Regulatory Landscape
Neuromorphic chips sit within broader semiconductor, AI, and security regimes, so compliance is shaped less by neuromorphic-specific rules and more by controls on advanced computing items, procurement disclosure, and industrial policy. In the United States, the Department of Commerce Bureau of Industry and Security revised export license review policy for advanced computing commodities effective January 15, 2026, tightening how certain AI-related ICs are reviewed for export. A Section 232 presidential action in January 2026 also addressed imports of semiconductors and semiconductor manufacturing equipment, reinforcing the role of trade measures in supply-chain planning for companies sourcing wafers, packaging, or IP across borders.
In Europe, semiconductor policy is a direct catalyst for neuromorphic R&D and pilot manufacturing. The European Commission advanced a 2026 proposal commonly referred to as Chips Act 2.0 (Chips for Europe Initiative 2.0) to strengthen the regional semiconductor ecosystem across design, production, and systems integration, creating additional public support pathways for next-generation architectures relevant to neuromorphic computing. Separately, government-backed ecosystem building also shapes compliance and commercialization readiness. In April 2026, a Netherlands-based 30 million euro consortium project involving TU Eindhoven, TNO, and industry partners such as Infineon and Synopsys launched to build shared infrastructure and an industry-driven neuromorphic technology pipeline.
Value Chain Analysis
The neuromorphic chip value chain starts with algorithm and toolchain development (spiking neural networks, compilers, and deployment frameworks such as Intel Lava and BrainChip MetaTF), then moves into IP blocks, chip architecture design (digital, analog, and mixed-signal), and integration of novel memory and synaptic devices (ReRAM and phase-change variants, plus emerging device classes reported in academic literature). Early commercialization often leans on standard CMOS nodes for fabrication, while back-end-of-line and device-agnostic interfaces are used to attach memristive elements and other beyond-CMOS devices to conventional flows. This approach helps vendors progress from lab-scale prototypes to tape-outs that can be packaged for edge modules or embedded into larger SoCs.
Downstream, system integrators and application partners influence qualification and volume pull-through, especially in defense, industrial automation, and machine vision. The chain is increasingly partnership-led: Prophesee partnered with Eoptic in January 2025 to integrate event-based Metavision sensors into imaging platforms, tightening the sensor-to-processor interoperability loop for spiking workloads. BrainChip partnered with RTX/Raytheon in April 2025 on an AFRL radar contract and later signed a strategic partnership with Parsons in October 2025 to integrate Akida into edge-AI defense platforms, showing how primes and integrators serve as routes to deployment. Regional commercialization channels are also expanding through structures such as the May 2025 joint venture between Kumrah AI and SynSense (iniVation) to develop neuromorphic vision-based inspection and autonomy systems for the MENA region, bringing distribution, solution engineering, and sector certifications alongside silicon and software.
Competitive Landscape
The neuromorphic chip market remains moderately concentrated. Incumbent giants Intel, IBM, Qualcomm, and Samsung can absorb R&D costs across product lines, accelerate tape-outs through preferred foundry slots, and bundle neuromorphic cores with established IP. Intel embeds Loihi learnings into edge AI ASICs, enhancing software reuse. Samsung discloses a 5-nanometer ReRAM prototype delivering 10 TOPS at 2 watts, a pipeline feature for 2027 flagship phones.
Venture-backed specialists carve beachheads in niches that value microwatt power or on-device learning. BrainChip has design wins in drowsiness detection, while Innatera partners with European robotics firms to develop autonomous factory carts. Syntiant ships millions of neural decision processors into earbuds, turning volume shipments into an iterative process of silicon refinement. Prophesee monetizes event-based sensors that pair exclusively with spiking networks, locking in pull-through demand for compatible processing cores.
Barriers to entry lie in software maturity and IP thickets. More than 500 neuromorphic patents were granted by the USPTO during 2024-2025, signaling an arms race for foundational claims. Absent benchmarks fragment the buyer base, letting vendors differentiate on custom workloads. Strategic risk centers on analog NVM yields; until fabs hit Six-Sigma uniformity, larger OEMs hedge with mixed-signal or digital options. Despite headwinds, company announcements in 2025 show a clear trajectory toward commercial scale, moving the neuromorphic chip market beyond proof-of-concept.
Neuromorphic Chip Industry Leaders
Intel Corporation
International Business Machines Corporation
Samsung Electronics Co., Ltd.
SK hynix Inc.
GrAI Matter Labs SAS
- *Disclaimer: Major Players sorted in no particular order
Neuromorphic Chip Market Companies Covered in this Report
- Intel Corporation
- International Business Machines Corporation
- Samsung Electronics Co., Ltd.
- SK hynix Inc.
- BrainChip Holdings Ltd
- SynSense AG
- GrAI Matter Labs SAS
- Nepes Corporation
- Qualcomm Technologies, Inc.
- Micron Technology, Inc.
- Synaptics Incorporated
- Innatera Nanosystems BV
- Prophesee SA
- MemryX Inc.
- Mythic Inc.
- Syntiant Corp.
- Gyrfalcon Technology Inc.
- Applied Brain Research Inc.
- General Vision Inc.
- Vicarious Corp.

Market Opportunities and Future Outlook
A primary near-term opportunity is converting neuromorphic designs from evaluation programs into repeatable production supply and turnkey reference platforms that reduce integration time for OEMs. BrainChip announced commercial availability and production shipments of the Akida AKD1500 in June 2026, produced on GlobalFoundries 22nm FDX, which expands the addressable customer base beyond R&D labs toward product teams that require stable part numbers, manufacturing continuity, and an ecosystem of modules and software. Partnerships also matter for go-to-market expansion, such as BrainChip ecosystem agreements supporting deployment channels in Asia, creating room for design services, IP licensing, and application-specific enablement packages. This is most relevant in wearables, industrial sensing, and defense edge systems where sustained, sub-watt inference is a gating requirement.
A second opportunity area is neuromorphic compute moving closer to memory and aligned with mainstream packaging roadmaps, reducing the data-movement penalty that constrains conventional accelerators. Research activity around neuromorphic capability integrated into memory stacks (such as the NeuroHBM concept described in 2026 research involving SK hynix and Seoul National University) and analog/in-memory compute demonstrations broadens adoption paths without requiring a full replacement of existing AI infrastructure. On the policy and funding side, sovereign semiconductor initiatives provide additional commercialization runway. South Korea initiated a public-private AI semiconductor plan spanning 2024-2030 that includes explicit support for neuromorphic architectures, and the Netherlands launched a 30 million euro neuromorphic ecosystem project in April 2026 involving TU Eindhoven, TNO, and industry partners, reinforcing Europe and Asia Pacific as active hubs for prototypes, shared infrastructure, and talent pipelines tied to deployable hardware.
Recent Industry Developments in Neuromorphic Chip Market
- July 2026: SK hynix expanded a joint technology collaboration with TetraMem to advance an analog in-memory computing (A-IMC) SoC. The expanded program aims to align neuromorphic workload performance with memory-centric AI platform roadmaps, signaling a shift toward integrated memory-compute approaches in neuromorphic workflows.
- June 2026: BrainChip announced commercial availability and production shipments of the Akida AKD1500 neuromorphic processors, manufactured on GlobalFoundries 22nm FDX technology. Moving from announcements to production shipments improves supplier credibility for OEM programs that require repeatable sourcing, qualification, and lifecycle planning.
- May 2026: BrainChip entered an IP distribution license agreement with ASICLAND to enable integration of Akida neuromorphic AI IP into custom chip designs. The licensing route broadens adoption beyond standalone processors by allowing SoC builders to embed neuromorphic capability alongside standard compute and connectivity blocks.


Neuromorphic Chip Market Report Scope and Research Methodology
Market Definition and Coverage
For this study, the market is defined as revenue generated from neuromorphic chips sold for edge and data center use, where the hardware is designed to run brain-inspired, event-driven computing (such as spiking neural networks).
Scope exclusions: We exclude stand-alone software, services, and general AI accelerators that are not purpose-built as neuromorphic chips.
Segments Covered in This Report
- By Chip Type
- Analog
- Digital
- Mixed-Signal
- By Architecture
- Spiking Neural Network
- ReRAM-Based Architectures
- Phase-Change-Memory Architectures
- By End-User Industry
- Automotive (ADAS / AV)
- Industrial IoT and Robotics
- Consumer Electronics
- Financial Services and Cybersecurity
- Healthcare and Medical Devices
- Aerospace and Defense
- By Deployment Model
- Edge Devices
- Data-Centre / Cloud
- By Geography
- North America
- United States
- Canada
- Mexico
- South America
- Brazil
- Argentina
- Rest of South America
- Europe
- United Kingdom
- Germany
- France
- Italy
- Rest of Europe
- Asia Pacific
- China
- Japan
- India
- South Korea
- Rest of Asia Pacific
- Middle East and Africa
- Middle East
- United Arab Emirates
- Saudi Arabia
- Rest of Middle East
- Africa
- South Africa
- Egypt
- Rest of Africa
- Middle East
- North America
Data Sources, Market Sizing, and Validation
Desk Research
Desk research was used to set the outer frame for the model and to reduce reliance on assumptions in a vacuum. We relied on public, checkable sources such as semiconductor trade statistics from UN Comtrade, macro and pricing series from the World Bank, standards and roadmaps from IEEE, and research publications indexed on sources like IEEE Xplore and NIST references for AI and compute benchmarks.
To link demand with shipments, we also reviewed materials such as company annual reports, earnings decks, product briefs, and credible press coverage about edge AI deployments. Patent databases were used to gauge where activity is moving across neuromorphic architectures and memory approaches, and an approved paid subscription for company financials and news helped validate timelines and commercialization signals. The sources listed here are illustrative only, and many other public and paid references were also used during data collection, validation, and clarification steps.
Primary Interviews and Surveys
Primary work focused on translating technical adoption stories into sizing inputs that can be modeled, such as likely unit volumes, pricing bands, and which end uses are moving from pilots to production. We spoke with a mix of chip ecosystem participants and downstream users across APAC, EMEA, and the Americas, which helped us confirm deployment patterns for edge devices versus data center use and stress-test the assumed ramp curves.
Distribution of primary research fieldwork respondents
| Company type | Respondent position | Region |
|---|---|---|
| Top tier: 34% | CXOs: 12% | APAC: 47% |
| Mid tier: 52% | Functional/Unit leaders: 28% | EMEA: 31% |
| Smaller Players: 14% | Managers: 60% | Americas: 22% |
Market-Sizing & Forecasting
Sizing started with a top-down build where the demand pool was reconstructed from end-use adoption of edge AI and always-on sensing, then converted into chip value using realistic attach rates and price bands. To keep the totals grounded, selective bottom-up approximations were also used, such as rolling up a sample of supplier revenues, doing channel checks on design win intensity, and validating implied average selling prices multiplied by expected volumes for key use cases.
A few inputs that drove the model were the pace of edge AI device shipments, the share of workloads suited to event-driven compute, expected architecture mix shifts (analog, digital, and mixed-signal), memory-technology direction (such as ReRAM and phase-change memory), and the split between edge devices and data center deployments. Where direct unit data was thin, gaps were handled by using scenario-based ranges for penetration and pricing, then narrowing those ranges after interviews. Forecasts were produced using scenario analysis supported by a light multivariate regression check on drivers such as edge-device growth, AI hardware spend direction, and commercialization timing shared by experts.
Data Validation & Update Cycle
Model outputs were triangulated against independent signals, including implied unit volumes, pricing sanity checks, and whether regional adoption patterns line up with observed product launches and deployment announcements. Variances were reviewed in multiple analyst passes, and outliers triggered follow-up calls, so the final numbers did not depend on a single viewpoint.
The report is refreshed annually, with interim updates when material events change pricing, supply availability, or the adoption outlook. Before delivery, the model is rechecked with a fresh data pass so clients receive an updated view aligned with the latest publicly visible market signals.
Mordor Intelligence's Neuromorphic Chip Market Sizing Compared With Other Published Estimates
It is common to see different market sizes for neuromorphic chips because publishers do not always count the same revenue streams, the same deployment settings, or the same commercialization timing. Differences also show up when pricing assumptions are carried forward too aggressively, or when a forecast starts from a pilot-heavy year without adjusting for what is truly in production.
Key gaps usually come from scope and counting logic. Some estimates fold software platforms, services, or broader neuromorphic computing into the same total, while others stay strictly with chip hardware revenue and apply tighter rules around edge versus data center inclusion, pricing bands, and currency timing for conversions.
Benchmark comparison
| Source | Market Size | Gaps in Research Methodology |
|---|---|---|
| Mordor Intelligence | USD 0.51 B (2026) | |
| Global Consultancy A | USD 0.13 B (2026) | Uses a narrower commercialization lens, counting mainly early shipment volumes and conservative pricing for near-term deployments, which compresses the 2026 value. |
| Regional Consultancy B | USD 0.18 B (2025) | Blends a different base year and applies a faster near-term ramp from pilots to production, which can lift the starting point even before broader deployment is visible. |
The spread is mostly explained by what gets counted as commercial chip revenue, how quickly pilots are assumed to convert into repeat shipments, and how pricing is carried forward as volumes scale. By keeping the total tied to deployment split checks (edge devices versus data center) and architecture-level adoption signals, the estimate stays traceable to repeatable inputs and updateable steps, which is the approach used by Mordor Intelligence.


Key Questions Answered in the Report
How large will the neuromorphic chip market become by 2031?
The neuromorphic chip market is forecast to reach USD 4.08 billion by 2031 on a 51.57% CAGR from 2026.
Which segment grows fastest inside the neuromorphic chip space?
Mixed-signal chips are projected to post a 52.19% CAGR, outpacing other chip types through 2031.
Why are edge devices the main deployment venue?
Edge nodes avoid cloud latency and bandwidth fees; event-driven computation lets neuromorphic chips run sub-1 milliwatt workloads for months on battery.
Which region will see the highest growth?
Asia Pacific is set to grow at 52.49%, driven by sovereign AI mandates in China, robotics investment in Japan, and memory leadership in South Korea.
What is the key technical barrier to wider adoption?
Software toolchains remain immature, forcing developers to translate models manually and maintain parallel codebases, which slows commercialization.
How do neuromorphic processors compare to GPUs on energy?
Analog in-memory arrays demonstrate 100-to-1,000-fold lower joules per multiply-accumulate operation, reducing inference racks from megawatts to kilowatts.
Page last updated on:


 Your data is secure and never sold or shared.


