Internet Protocol Television (IPTV) Market Size and Share
Market Overview
| Study Period | 2020 - 2031 |
|---|---|
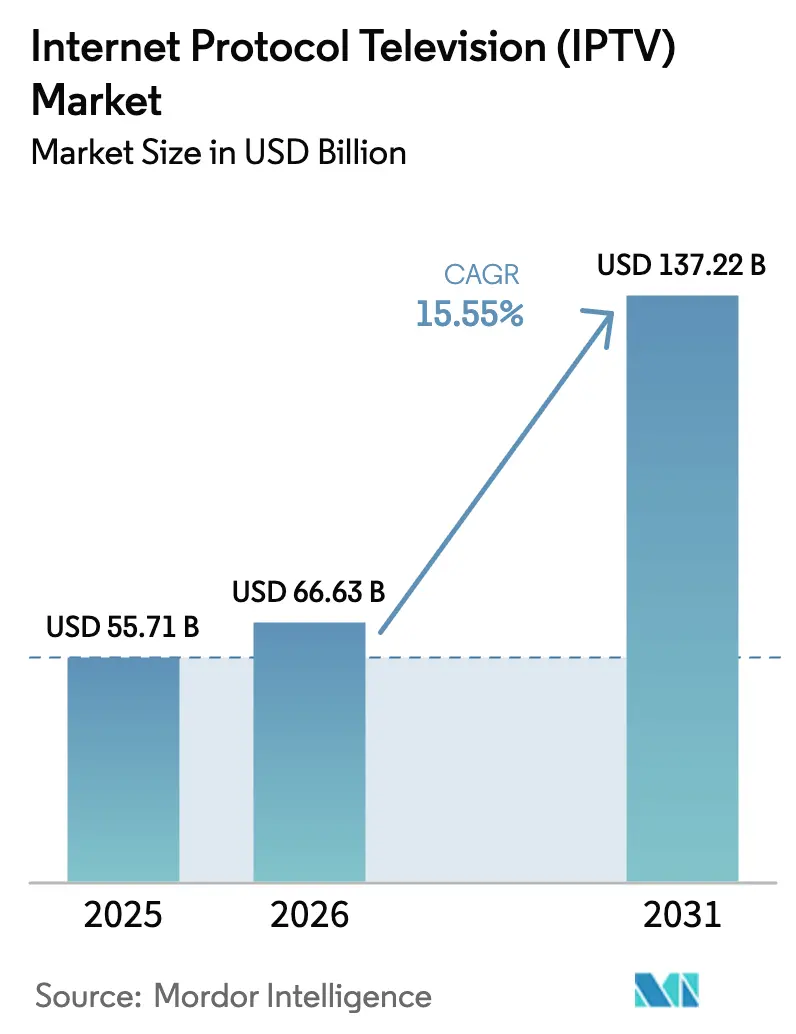
| Market Size (2026) | USD 66.63 Billion |
| Market Size (2031) | USD 137.22 Billion |
| Growth Rate (2026 - 2031) | 15.55% CAGR |
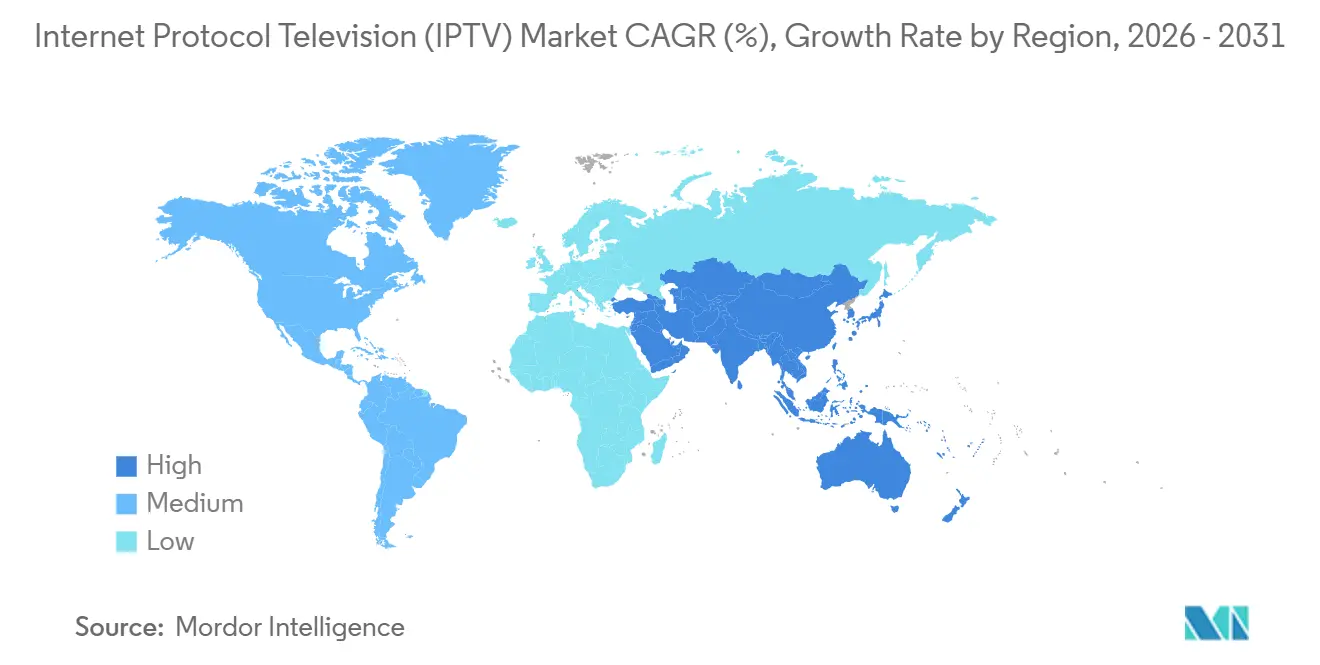
| Fastest Growing Market | Asia Pacific |
| Largest Market | Asia Pacific |
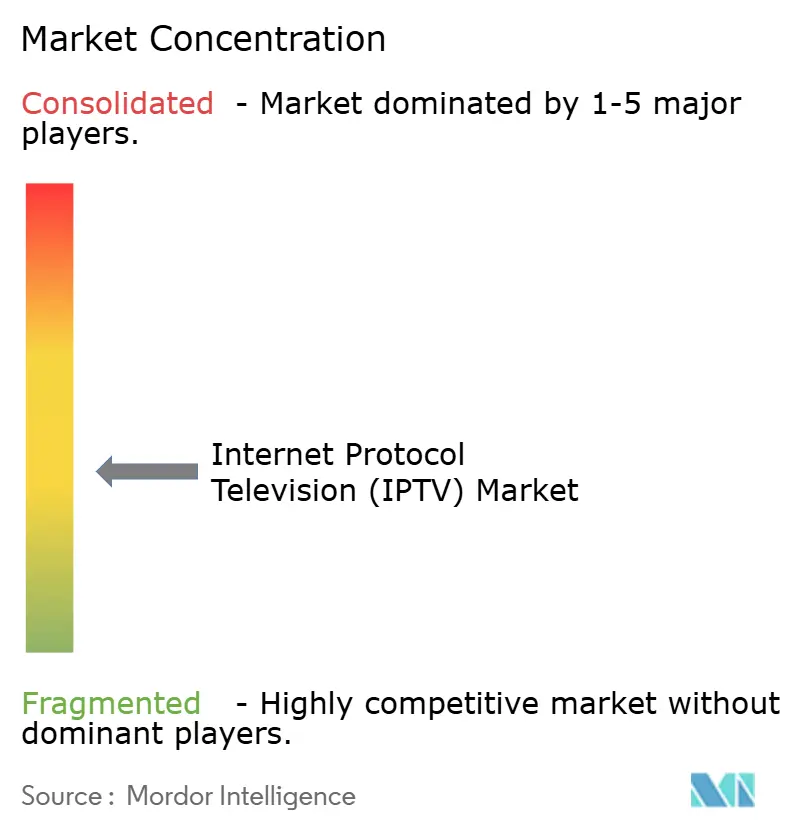
| Market Concentration | Medium |
Major Players *Disclaimer: Major Players sorted in no particular order Image © Mordor Intelligence. Reuse requires attribution under CC BY 4.0. | |
Internet Protocol Television (IPTV) Market Analysis by Mordor Intelligence
The Internet Protocol Television Market size is expected to grow from USD 55.71 billion in 2025 to USD 66.63 billion in 2026 and is forecast to reach USD 137.22 billion by 2031 at 15.55% CAGR over 2026-2031. Fiber rollouts that sustain 4K and 8K streams, telco super-aggregation that re-bundles fragmented apps, and hybrid ad-funded models together keep subscriber additions robust. Operators are redirecting capital from set-top hardware to cloud middleware, while ad buyers shift budgets from linear television to addressable inventory. New broadband households in Asia-Pacific are bypassing satellite and cable entirely, locking in long-term demand for managed IP video. Competitive pressure remains intense because pure-play streaming services avoid infrastructure costs, while incumbents defend their share by marrying IPTV with mobile, voice, and smart-home services under a single monthly bill.
Key Report Takeaways
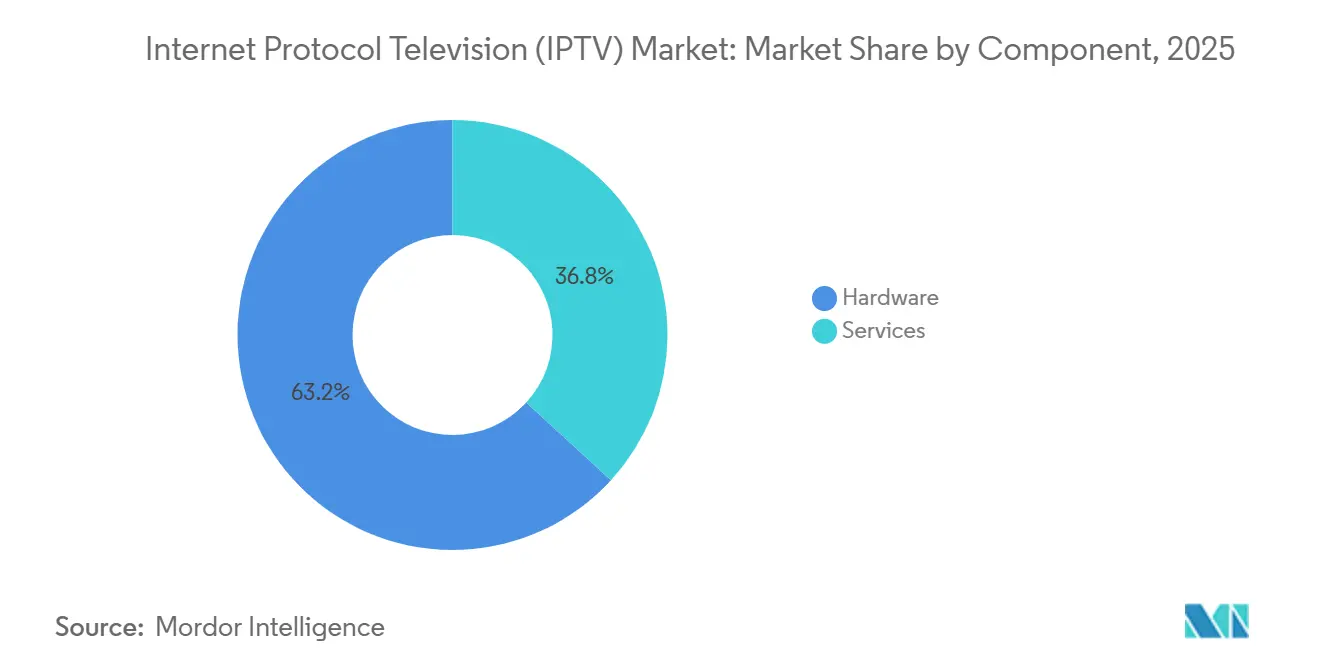
- By component, hardware led with 63.20% of revenue in 2025, while services are advancing at a 15.80% CAGR to 2031.
- By revenue model, subscription tiers accounted for 71.40% in 2025, yet advertising-supported video-on-demand is growing at a 16.3% CAGR.
- By streaming type, live and linear television accounted for 54.60% of revenue in 2025, whereas video-on-demand is expanding at a 15.61% CAGR.
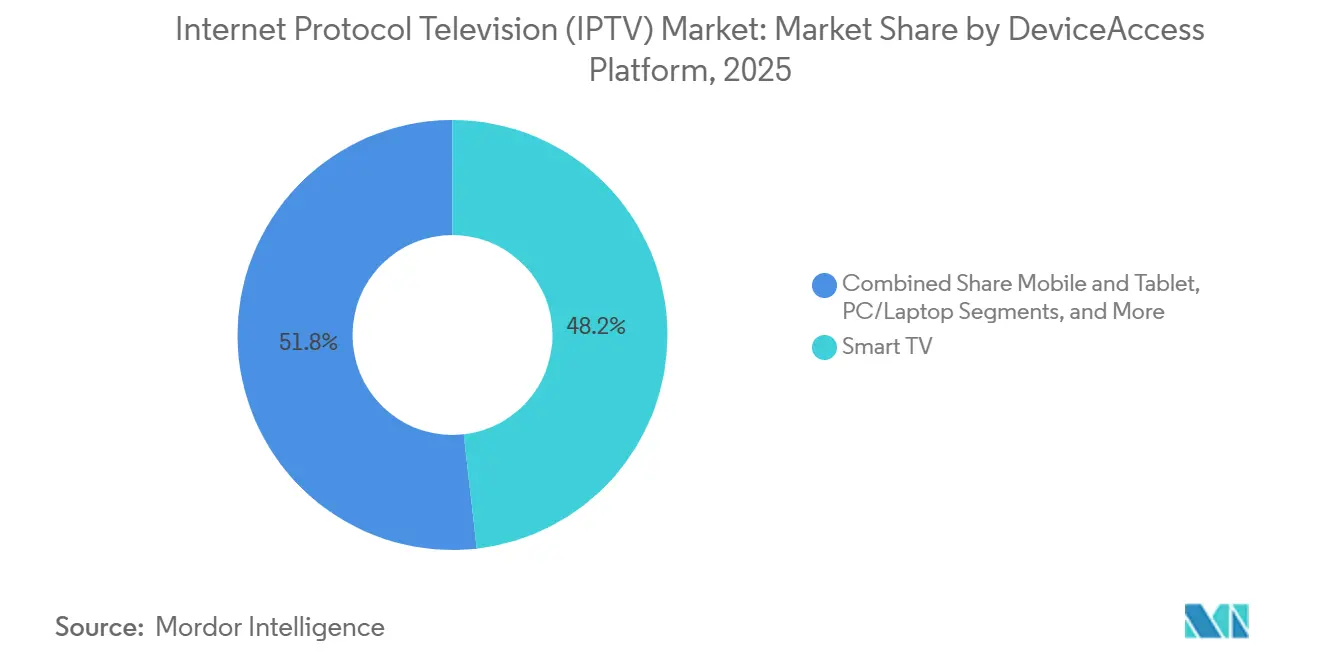
- By device and access platform, smart TVs accounted for 48.20% of revenue in 2025, while mobile and tablet access grew at a 15.71% CAGR.
- By delivery method, multicast accounted for 64.50% of revenue in 2025, but unicast is growing at a 17.4% CAGR.
- By geography, Asia-Pacific accounted for 45.89% of global revenue in 2025 and is the fastest-growing region, with a 16.3% CAGR.
Note: Market size and forecast figures in this report are generated using Mordor Intelligence’s proprietary estimation framework, updated with the latest available data and insights as of January 2026.
Global Internet Protocol Television (IPTV) Market Trends and Insights
Drivers Impact Analysis*
| Driver | (~) % Impact on CAGR Forecast | Geographic Relevance | Impact Timeline |
|---|---|---|---|
| Fiber-to-home rollouts meet 4K and 8K demand | +4.2% | Europe, North America, China, Japan, South Korea | Medium term (2-4 years) |
| Super-aggregation platforms gain traction | +3.1% | Europe and North America, early use in Australia | Short term (≤ 2 years) |
| Telco bundles of IPTV with convergent plans | +3.8% | Asia-Pacific core, spillover to Middle East and Africa | Medium term (2-4 years) |
| AVoD monetization accelerates | +2.9% | Global, led by North America and Europe | Short term (≤ 2 years) |
| Broadband growth in emerging markets | +2.6% | Asia-Pacific | Long term (≥ 4 years) |
| Broadcaster migration to IP delivery | +2.3% | Global, faster in Europe and North America | Medium term (2-4 years) |
| Source: Mordor Intelligence | |||
Fiber-to-Home Rollouts Meet 4K and 8K Demand
Global fiber lines surpassed 600 million by late 2025, creating the throughput headroom needed for data-hungry 4K and 8K streams that consume 25 Mbps and 100 Mbps. Operators now price ultra-high-definition tiers at 30%-50% premiums, adding incremental revenue without proportional marketing spend. Saudi Arabia’s STC used its five-million-home fiber build to launch an 8K sports pack in 2024, and France’s Orange gave new fiber customers 4K boxes at no surcharge, cutting churn[1]Saudi Telecom Company, “Annual Report 2024,” stc.com.sa. By mid-2025, 68% of NTT East and West fiber customers were watching 4K IPTV weekly. Construction is still underway in suburbs and rural areas, so this driver will remain potent in the medium term.
Super-Aggregation Platforms Gain Traction
Unified guides that merge linear channels with Netflix, Disney+, and free ad-supported streams are reversing app fatigue. Viaccess-Orca’s platform served 15 European operators by late 2025, dropping average monthly churn by 18% after rollout. Comcast and Rogers embedded third-party apps in set-top firmware, restoring the discovery layer to the network operator. Deloitte found 42% of U.S. viewers would rather manage content from a single interface, so telcos that offer one are reclaiming subscription economics. Minimal capex needs and rapid software rollout drive its high short-term impact.
Telco Bundles of IPTV With Convergent Plans
China Telecom’s Smart Home bundle combined gigabit fiber, 200-plus channels, and unlimited mobile data for USD 42, adding 8.5 million accounts in nine months of 2025. Reliance Jio’s postpaid fiber plan, paired with gigabit broadband, 14 OTT apps, and four SIM cards, registered 2.3 million adds by mid-2025. South Korea’s KT showed 72% overlap between IPTV and mobile lines, lifting ARPU by 23%. Bundling locks households into multi-year contracts, offsets pure-play OTT churn, and will influence the internet protocol television market through the medium term.
AVoD Monetization Accelerates
Comscore measured 22% annual growth in ad-supported viewing hours in 2024, dwarfing 6% growth for subscription hours. The Interactive Advertising Bureau projected U.S. connected-TV ad spend of USD 29.5 billion for 2025, with addressable IPTV inventory capturing a growing share. Deutsche Telekom and Orange each launched free, ad-supported IPTV tiers in late 2024 and together attracted 3.8 million viewers by mid-2025. Programmatic ad insertion from vendors such as Akamai increased ad fill rates by 35% by dynamically matching creative with household data. Early revenue traction validates AVoD as a near-term growth lever.
Restraints Impact Analysis*
| Restraint | (~) % Impact on CAGR Forecast | Geographic Relevance | Impact Timeline |
|---|---|---|---|
| Cord-cutting toward pure OTT | -2.8% | North America and Europe, emerging in Australia and Japan | Short term (≤ 2 years) |
| Unicast bottlenecks in peak sports events | -1.6% | Global, acute where CDN capacity is thin | Medium term (2-4 years) |
| Regulatory fragmentation for rights | -1.4% | Europe, cross-border Africa and Middle East | Long term (≥ 4 years) |
| Piracy via illegal IPTV panels | -1.9% | Europe, Southeast Asia, South America | Medium term (2-4 years) |
| Source: Mordor Intelligence | |||
Persistent Cord-Cutting Toward Pure OTT Services
U.S. pay-TV providers lost 5.9 million subscribers in 2024, dropping the base below 70 million for the first time in decades[2]. Ofcom reported 1.4 million fewer traditional TV homes in the United Kingdom that year, while streaming-only households hit 62%[3]Ofcom, “Media Nations Report 2024,” ofcom.org.uk. Ampere Analysis showed a 3.2% decline in European pay-TV subscribers, with Spain and Italy hardest hit[4]Ampere Analysis, “European Pay-TV Trends 2024,” ampereanalysis.com. IPTV operators now fight not just cable but also agile direct-to-consumer services that outspend them on original content. The restraint bites hardest in the short term in mature regions, pushing operators to emphasize exclusive sports, convergent bundles, and superior customer support.
Unicast Bandwidth Bottlenecks During Peak Sporting Events
Akamai logged 18.7 million concurrent UEFA 2024 Championship streams, forcing adaptive bit-rate downgrades for 22% of viewers as edge servers saturated. Cloudflare reports that large live events exceed provisioned capacity by up to 50% during early minutes, prompting resolution drops. Multicast can carry one stream to many viewers, but most operators rely on unicast for personalized ads and DVR, so bandwidth scales linearly with audience size. Edge node densification and CDN peering deals are underway, yet they demand multiple budget cycles, making this a medium-term restraint for the Internet Protocol Television market.
*Our forecasts treat driver/restraint impacts as directional, not additive. The impact forecasts reflect baseline growth, mix effects, and variable interactions.
Segment Analysis
By Component: Services Gain as Operators Outsource Complexity
Hardware generated 63.20% of revenue in 2025, driven by set-top boxes, middleware servers, encoders, and conditional-access hardware. Services revenue, however, is climbing at 15.80% CAGR, reflecting operator preference for opex-friendly managed platforms. The Internet Protocol Television market size for services is projected to expand as operators license cloud middleware from Ericsson, Cisco, and Huawei, enabling weekly feature rollouts without truck rolls. Managed services also cover 24-hour monitoring, fault remediation, and analytics, shielding smaller telcos from skill shortages.
Set-top shipments are sliding because Samsung and LG smart-TV operating systems run IPTV apps natively, while middleware license fees rise as operators shift from perpetual to subscription contracts. Transmission equipment upgrades to HEVC and AV1 cut 4K bandwidth by 40%, letting operators add channels inside existing CDN budgets. Conditional access is moving from USB dongles to cloud key servers that secure streams on any device. Integration projects around IP multicast and unicast coexistence keep consulting pipelines full, pushing services toward a larger slice of the Internet Protocol Television market share over the forecast horizon.


By Revenue Model: Advertising-Supported Tiers Reshape Monetization
Subscription packages accounted for 71.40% of revenue in 2025, driven by live sports and bundled OTT offers. Advertising-supported video-on-demand is growing at 16.3% CAGR and will add clear scale because cost-sensitive households opt for free tiers with four to six minutes of ads per hour. The internet protocol television market size for AVoD is widening in regions where average incomes lag, notably India, Brazil, and Indonesia. Operators overlay addressable ads that target household demographics, tripling CPMs relative to broadcast television.
Pay-per-view is slipping as combat sports and concerts migrate to subscription or AVoD bundles. A significant number of U.S. viewers canceled at least one paid service in the past year due to wallet strain, so hybrid models that pair small fees with lighter ad loads are gaining favor. Unified ad platforms from Akamai and Broadpeak stitch programmatic demand into live and on-demand feeds, boosting sell-through rates and keeping operators active in the internet protocol television market's digital ad value chain.
By Streaming Type: Video-on-Demand Becomes Default
Live and linear television still delivered 54.60% of streaming revenue in 2025, thanks to sports and news. Yet video-on-demand is advancing at 15.61% CAGR as consumers migrate to asynchronous viewing patterns. Boston Consulting Group tracked a 12-minute daily decline in live viewing against an 18-minute rise in on-demand across Europe between 2022 and 2024. Operators support this shift with cloud DVR that offers unlimited storage and playback across devices, turning time-shifting into an embedded feature.
Sports remain the redoubt of live viewing, as 92% of UEFA 2024 Champions League streams were consumed in real time. Even so, highlights, condensed replays, and personalized clip compilations grow quickly among younger viewers. Expanded back catalogs from Telefónica and Vodafone fill VOD libraries at lower content-acquisition costs, giving telcos an advantage over cash-burning pure-play streamers. Personalized recommendations lift watch time, bolstering retention in the internet protocol television market.
By Device and Access Platform: Mobile Surges on 5G and Edge Computing
Smart TVs earned 48.20% of device revenue in 2025, aided by 220 million shipments that year, 85% of which supported 4K and native IPTV apps. Mobile and tablet viewing is rising at 15.71% CAGR because 5G network slicing delivers stable throughput and edge caching drops latency under 10 milliseconds. The internet protocol television market size for mobile viewing expands as 5G subscriptions hit 1.9 billion globally by mid-2025.
PC and laptop screens serve travelers and students, while legacy set-top boxes taper off as app-based delivery dominates. Operators allow up to five concurrent screens per household, monetizing convenience without bandwidth penalties. In commuter-dense markets like Japan, South Korea, and Singapore, operators throttle resolution intelligently to avoid data caps, further encouraging mobile usage. The trend keeps IPTV relevant outside the living room, underpinning broader internet protocol television market growth.

By Delivery Method: Unicast Grows Despite Bandwidth Challenges
Multicast handled 64.50% of revenue in 2025 thanks to bandwidth efficiency for live channels. Unicast revenue is growing at 17.4% CAGR because individual streams enable targeted ads and on-demand experiences that consumers now expect. Cisco and Huawei platforms toggle between multicast and unicast based on real-time audience data, optimizing backbone loads. The Internet Protocol Television market share for unicast will rise even though capacity expansions are costly.
Legacy routers often lack IGMP snooping, so operators must upgrade edge gear to maintain video quality. CDNs add value here; Akamai Adaptive Media Delivery and Cloudflare Stream pre-cache popular titles at the edge, slicing latency and smoothing peak demand. Hybrid multicast-unicast networks will dominate, letting operators preserve spectral efficiency for mass events while satisfying personalized consumption.
Geography Analysis
Asia-Pacific accounted for 45.89% of global revenue in 2025 and is expected to grow at a 16.3% CAGR from 2026 to 2031, led by 380 million Chinese IPTV subscriptions and rapid fiber rollouts in India and Japan. The internet protocol television market size in China remains anchored by China Telecom’s 195 million subscribers, China Mobile’s 110 million, and China Unicom’s 75 million. India’s fiber base crossed 35 million lines by mid-2025, supporting 2 million new IPTV additions each month.
Europe faces cord-cutting, yet platforms such as MagentaTV stabilized counts by bundling Netflix and Disney+ under one interface. Deutsche Telekom added 400,000 subscribers in 2024 after years of decline. North America saw total subscriber losses, as AT&T and Verizon reported declines, but fiber broadband footprints grew, giving operators headroom to upsell streaming-only bundles.
In Africa, Nigeria, Egypt, and South Africa see mobile operators pair fixed-wireless home broadband with IPTV, bypassing the scarcity of copper. The Nigerian Communications Commission tallied 8.2 million broadband lines by mid-2025, up from 5.1 million two years earlier. South America relies on Brazil, where 28 million homes had fiber by late 2024, enabling Claro and Vivo to launch 4K IPTV. The Middle East follows with Saudi Arabia’s STC and UAE’s Etisalat bundling IPTV and 5G to secure 3.5 million subs across 2024-2025.

Competitive Landscape
The Internet Protocol Television market features moderate concentration. Incumbent telcos such as AT&T, Verizon, Deutsche Telekom, Orange, BT, Telefónica, and China Telecom command local scale through fiber assets and established billing relationships. They fend off churn by integrating third-party apps inside unified guides and by selling converged packages that combine broadband, IPTV, mobile, and smart-home monitoring. Pure-play OTT firms keep pricing pressure high yet lack the network control that telcos use to guarantee quality of service.
Equipment and middleware vendors battle on openness and efficiency. Cisco’s Infinite Video Platform and Ericsson MediaFirst let operators push new channels via software updates, cutting rollout lead times from months to weeks. Huawei’s OptiXstar uses machine learning to allocate bandwidth dynamically, dropping buffering by 32% in field trials. Smaller challengers such as Broadpeak and Amino Technologies supply cloud-native stacks that enable tier-2 telcos to launch IPTV without big capex. Sagemcom delivers Android TV set-top boxes priced 40% lower than proprietary devices, boosting adoption in cash-limited markets.
CDN providers are integral. Akamai and Cloudflare embed AI traffic prediction to pre-cache popular titles, preventing congestion when sporting events drive concurrent views. Telcos also explore open-source middleware like RDK to reduce vendor lock-in; Comcast donated RDK to the community and it now powers 80 million boxes worldwide. Compliance with ETSI and DVB standards stays non-negotiable as regulators demand interoperability and content protection. Piracy remains a challenge, with illegal IPTV panels costing Europe about USD 1 billion annually, pushing Europol and rights owners to coordinate enforcement.
Internet Protocol Television (IPTV) Industry Leaders
Akamai Technologies, Inc.
AT&T Inc.
Cisco Systems Inc
Ericsson AB
Huawei Technologies Co., Ltd.
- *Disclaimer: Major Players sorted in no particular order

Recent Industry Developments
- June 2025: Ericsson activated MediaFirst for three more European operators, each cutting operating costs by up to 30% through cloud delivery.
- March 2025: Telekom Malaysia launched Unifi Plus, combining fiber, IPTV, and 5G mobile, cutting churn by 14 percentage points within a quarter.
- January 2025: Reliance Jio started JioFiber Postpaid Plus, bundling gigabit fiber, fourteen OTT apps, and four SIM cards, winning 2.3 million additions by Jun 2025.
- September 2024: China Telecom added 12 million IPTV users during 2024, driven by its Smart Home gigabit bundles.


Research Methodology Framework and Report Scope
Market Definitions and Key Coverage
Our study treats the Internet Protocol Television market as all subscription-based or ad-supported television and video services that are delivered over a managed IP network, together with the middleware and carrier-grade encoding infrastructure that enable linear, time-shifted, and on-demand viewing across set-top boxes, smart TVs, and authenticated mobile apps.
Scope exclusion: Pure over-the-top streaming platforms that bypass operator control and the retail sale of consumer devices are not counted.
Segmentation Overview
- By Component
- Hardware
- Set-Top Box (STB)
- Middleware
- Transmission and Encoding Equipment
- Conditional Access Systems
- Services
- Managed IPTV Services
- Integration and Consulting
- Support and Maintenance
- Hardware
- By Revenue Model
- Subscription-Based
- Pay-Per-View
- Advertising-Supported (AVoD)
- By Streaming Type
- Live/Linear TV
- Time-Shifted/Replay TV
- Video-on-Demand
- By Device/Access Platform
- Smart TV
- Mobile and Tablet
- PC/Laptop
- Set-Top Box and Media Streamer
- By Delivery Method
- Multicast IPTV
- Unicast IPTV
- By Geography
- North America
- United States
- Canada
- Mexico
- South America
- Brazil
- Argentina
- Rest of South America
- Europe
- Germany
- United Kingdom
- France
- Italy
- Spain
- Rest of Europe
- Asia-Pacific
- China
- India
- Japan
- South Korea
- Australia and New Zealand
- Rest of Asia-Pacific
- Middle East
- Saudi Arabia
- United Arab Emirates
- Turkey
- Rest of Middle East
- Africa
- South Africa
- Nigeria
- Egypt
- Rest of Africa
- North America
Detailed Research Methodology and Data Validation
Primary Research
Mordor analysts interviewed IPTV product heads at multi-play operators in North America, Europe, India, and the Gulf, alongside CDN integrators and chipset vendors. These conversations validated penetration assumptions, clarified emerging ad-supported video models, and flagged regional ARPU sensitivities that desktop sources could not reveal.
Desk Research
We drew on telecom regulator datasets such as the ITU's Fixed-broadband indicators, the US FCC broadband deployment files, and filings from Ofcom and ARCEP, which outline subscriber counts and average revenue per user. Trade bodies, ETNO, the Fiber-to-the-Home Council, and the Asia Video Industry Association, provided insight on multicast roll-outs and codec migration. Company 10-Ks, investor decks, and tariff sheets complemented these open sources, while usage analytics from D&B Hoovers and news archives in Dow Jones Factiva helped map competitive launches and pricing shifts. This listing is illustrative only; many additional references supported data gathering and sense-checking.
Market-Sizing & Forecasting
A top-down model converts reported broadband lines into an addressable pool, then applies region-specific IPTV take-up rates derived from primary interviews. Total subscribers are multiplied by blended service ARPU to reach 2025 revenue. Select bottom-up roll-ups of operator earnings releases and sampled ASP multiplied by encoder shipments were used to adjust totals. Key variables include fiber household penetration, HDTV channel mix, 5G fixed-wireless substitution, content-delivery cost curves, and ad-load tolerance trends. Forecasts to 2030 rely on a multivariate regression that links subscriber growth and ARPU to these drivers, with scenario analysis around codec efficiency gains to stress-test the outlook.
Data Validation & Update Cycle
Outputs pass variance tests against external benchmarks and historical operator margins. Senior analysts review anomalies before sign-off. Reports refresh annually, with interim revisions triggered by material events such as a major merger or spectrum auction. A last-minute sanity check is performed prior to client delivery.
Why Our Internet Protocol Television Baseline Figures Stand Up to Scrutiny
Published estimates rarely align because each publisher chooses distinct service mixes, hardware inclusions, and currency bases. We disclose our chosen levers, update cadence, and verification layers, which gives decision-makers a baseline they can replicate with modest effort.
Benchmark comparison
| Market Size | Anonymized source | Primary gap driver |
|---|---|---|
| USD 56.61 B (2025) | Mordor Intelligence | - |
| USD 79.05 B (2024) | Global Consultancy A | Blends unmanaged OTT revenues into IPTV totals |
| USD 79.86 B (2024) | Industry Research Firm B | Adds hardware sales and uses differing base-year exchange rates |
These comparisons show that once unmanaged streaming and device revenues are stripped out, our figure lands in the middle of the spread, underscoring how Mordor's disciplined scope selection and yearly refresh deliver a balanced, transparent reference point for strategy teams.


Key Questions Answered in the Report
What CAGR is forecast for the Internet Protocol Television market through 2031?
The market is projected to grow at 15.55% CAGR from 2026 to 2031.
Which region contributes the largest revenue to the internet protocol television market?
Asia-Pacific generated 45.89% of global revenue in 2025, making it the leading region.
Why are advertising-supported tiers gaining ground in IPTV services?
AVoD models attract price-sensitive viewers and let operators monetize through targeted ads, which is driving a 16.3% CAGR from 2026 to 2031 in this segment.
How are telcos countering cord-cutting in mature markets?
They deploy super-aggregation interfaces and bundle IPTV with broadband and mobile services to improve retention and upsell value.
Page last updated on:


