Internet Of Things In Retail Market Size and Share
Market Overview
| Study Period | 2019 - 2030 |
|---|---|
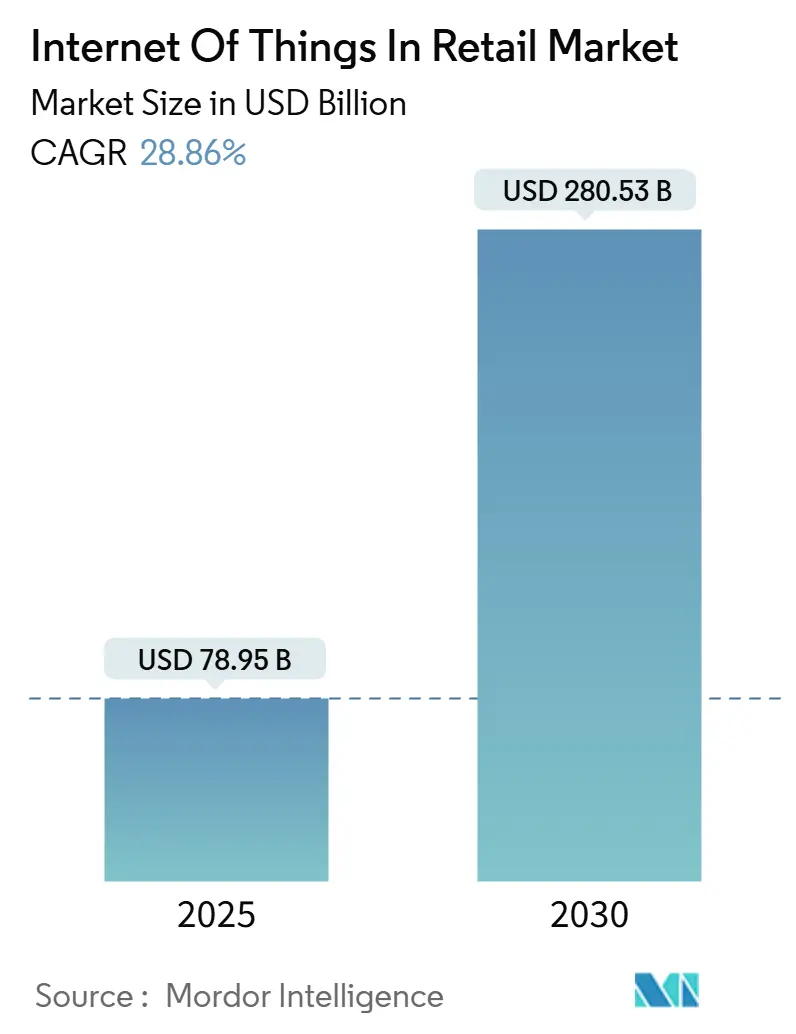
| Market Size (2025) | USD 78.95 Billion |
| Market Size (2030) | USD 280.53 Billion |
| Growth Rate (2025 - 2030) | 28.86% CAGR |
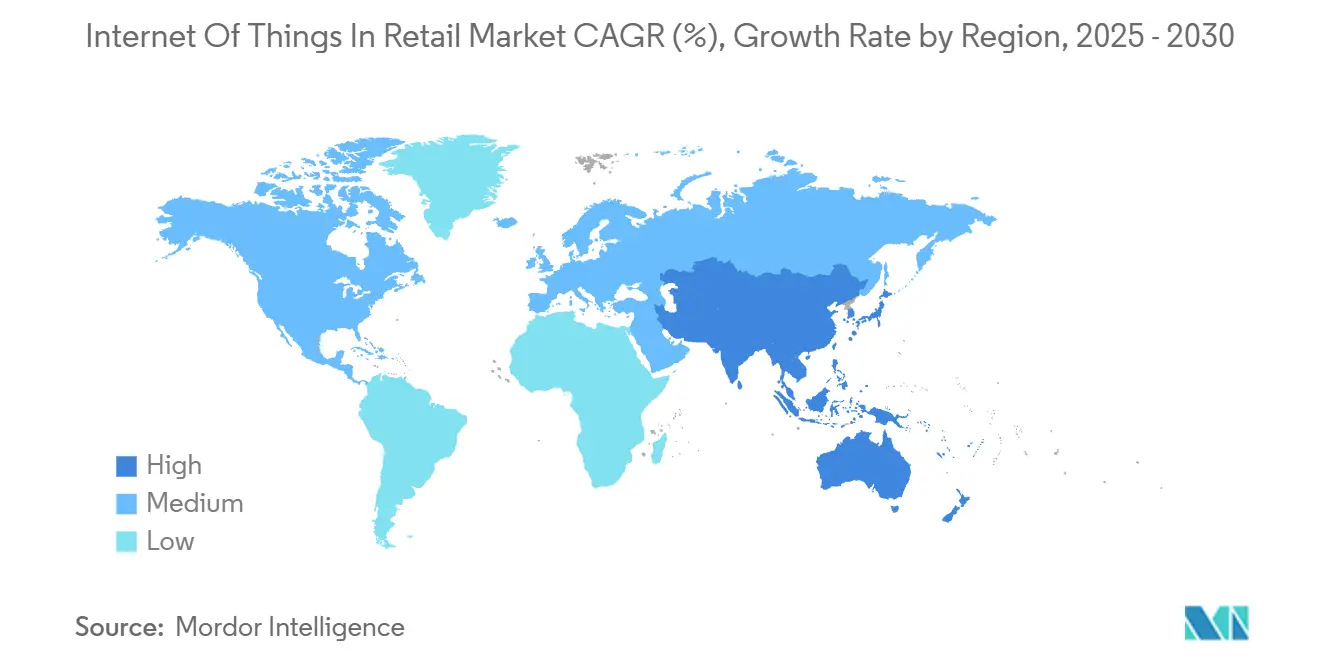
| Fastest Growing Market | Asia Pacific |
| Largest Market | North America |
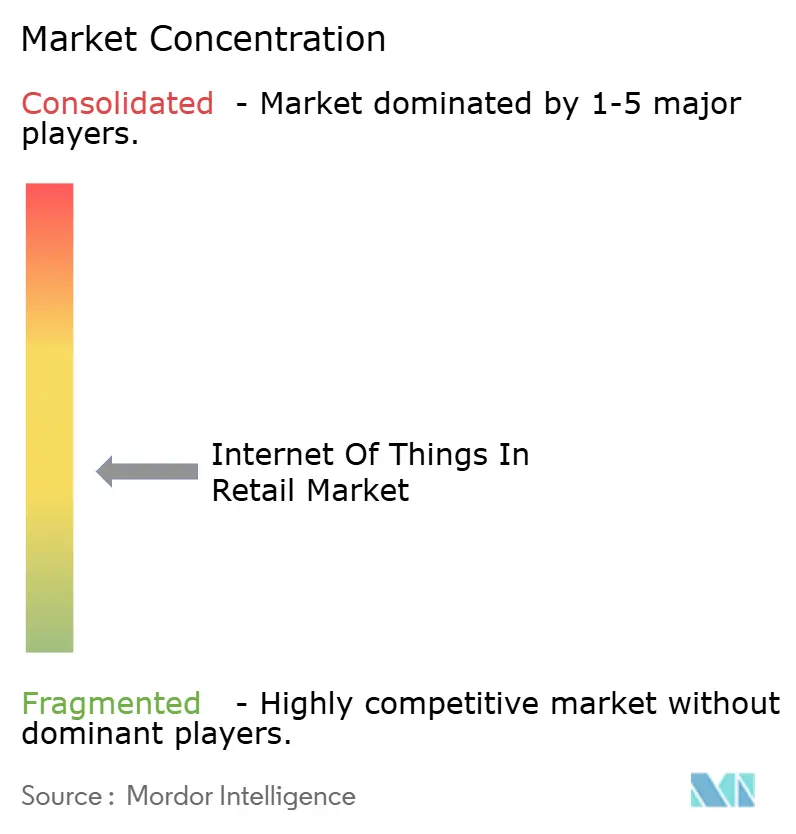
| Market Concentration | Medium |
Major Players *Disclaimer: Major Players sorted in no particular order Image © Mordor Intelligence. Reuse requires attribution under CC BY 4.0. | |
Internet Of Things In Retail Market Analysis by Mordor Intelligence
The Internet of Things in retail market stands at USD 78.95 billion in 2025 and is projected to reach USD 280.53 billion by 2030, registering a 28.86% CAGR. Strong device connectivity, falling sensor costs, and edge‐computing maturity are enabling retailers to move from periodic stocktakes to predictive, data-driven decision making. The expanding semiconductor base, wider 5G coverage, and maturing cloud platforms bring down hardware barriers while raising expectations for real-time customer engagement and supply-chain visibility. Retailers also see new revenue streams in retail media networks that monetize first-party data generated by store sensors. Meanwhile, the EU Cyber Resilience Act and similar rules raise compliance costs but ultimately build consumer trust in connected store environments.[1]European Commission, “Cyber Resilience Act,” europa.eu
Key Report Takeaways
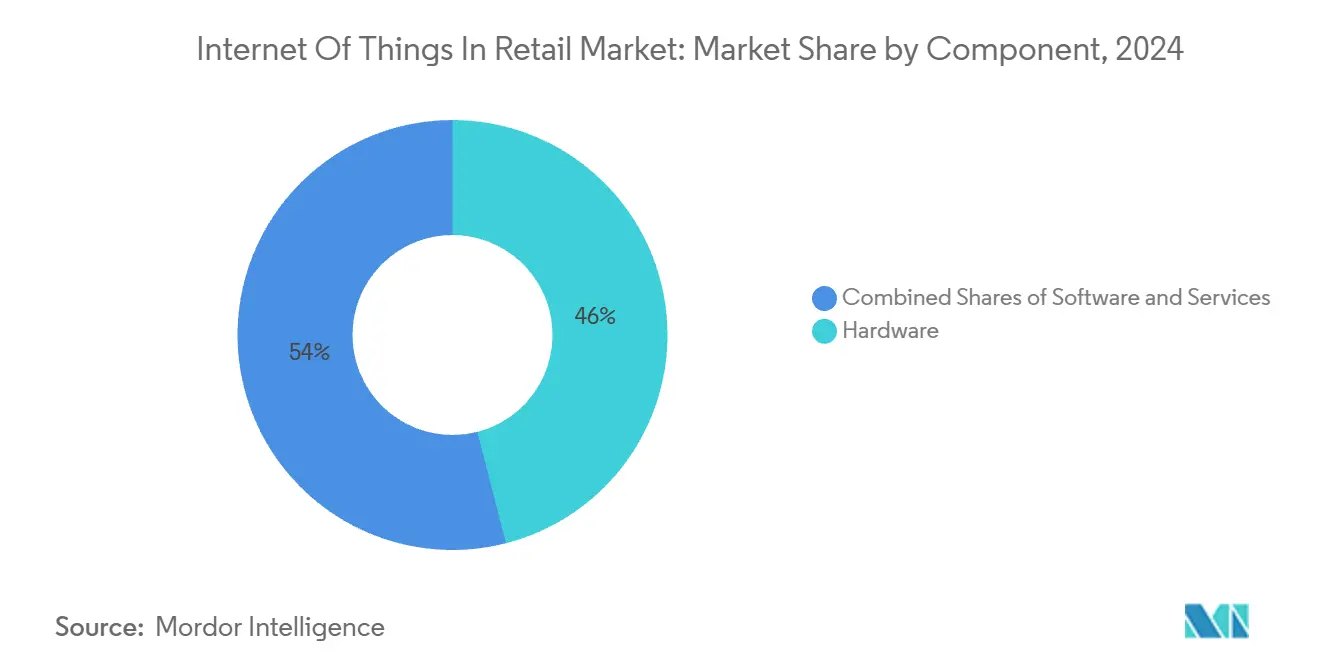
- By component, hardware held 46.0% of the Internet of Things in retail market share in 2024, while services are forecast to expand at a 28.88% CAGR through 2030.
- By application, smart shelf and inventory management led with 28.0% revenue share in 2024; smart checkout and POS is projected to grow the fastest at a 31.0% CAGR to 2030.
- By technology, RFID commanded a 33.0% share of the Internet of Things in the retail market size in 2024; computer vision cameras are advancing at a 33.50% CAGR through 2030.
- By deployment mode, cloud accounted for 52.0% of 2024 revenue, while edge deployment is expected to expand at a 29.80% CAGR between 2025-2030.
- By retail format, supermarkets/hypermarkets captured 39.0% of 2024 sales; e-commerce warehouses are forecast to post the highest 28.90% CAGR through 2030.
- By geography, North America retained a 33.0% share in 2024, whereas Asia Pacific is projected to rise at a 33.12% CAGR to 2030.
Global Internet Of Things In Retail Market Trends and Insights
Drivers Impact Analysis*
| Driver | (~) % Impact on CAGR Forecast | Geographic Relevance | Impact Timeline |
|---|---|---|---|
| Adoption of smart shelves and RFID for real-time inventory | +4.2% | Global, early in North America and Europe | Medium term (2–4 years) |
| Omnichannel retail demand for connected operations | +3.8% | Global, strongest in developed markets | Medium term (2–4 years) |
| Declining sensor costs and edge-computing maturity | +3.1% | Global, accelerated in Asia Pacific hubs | Short term (≤ 2 years) |
| Retail-media data monetization of in-store IoT | +2.9% | North America and Europe, expanding to Asia Pacific | Long term (≥ 4 years) |
| Carbon-tracking mandates driving energy management IoT | +2.4% | Europe and North America regulatory markets | Long term (≥ 4 years) |
| 5G private networks enabling in-store computer vision | +2.1% | Developed markets with 5G infrastructure | Medium term (2–4 years) |
| Source: Mordor Intelligence | |||
Adoption of smart shelves and RFID for real-time inventor
RFID inlays have shrunk enough to tag liquids and metals, extending coverage from 30% to 85% of store SKUs and pushing automated stock accuracy gains to 35% while cutting manual checks by 60%. Dynamic-antenna robots now achieve 95.8% pick-up on low shelving and 98.0% on high shelving, allowing storewide audits overnight without staff intervention. Camera systems such as Casino Group’s fresh-produce rollout complement RFID by reading visual cues that tags cannot handle. As 2025 systems hit volume production, industry consensus positions RFID as a standard cost of doing business rather than a premium add-on.
Omnichannel retail demand for connected operations
More than 75% of retailers now pursue unified online-offline experiences that require seamless data flow between apps, beacons, and PoS devices. Camera-sensor bundles at Samsøe Samsøe stores lifted men’s conversion by 5.5% after adjusting HVAC and lighting in response to live customer analytics. Telstra’s edge-AI video analytics deliver 95% accuracy in foot-traffic counts while masking identities on-site, ensuring privacy compliance. FairPrice Group’s cloud-connected carts trigger staff alerts when queues grow beyond set limits, turning data into immediate action. Reliable edge processing keeps these systems running even if the WAN link drops, guaranteeing checkout continuity
Declining sensor costs and edge-computing maturity
Asia Pacific fabs slash component prices as 5G subscriber bases top 1.8 billion, fueling affordable sensor bundles for global rollouts.[2]GSMA, “The Mobile Economy 2024,” gsma.comRetailers can now re-flash security cameras with AI models, adding people-counting without new hardware. Over 700 European stores adopted Milesight’s LoRaWAN ToF sensors to monitor occupancy, feeding workforce schedules that cut idle hours by double digits Integration with Vemco Group’s dashboards shows that hardware and analytics partnerships are displacing siloed installs. Predictive analytics across supply-chain nodes reduces spoilage by flagging at-risk inventory days earlier than manual checks.
Retail-media data monetization of in-store IoT
Global retail-media spending is set to hit USD 233.89 billion by 2027, buoyed by foot-traffic and basket-level data that only connected stores can supply. CVS Media Exchange targets USD 1 billion in in-store ad spend by 2028, monetizing shelf-level insights passed through API connections to brands. Walmart’s network of digital screens already couples ad exposure with PoS outcomes in real time, commanding rates on par with national broadcast slots. Macy’s is trialing strategic screen placement governed by heat-map analytics to avoid shopper fatigue. Design and operations teams now collaborate via centralized IoT dashboards that track campaign lift, turning stores into measurable media channels.
Restraints Impact Analysis*
| Restraint | (~) % Impact on CAGR Forecast | Geographic Relevance | Impact Timeline |
|---|---|---|---|
| Security and data-privacy concerns | −3.4% | Global, strictest in Europe under GDPR | Short term (≤ 2 years) |
| Interoperability and legacy-system integration | −2.8% | Global, acute in established retail markets | Medium term (2–4 years) |
| E-waste regulations raise hardware compliance cost | −2.1% | Europe and developed markets with WEEE mandates | Long term (≥ 4 years) |
| Edge-AI bias risks limiting roll-outs | −1.6% | Developed markets with algorithmic laws | Medium term (2–4 years) |
| Source: Mordor Intelligence | |||
Security and data-privacy concerns
Ransomware and credential theft increasingly exploit poorly secured sensors, driving average breach costs higher and forcing mid-tier retailers to reevaluate benefit-to-risk ratios. The EU Cyber Resilience Act obliges manufacturers to patch vulnerabilities over the full device life cycle; fines reach EUR 15 million for non-compliance, pushing smaller vendors out of bids. Retailers, therefore, lean toward platforms with Software Bill of Materials transparency and Zero-Trust design. Added encryption and continuous authentication raise compute overhead but reduce liability exposure. As vendor ecosystems consolidate under tougher rules, initial procurement may slow, yet long-term trust is expected to widen adoption.
Interoperability and legacy-system integration
Many grocers still rely on proprietary PoS and ERP stacks, creating data silos that hinder IoT rollouts.[3]IoT Now, “Legacy Systems and IoT Integration,” iot-now.comNB-IoT gateway prototypes prove technical bridging but add maintenance layers that resource-strapped IT teams struggle to support. Retail executives report integration taking 30-40% longer than budgeted due to custom APIs. Cross-functional projects now include IT, store design, and marketing from day one to avoid rework, as highlighted in 2024 store‐design surveys. Until universal data standards emerge, interoperability will remain a capex and timeline hurdle that tempers otherwise strong ROI projections.
*Our forecasts treat driver/restraint impacts as directional, not additive. The impact forecasts reflect baseline growth, mix effects, and variable interactions.
Segment Analysis
By Component: Hardware Foundations Drive Service Innovation
Hardware captured 46.0% of 2024 revenue, anchoring every sensing layer from RFID tags to edge servers within the Internet of Things in the retail market. Services, however, are projected to climb 28.88% per year, reflecting retailer demand for managed connectivity, predictive analytics subscriptions, and device lifecycle outsourcing. Software platforms mediate these layers, turning raw telemetry into replenishment alerts and staff schedules. In revenue terms, managed services are now bundled with hardware in 3- to 5-year contracts, shifting cash flows from capex to opex. Retailers that lack deep IT teams prefer single-point support agreements covering connectivity, firmware patches, and analytics dashboards. Professional services demand spikes during rollouts and again at optimization phases, showing that IoT value realization is a journey rather than a switch-on event. Honeywell-Verizon’s 2025 bundle exemplifies this trend, collapsing procurement complexity into one invoice while ensuring 5G uptime warranties.[4]Honeywell, “Honeywell-Verizon Retail Bundle,” honeywell.comAs analytics mature, retailers increasingly benchmark store performance across chains, reinforcing recurring-service stickiness and pushing hardware vendors to adopt consumption-based pricing.
In volume terms, sensors and gateways dominate unit counts, but maintenance tools and monitoring licenses generate higher gross margins. Larger chains negotiate multi-year service-level agreements that guarantee sub-second latency for point-of-sale failover at every site. Over the forecast, devices will continue entering stores; yet revenue curves tilt to software and services, confirming the Internet of Things in retail market’s shift to an outcome-based economy where uptime, insight, and security outperform raw device counts.


By Application: Smart Checkout Transforms Customer Experience
Smart checkout and POS is expected to be the fastest-rising application at a 31.0% CAGR, reflecting consumer demand for frictionless exits and retailers’ drive to redeploy labor. Inventory-centric systems still led with 28.0% of 2024 revenue, but investment dollars now favor customer-facing gains that convert dwell time into higher basket values. The Internet of Things in retail market size for smart checkout solutions is forecast to jump as camera arrays, weight sensors, and computer vision models coalesce into near-instant payment events. Amazon’s Just Walk Out blueprint lowered abandonment rates and set shopper expectations globally. In parallel, predictive maintenance applications cut refrigeration downtime in grocery, saving energy and reducing spoilage, with Hussmann reporting a 30% leak-rate drop within the first year of deployment.
Asset tracking remains critical for click-and-collect fulfillment, linking in-store pick paths to customer notification times. Energy and facility-management use cases scale on new carbon-reporting mandates, making real-time kWh dashboards standard in chain store NOCs. Together, these applications underscore how IoT blends operational discipline with customer experience to raise revenue and shrink cost lines.
By Technology: Computer Vision Accelerates Beyond RFID
RFID maintained a 33.0% hold in 2024, yet computer-vision systems are expanding at 33.50% yearly as retailers chase deeper behavioral insights. Vision-AI overlays enable demographic analytics, traffic heat maps, and loss-prevention triggers that static tags cannot capture. BLE beacons offer proximity marketing at low cost, but camera-based systems feed more granular datasets into marketing platforms. Private 5G and Wi-Fi 6E backbones carry heavy video payloads while keeping latency under 50 ms. The Internet of Things in the retail market size for vision platforms is primed to surpass RFID spend in high-footfall formats by 2028 if current curves hold.
Elsewhere, NB-IoT and LTE-M extend low-power coverage into supply-chain corridors, enabling cost-effective pallet tracking from port to store shelf. Spark and Air New Zealand’s autonomous-robot stock-takes on a private 5G slice show what wide-area, low-latency coverage can deliver. Zigbee, Z-Wave, and NFC continue serving niche lighting, HVAC, and shopper-engagement pockets, proving that no single protocol meets every retail need.
By Deployment Mode: Edge Computing Gains Strategic Priority
Cloud kept 52.0% of spending in 2024 because centralized control and elastic compute are invaluable to multi-brand empires. Yet, edge installations are expected to grow nearly 30% annually as vision and checkout tools require on-site inference for sub-second decisions. When an AI model prices markdowns for produce within one minute of sensor detection, data round-trips to the cloud introduce unacceptable lag. Retailers thus place GPU-grade devices store-side while sending only summarized insights upward, balancing bandwidth cost with analytic depth.
Hybrid patterns dominate the Internet of Things in the retail market, with real-time decisions running on-premises and longer-horizon analytics in the cloud. Edge also helps meet GDPR obligations by keeping raw video in the country. On-premises deployments still serve regulation-heavy verticals such as pharmacies because data sovereignty trumps scalability there. As hardware costs fall, chain operators evaluate edge nodes per 5- to 10-store cluster rather than per site, optimizing utilization and service windows.

By Retail Format: eCommerce Warehouses Lead Digital Transformation
Supermarkets/hypermarkets account for 39.0% of 2024 spend owing to high SKU counts and energy-intensive refrigeration. Even so, e-commerce warehouses will log the fastest 28.90% CAGR as pure-play and omnichannel retailers automate pick-pack-ship flows. The Internet of Things in the retail market share for dark-store environments will rise as robot fleets, AS/RS cranes, and RFID tunnels cut order cycle times for same-day delivery promises. Convenience stores adopt compact vision solutions that verify age checks and reduce shrink at unattended kiosks. Department and specialty outlets leverage IoT mostly for experience layering, such as smart mirrors and AR displays that feed CRM back-ends in real time.
Over the forecast, fulfillment centers become testbeds for robotics, drone replenishment, and AI-routed AMRs, innovations that later trickle into front-of-house environments. Format diversification, therefore, multiplies opportunities and cements the Internet of Things in the retail market as a cross-channel backbone rather than a store-only toolkit.
Geography Analysis
North America controlled 33.0% of 2024 revenue, backed by early RFID adoption and dense 5G coverage that accelerates edge rollouts. State-by-state cyber rules largely align with federal frameworks, giving chains clear guardrails for experiment budgets. Amazon continues scaling cashier-less formats, and Walmart’s chain-wide digital-label program signals mainstream acceptance of dynamic pricing. Retailers also tap hyperscale partners such as Microsoft for managed IoT stacks; Azure consumption by U.S. retailers rose 23% in 2024, indicating deeper system reliance. While new cybersecurity mandates increase baseline costs, predictable regulation supports steady capital plans across 2025-2027.
Asia Pacific is the fastest-growing Internet of Things in retail market at a 33.12% CAGR. The region hosts 1.8 billion mobile subscribers-a vast foundation for payment and loyalty integrations. Local semiconductor output lowers sensor BOM costs, allowing mass deployment across convenience chains in Japan and pop-up kiosks in India. Government digital agendas-from Singapore’s Smart Nation to India’s ONDC-fund infrastructure that retailers repurpose for last-mile analytics. E-waste rules remain lighter than in Europe, though extended producer-responsibility laws are tightening and nudging vendors toward modular devices. Collectively, cost advantages plus policy tailwinds sustain rapid adoption.
Europe blends strong technology appetite with strict consumer-protection frameworks. GDPR sets the benchmark for data handling, and the upcoming Cyber Resilience Act mandates security-by-design disclosures, potentially elongating procurement cycles. At the same time, ambitious 90% decarbonization targets for 2040 propel energy-monitoring deployments across big-box fleets. The “right to repair” directive passed in 2024 extends device life, boosting service revenue as retailers add in-house repair counters. Overall, Europe’s policy landscape tempers initial rollouts but ensures long-term system robustness and customer trust.

Competitive Landscape
The Internet of Things in retail market is highly fragmented, with no single vendor controlling double-digit share. Large cloud hyperscalers, telecom operators, hardware specialists, and AI startups each carve out slices of the value chain. Amazon Web Services exploits its retail lineage to sell packaged store-analytics stacks, while Microsoft, Google, and Alibaba partner with regional leaders to bundle compute, AI, and device management. Telecommunications firms such as Verizon and Vodafone leverage spectrum holdings to bundle private 5G networks with gateway hardware.
Strategically, vendors are shifting from point solutions to end-to-end platforms that knit hardware, software, and services under unified SLAs. Hewlett Packard Enterprise’s patent US 12095770 B2 on simplified IoT Wi-Fi onboarding underscores a race to reduce deployment friction. Partnerships proliferate: Honeywell aligns with Qualcomm for edge-AI handhelds, while VusionGroup pairs with Walmart to deploy shelf-label networks at unprecedented scale. Startups focus on computer-vision algorithms that overlay demographic insights on legacy camera feeds, enabling chains to upgrade analytics without re-cabling stores.
Investment flows follow data-monetization potential. Battery Ventures’ 2025 stake in RetailNext funds omnichannel analytics that tie online campaigns to in-store conversion. Meanwhile, device makers bundle managed services to lock in recurring revenue and protect margins amid sensor commoditization. As compliance burdens rise, smaller point-solution vendors may struggle, hinting at future consolidation around domain leaders able to certify end-to-end security.
Internet Of Things In Retail Industry Leaders
IBM Corporation
Microsoft Corporation
Cisco Systems Inc.
Huawei Technologies Co. Ltd
Google LLC
- *Disclaimer: Major Players sorted in no particular order

Recent Industry Developments
- June 2025: FairPrice Group launched “Store of Tomorrow” with Google Cloud, deploying connected carts and AI portals across outlets.
- March 2025: Hussmann Corporation partnered with Phoenix Energy Technologies to introduce Refrigeration IQ leak-detection platform.
- February 2025: Milesight and Vemco Group integrated people-counting sensors with analytics software for 700+ European stores.
- February 2025: VusionGroup extended its Vusion 360 digital-label suite to all Walmart U.S. locations.


Global Internet Of Things In Retail Market Report Scope
IoT helps retailers to gather data and produce insights without compromising data security. As a result, retailers can maintain the basic approaches to adopting in-store connectivity (such as enabling the IoT era at the endpoints).
The Internet of Things (IoT) in retail market report is segmented by component (hardware, software, and services), application (smart shelf and inventory management, asset tracking and fleet management, predictive equipment maintenance, smart checkout and pos, customer engagement and marketing, energy and facility management), technology (RFID, bluetooth low energy (BLE) beacons, Wi-Fi, zigbee / Z-Wave, NFC, 5G and cellular IoT (NB-IoT, LTE-M), and computer vision and AI cameras), deployment mode (on-premises, cloud, and edge), retail format (supermarkets / hypermarkets, convenience stores, specialty stores, department stores, and ecommerce warehouses and dark stores), and geography (North America, South America, Europe, Asia Pacific, and Middle East and Africa). The Market Forecasts are Provided in Terms of Value (USD).
| Hardware | |
| Software | |
| Services | Managed Services |
| Professional Services |
| Smart Shelf and Inventory Management |
| Asset Tracking and Fleet Management |
| Predictive Equipment Maintenance |
| Smart Checkout and POS |
| Customer Engagement and Marketing |
| Energy and Facility Management |
| RFID |
| Bluetooth Low Energy (BLE) Beacons |
| Wi-Fi |
| Zigbee / Z-Wave |
| NFC |
| 5G and Cellular IoT (NB-IoT, LTE-M) |
| Computer Vision and AI Cameras |
| On-premises |
| Cloud |
| Edge |
| Supermarkets / Hypermarkets |
| Convenience Stores |
| Specialty Stores |
| Department Stores |
| eCommerce Warehouses and Dark Stores |
| North America | United States | |
| Canada | ||
| Mexico | ||
| South America | Brazil | |
| Argentina | ||
| Rest of South America | ||
| Europe | United Kingdom | |
| Germany | ||
| France | ||
| Italy | ||
| Spain | ||
| Rest of Europe | ||
| Asia Pacific | China | |
| Japan | ||
| India | ||
| South Korea | ||
| Australia and New Zealand | ||
| Rest of Asia Pacific | ||
| Middle East and Africa | Middle East | Saudi Arabia |
| United Arab Emirates | ||
| Turkey | ||
| Rest of Middle East | ||
| Africa | South Africa | |
| Nigeria | ||
| Kenya | ||
| Rest of Africa | ||
| By Component | Hardware | ||
| Software | |||
| Services | Managed Services | ||
| Professional Services | |||
| By Application | Smart Shelf and Inventory Management | ||
| Asset Tracking and Fleet Management | |||
| Predictive Equipment Maintenance | |||
| Smart Checkout and POS | |||
| Customer Engagement and Marketing | |||
| Energy and Facility Management | |||
| By Technology | RFID | ||
| Bluetooth Low Energy (BLE) Beacons | |||
| Wi-Fi | |||
| Zigbee / Z-Wave | |||
| NFC | |||
| 5G and Cellular IoT (NB-IoT, LTE-M) | |||
| Computer Vision and AI Cameras | |||
| By Deployment Mode | On-premises | ||
| Cloud | |||
| Edge | |||
| By Retail Format | Supermarkets / Hypermarkets | ||
| Convenience Stores | |||
| Specialty Stores | |||
| Department Stores | |||
| eCommerce Warehouses and Dark Stores | |||
| By Geography | North America | United States | |
| Canada | |||
| Mexico | |||
| South America | Brazil | ||
| Argentina | |||
| Rest of South America | |||
| Europe | United Kingdom | ||
| Germany | |||
| France | |||
| Italy | |||
| Spain | |||
| Rest of Europe | |||
| Asia Pacific | China | ||
| Japan | |||
| India | |||
| South Korea | |||
| Australia and New Zealand | |||
| Rest of Asia Pacific | |||
| Middle East and Africa | Middle East | Saudi Arabia | |
| United Arab Emirates | |||
| Turkey | |||
| Rest of Middle East | |||
| Africa | South Africa | ||
| Nigeria | |||
| Kenya | |||
| Rest of Africa | |||


Key Questions Answered in the Report
What is the current size of the Internet of Things in retail market?
The market is valued at USD 78.95 billion in 2025 and is on track to reach USD 280.53 billion by 2030.
How fast is the Internet of Things in retail market growing?
It is expanding at a robust 28.86% CAGR over the 2025-2030 period.
Which application area is growing the fastest?
Smart checkout & POS solutions are forecast to rise at a 31.0% CAGR, outpacing inventory systems.
Why is Asia Pacific the fastest-growing region?
The region benefits from 1.8 billion mobile users, lower sensor costs, and strong government digital initiatives, leading to a projected 33.12% CAGR.
What are the main barriers to IoT adoption in retail?
Data-privacy risks, interoperability with legacy systems, and rising e-waste compliance costs are the key restraints highlighted in the report.
How are retailers monetizing IoT data?
Chains are turning sensor-generated insights into retail media networks, a segment expected to exceed USD 233 billion in global ad spend by 2027.
Page last updated on:


