Insurance Fraud Detection Market Size and Share
Market Overview
| Study Period | 2020 - 2031 |
|---|---|
| Market Size (2026) | USD 8.52 Billion |
| Market Size (2031) | USD 20.22 Billion |
| Growth Rate (2026 - 2031) | 18.87% CAGR |
| Fastest Growing Market | Asia Pacific |
| Largest Market | North America |
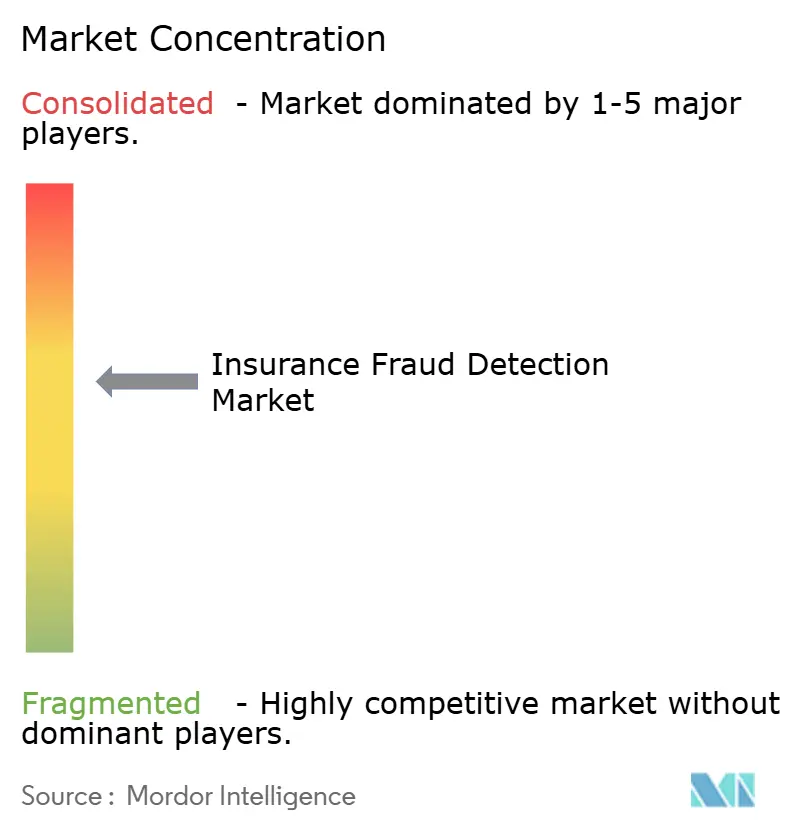
| Market Concentration | Medium |
Major Players *Disclaimer: Major Players sorted in no particular order Image © Mordor Intelligence. Reuse requires attribution under CC BY 4.0. | |
Insurance Fraud Detection Market Analysis by Mordor Intelligence
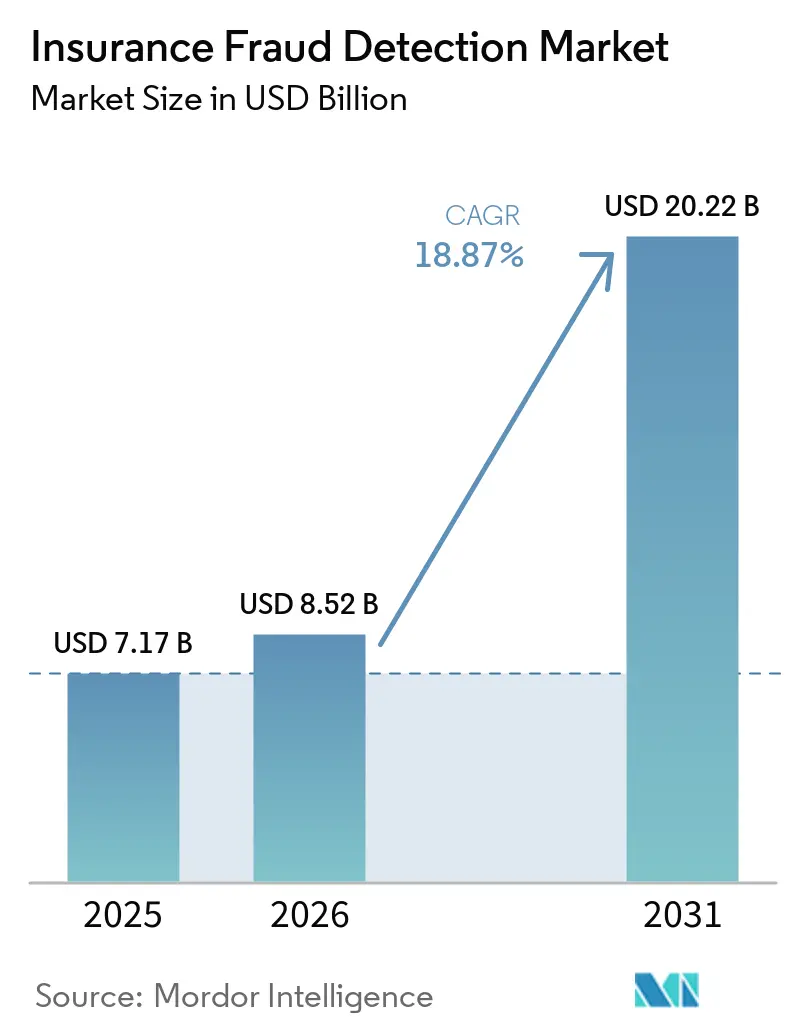
The insurance fraud detection market size is projected to be USD 7.17 billion in 2025, USD 8.52 billion in 2026, and reach USD 20.22 billion by 2031, growing at a CAGR of 18.87% from 2026 to 2031. Heightened claim volumes, rising cost pressures, and demands for real-time loss prevention are shifting budgets toward multimodal analytics and unified governance frameworks. Carriers that embed artificial intelligence into claims and underwriting workflows are compressing investigation cycles, lowering false-positive rates, and improving customer retention. Technology vendors respond by releasing pre-integrated connectors for telematics, the Internet of Things, and third-party data feeds, while consultancies monetize ongoing model validation and compliance audits. Capital inflows to insurtech firms signal steady innovation, yet regulatory mandates on algorithmic accountability force transparency investments that favor platforms with built-in audit trails.
Key Report Takeaways
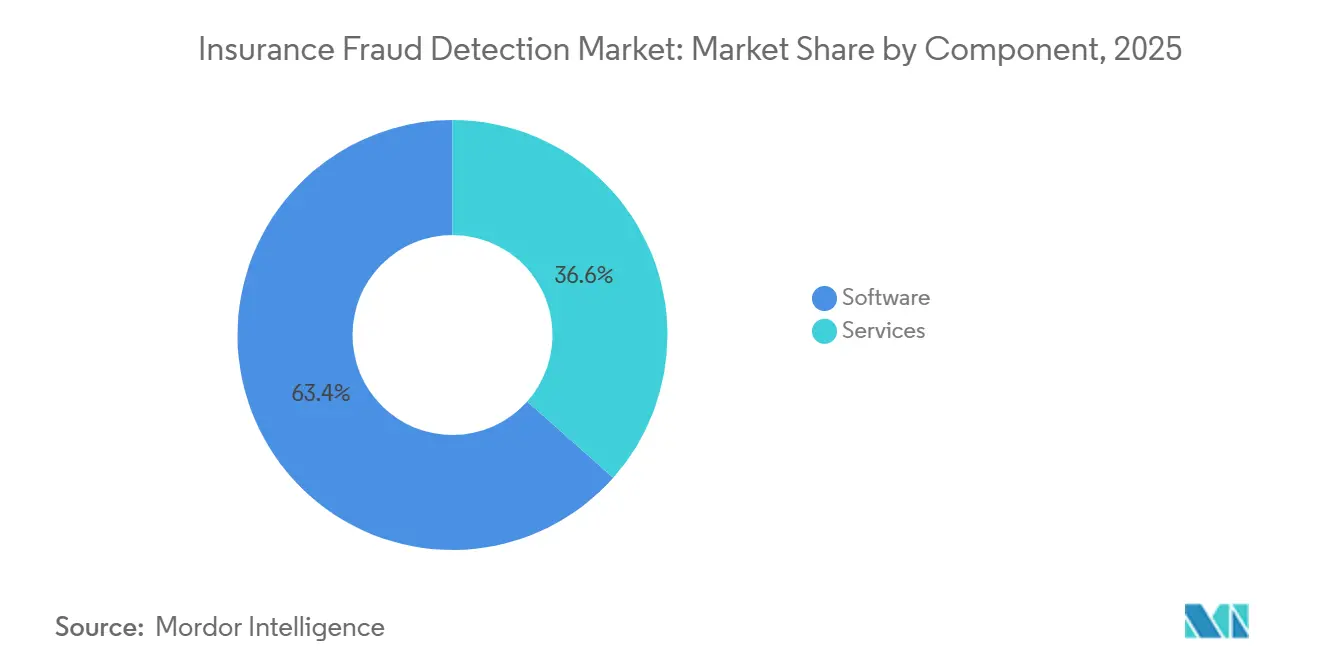
- By component, software accounted for 63.44% of revenue in the insurance fraud detection market in 2025; services are advancing at a 19.07% CAGR through 2031.
- By deployment mode, cloud-based solutions held 58.46% of the insurance fraud detection market share in 2025, while hybrid architectures are forecast to expand at a 19.34% CAGR to 2031.
- By organization size, large enterprises captured 69.71% of 2025 spending; small and medium enterprises are projected to grow at a 19.11% CAGR through 2031.
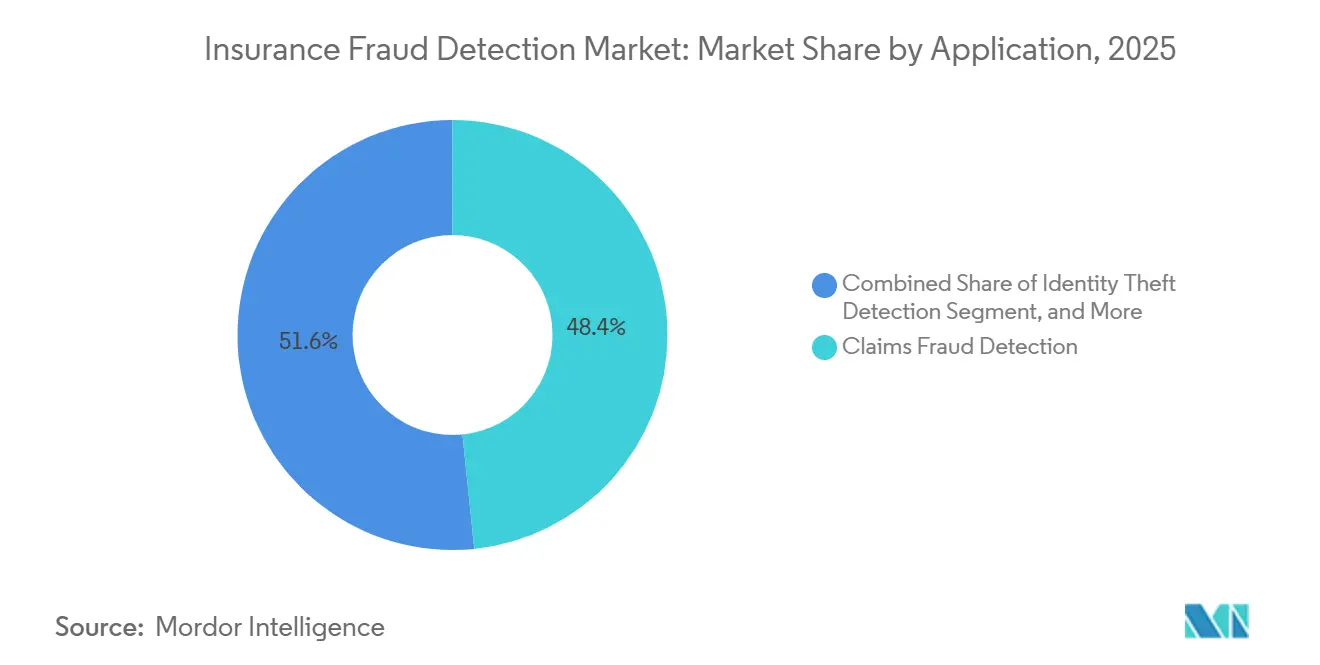
- By application, claims fraud detection led with a 48.39% share of the insurance fraud detection market in 2025, whereas identity-theft detection is set to advance at a 19.82% CAGR to 2031.
- By end user, property and casualty insurance accounted for 47.93% of 2025 revenue; health insurance is expected to expand at a 19.67% CAGR through 2031.
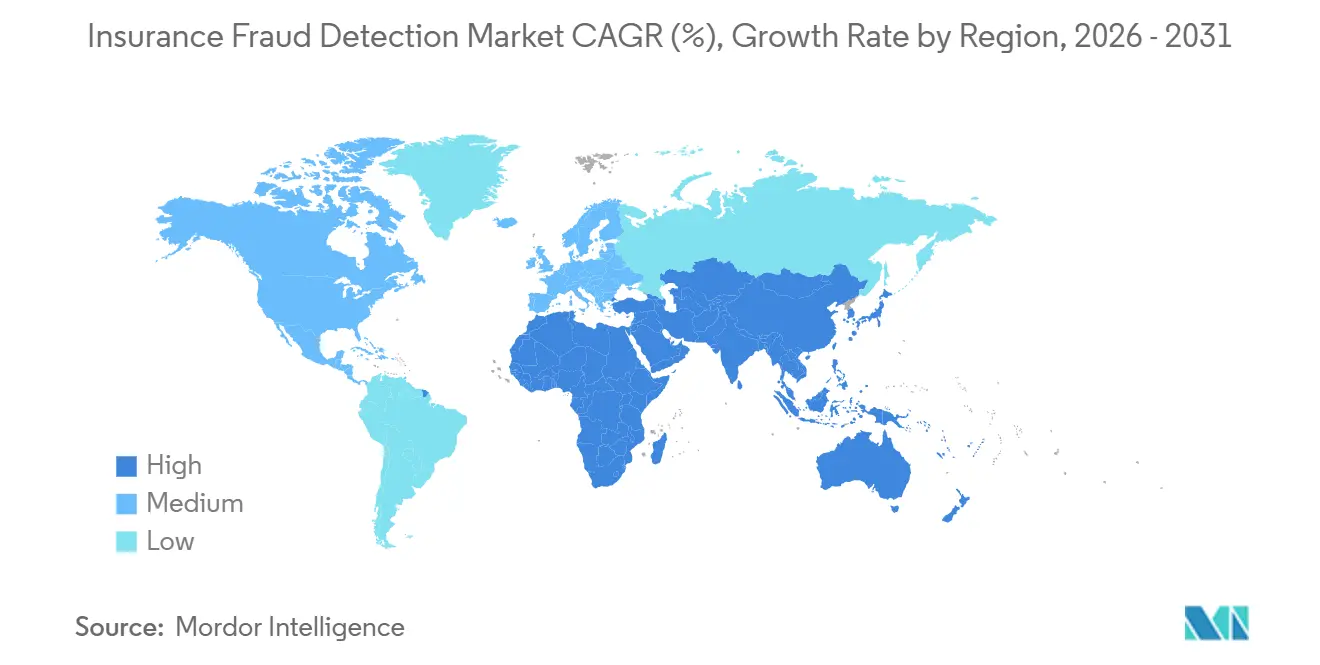
- By geography, North America retained a 39.62% share of the insurance fraud detection market in 2025; Asia-Pacific registers the fastest growth at 19.89% over 2026-2031.
Note: Market size and forecast figures in this report are generated using Mordor Intelligence’s proprietary estimation framework, updated with the latest available data and insights as of 2026.
Global Insurance Fraud Detection Market Trends and Insights
Drivers Impact Analysis*
| Driver | (~) % Impact on CAGR Forecast | Geographic Relevance | Impact Timeline |
|---|---|---|---|
| Expanding Volume of Digital Claims Data | +4.2% | Global, with early gains in North America, Europe, and Asia-Pacific urban centers | Medium term (2-4 years) |
| Growing Adoption of Predictive Analytics and AI | +5.1% | Global, concentrated in North America, Western Europe, and Asia-Pacific developed markets | Short term (≤ 2 years) |
| Increasing Regulatory Pressure to Reduce Fraud Losses | +3.8% | North America and Europe core, spillover to Asia-Pacific and Middle East | Medium term (2-4 years) |
| Rising Sophistication of Organized Fraud Rings | +2.9% | Global, with heightened impact in North America, Europe, and Asia-Pacific metropolitan regions | Long term (≥ 4 years) |
| Proliferation of Real-Time Data Sources (Telematics, IoT) | +3.6% | Asia-Pacific core, expanding to North America and Europe | Medium term (2-4 years) |
| Emergence of On-Demand Insurance Models | +2.1% | Asia-Pacific and North America early adopters, gradual spread to Europe and Middle East | Long term (≥ 4 years) |
| Source: Mordor Intelligence | |||
Expanding Volume of Digital Claims Data
Insurers processed more than 1.2 billion mobile-first claims in 2025, overwhelming batch-oriented fraud engines that rely on static business rules. Photo, video, and geolocation files require computer vision and natural language models that can triage unstructured inputs in seconds. Early adopters reported 30% fewer false positives after deploying multimodal analytics, which freed investigators to focus on high-severity alerts. The volume of incoming evidence also increases consent-management complexity, as customers may withdraw permission to use personal images at any time under privacy statutes. Vendors that offer elastic cloud storage combined with secure edge preprocessing are attracting carriers that need to keep pace with nonstop claim uploads, strengthening growth in the insurance fraud detection market.
Growing Adoption of Predictive Analytics and AI
Machine-learning deployment reached 62% of global insurers in 2025, up from 41% a year earlier, as carriers sought real-time fraud scores at the point of quote, accelerating innovation across the insurance fraud detection market. Platforms now fuse telematics, credit, and social-media data to identify suspicious behavior before policies bind. Deloitte projects that widespread adoption of artificial intelligence could save the sector USD 80 billion to USD 160 billion by 2032. Regulators are pushing for transparent models, prompting a wave of investments in explainability dashboards and bias audits that document every input feature.[1]NAIC, “Model Bulletin on Use of Artificial Intelligence by Insurers,” content.naic.org Vendors that balance high detection lift with granular traceability are winning multi-year enterprise contracts in North America and Western Europe.
Increasing Regulatory Pressure to Reduce Fraud Losses
India’s fraud-monitoring guidelines require every carrier to integrate law-enforcement data and report suspected cases within 30 days starting April 2026, driving fresh technology spending across the subcontinent. The U.S. National Association of Insurance Commissioners published a 2025 bulletin that requires annual fairness audits for any model that influences claims outcomes, elevating compliance to a board-level issue. Europe’s Artificial Intelligence Act classifies fraud detection as a high-risk use case, mandating conformity assessments and incident logs.[2]European Commission, “EU Artificial Intelligence Act: High-Risk Systems,” ec.europa.eu Converging mandates raise the cost of non-compliance and shift budgets toward platforms with built-in governance modules. Carriers that satisfy these rules early improve regulator trust and unlock faster product approvals.
Proliferation of Real-Time Data Sources
Connected vehicles now transmit second-by-second braking and location data, letting motor insurers validate accident narratives within minutes.[3]Verisk Analytics, “ISO ClaimSearch Telematics Integration,” verisk.com Health carriers ingest wearable heart rate and activity streams to uncover staged disability claims, while property lines monitor smart home sensors for water or fire anomalies. Asia-Pacific insurers lead this shift because high smartphone penetration and government telematics incentives lower data-collection barriers. Microsoft Azure’s confidential-computing service encrypts data while models run, enabling hybrid workflows that respect data-sovereignty rules. Real-time ingestion sharpens risk scores but also forces carriers to invest in low-latency networks and edge preprocessing nodes.
Restraints Impact Analysis*
| Restraint | (~) % Impact on CAGR Forecast | Geographic Relevance | Impact Timeline |
|---|---|---|---|
| Data Privacy and Consent Constraints | -2.7% | Europe and North America core, expanding to Asia-Pacific and South America | Short term (≤ 2 years) |
| Integration Complexity with Legacy Core Systems | -2.3% | Global, with acute challenges in North America and Europe mature markets | Medium term (2-4 years) |
| High Cost of Skilled Data Science Talent | -1.6% | Global, concentrated in North America, Europe, and Asia-Pacific technology hubs | Long term (≥ 4 years) |
| Bias and Fairness Concerns in AI Models | -1.9% | North America and Europe regulatory focus, spillover to Asia-Pacific | Medium term (2-4 years) |
| Source: Mordor Intelligence | |||
Data Privacy and Consent Constraints
The European Union General Data Protection Regulation and California Consumer Privacy Act require explicit opt-ins before personal data can feed fraud models, shrinking usable datasets whenever policyholders refuse consent. India’s Digital Personal Data Protection Act allows claimants to demand human review of automated decisions, adding to the already-stressed workload of investigation teams. Multinational insurers must now design region-specific workflows that comply with the strictest standards, inflating project timelines and legal costs. Smaller carriers without in-house counsel incur higher per-policy compliance expenses, which slow the adoption of cloud-based analytics. Vendors offering granular consent management and automated deletion routines gain a competitive edge.
Integration Complexity with Legacy Core Systems
Many carriers still operate mainframe policy platforms installed in the 1990s, which lack application programming interfaces for real-time scoring. Custom middleware projects can last 18-24 months and cost up to USD 15 million for a mid-sized insurer, delaying return on fraud-detection investments. Hybrid architectures attempt to bridge this gap by sending tokenized feature sets to cloud models and routing results back on-premise, yet version drift between rule engines and machine-learning models can introduce latency. Guidewire, Duck Creek, and Majesco now ship pre-built connectors, but uptake remains slow where board approval is needed for core-system changes. Insurers that modernize legacy stacks early unlock faster claims decisions and lower total cost of ownership.
*Our forecasts treat driver/restraint impacts as directional, not additive. The impact forecasts reflect baseline growth, mix effects, and variable interactions.
Segment Analysis
By Component: Services Advance on the Strength of Governance Demand
Software held 63.44% of component revenue in 2025, yet services are expanding at a 19.07% CAGR, which will lift their share of the insurance fraud detection market through 2031. The surge reflects mounting needs for bias audits, model retraining, and regulator-ready documentation that many carriers prefer to outsource rather than build internally. Services vendors now bundle implementation consulting with recurring managed-detection subscriptions, converting one-time license buyers into long-lived revenue streams. As insurance fraud detection market share for services rises, software providers respond by embedding audit trails and fairness dashboards directly into core platforms to defend against account stickiness.
The shift favors consultancies that maintain expertise across multiple governance regimes, including the National Association of Insurance Commissioners bulletin in the United States and the European Union Artificial Intelligence Act. They deliver risk-based pricing that aligns monthly fees with recovered fraud savings, an approach that resonates with finance teams under margin pressure. Oracle, SAP, and IBM have launched service-heavy subscription tiers that couple platform access with continuous monitoring, shortening procurement cycles for midsize carriers that lack in-house data scientists. Over the forecast horizon, demand for evidence-ready compliance artifacts will keep service growth ahead of software growth, even as low-code tools reduce initial deployment effort.


By Deployment Mode: Hybrid Models Bridge Cloud Economics and Data Control
Cloud implementations captured 58.46% revenue in 2025, but hybrid deployments clock the fastest 19.34% CAGR, positioning them to gain insurance fraud detection market share before 2031. Hybrid lets carriers process sensitive claims data on-premise while sending tokenized features to cloud models, an architecture that satisfies data-sovereignty rules in jurisdictions such as Germany and Japan. Confidential-computing enclaves on Microsoft Azure and similar platforms encrypt data in use, making hybrid environments palatable to risk-averse compliance teams. Edge gateways further cut latency by compressing images and extracting fraud-relevant features close to the data source, ensuring real-time scoring even when wide-area bandwidth is thin.
Complexity persists because model versions in the cloud must remain synchronized with on-premises rule engines to avoid scoring drift. Vendors offer unified orchestration layers that automate rollout and rollback across tiers, enabling insurers to adopt agile release cycles without breaching audit controls. Sovereign-cloud investments from regional hyperscalers lower jurisdictional barriers and bring additional compute choices to conservative markets. As a result, the insurance fraud detection market size tied to hybrid projects will continue to accelerate, especially among national carriers that run mixed mainframe and microservice estates.
By Organization Size: Small and Medium Enterprises Embrace Subscription Flexibility
Large enterprises accounted for 69.71% of 2025 spending, yet small and medium enterprises logged a 19.11% CAGR, steadily increasing their share of the insurance fraud detection market. Low-entry software-as-a-service bundles give regional carriers and specialty underwriters instant access to the same multimodal analytics that top-tier insurers deploy. Usage-based pricing minimizes capital outlay, while managed-service options remove the need for in-house data-science talent. Embedded-insurance platforms popular with banks and mobility operators further lower technical barriers by including fraud scoring as a built-in feature.
Despite momentum, integration can still stall when policy-administration systems lack open standards. Vendors are countering with application programming interfaces that conform to ACORD schemas, enabling smaller insurers to connect without custom middleware. Many also add self-service configuration wizards that let non-technical staff tweak risk thresholds, speeding go-live dates. Over time, value-based contracts that tie subscription fees to confirmed fraud recoveries will reinforce adoption, ensuring that the insurance fraud detection market share owned by small and medium enterprises grows faster than overall market expansion.
By Application: Identity Theft Detection Outpaces Traditional Claims Controls
Claims fraud detection accounted for 48.39% of application revenue in 2025, but identity-theft detection is advancing at a 19.82% CAGR, expanding its market share in insurance fraud detection each year. Synthetic personas now exploit quick digital onboarding to open multiple policies and submit coordinated losses, pressuring carriers to verify identities upstream. New models cross-link public records, device fingerprints, and behavioral biometrics to spot anomalies before policies bind. At the claim stage, natural-language engines compare narrative statements against prior submissions to flag recycled story lines.
Unified platforms that analyze quote, claim, and payment transactions in a single graph database reveal organized rings that hop among fraud vectors. Early adopters report double-digit improvements in detection lift when they retire siloed tools and move to lifecycle analytics. Vendor roadmaps now include zero-trust identity graphs and document-forgery sensors that read pixel-level artifacts, creating a fresh level of differentiation. As digital distribution continues to compress underwriting cycles, the insurance fraud detection market size linked to identity-centric modules will grow faster than any other application cluster.

By End User: Health Insurance Leads Future Spending Curves
Property and casualty lines maintained 47.93% of 2025 outlays, yet health carriers registered a 19.67% CAGR, rapidly scaling their contribution to the insurance fraud detection market. National claims exchanges, such as the All-Payer Claims Database in the United States and India’s National Health Claims Exchange, aggregate billing data across payers, making it easier to pinpoint duplicate charges and unbundling schemes. Artificial-intelligence engines now compare provider invoices against peer cohorts and evidence-based treatment pathways, flagging outliers in seconds.
Growth also stems from the surge in telehealth, where virtual consultations raise new verification challenges around patient identity and service authenticity. Generative models summarize lengthy electronic medical records, speeding investigator review without exposing personal details to human coders. Life insurers adopt similar approaches to confirm applicant disclosures, while reinsurers pilot shared ledgers that blocklist repeat offenders across cedant boundaries. Together, these shifts elevate health payers as the fastest contributor to incremental revenue, increasing their insurance fraud detection market share through the forecast horizon.
Geography Analysis
North America retained 39.62% of the insurance fraud detection market share in 2025, underscoring its status as the largest regional buyer of advanced analytics platforms. Regulatory catalysts, such as the National Association of Insurance Commissioners bulletin and Colorado’s Artificial Intelligence Act, require carriers to conduct annual fairness audits, pushing technology budgets toward the development of explainability dashboards. United States carriers balance proprietary builds with software-as-a-service subscriptions, while Canada’s patchwork of provincial rules complicates cross-border platform rollouts and lengthens implementation cycles. Mexico’s low insurance penetration limits spend, yet cross-border auto-fraud pressures drive adoption of telematics-enabled verification tools that validate accident locations.
Asia-Pacific posts the fastest regional CAGR of 19.89%, positioning it to drive the insurance fraud detection market to a larger size than any other geography through 2031. India’s mandate requiring every insurer to deploy an integrated fraud-monitoring framework by April 2026 is unlocking hundreds of millions of dollars in new investments. China’s digital insurers formed a big-data alliance in 2025 that shares anonymized patterns, trimming duplicate investigations and accelerating blocklist updates. Japan is migrating from manual audits to anomaly scoring after a 2025 investigation uncovered systemic life-insurance misrepresentation, prompting carriers to integrate third-party validation feeds. South Korea’s 15-day fraud-reporting deadline and Hong Kong’s regulatory cohort programs round out a regionwide push toward real-time analytics.
Europe, the Middle East and Africa, and South America contribute smaller but steadily rising slices of global demand. The European Union Artificial Intelligence Act classifies fraud detection as a high-risk category, compelling conformity assessments that favor vendors with built-in audit trails. United Kingdom guidance on discriminatory outcomes widens spending on bias mitigation, while Germany’s data-sovereignty rules keep many deployments on private cloud. The United Arab Emirates encourages pilot projects but lacks uniform privacy codes, leading insurers to adopt modular platforms they can localize quickly. Brazil’s guidance linking product approvals to fraud-prevention capabilities nudges carriers toward modern tools, though overall spend remains capped by low insurance density and macroeconomic volatility.

Competitive Landscape
The insurance fraud detection market remains moderately fragmented, with no vendor exceeding 15% global revenue share, creating ongoing opportunities for both legacy analytics giants and nimble insurtech challengers. SAS Institute, IBM, and Fair Isaac Corporation leverage decades of actuarial data and entrenched policy-administration integrations to cross-sell fraud modules inside broader risk suites. Their scale supports large-volume benchmarks and global support desks that appeal to tier-one carriers with complex multi-line portfolios.
Specialized entrants, including Shift Technology, Friss, and DataRobot, win business through consumption-based pricing, rapid cloud deployment, and model transparency that satisfy newer algorithmic accountability mandates. July 2024 Series D funding gave Shift Technology a USD 100 million war chest to expand across Japan and Southeast Asia, where carriers prize turnkey connectors for telematics devices and Internet-of-Things sensors. Friss offers pre-built rulesets tuned to regional fraud typologies, helping mid-tier insurers achieve double-digit uplift without lengthy data-science projects.
Technology conglomerates such as Microsoft, Oracle, and SAP are knitting fraud analytics into wider financial-crimes platforms, compressing procurement cycles for insurers already standardized on those clouds. Microsoft Azure’s confidential-computing features let carriers process encrypted claims data, tipping risk-averse buyers toward its stack. Oracle and SAP bundle continuous-monitoring services, converting license deals into recurring subscriptions that tie fees to recovered fraud savings. Consolidation is on the horizon as carriers favor unified, multi-line detection engines over point solutions, and vendors with built-in governance dashboards and lifecycle analytics are poised to capture the next wave of share gains.
Insurance Fraud Detection Industry Leaders
SAS Institute Inc.
IBM Corporation
Fair Isaac Corporation
BAE Systems plc
Experian plc
- *Disclaimer: Major Players sorted in no particular order

Recent Industry Developments
- January 2026: Microsoft Azure extended confidential-computing support to insurance workloads, letting carriers run fraud models on encrypted claims inside secure enclaves.
- December 2025: India’s Insurance Regulatory and Development Authority finalized fraud-monitoring guidelines requiring dedicated detection units by Apr 2026.
- October 2025: Oracle released an integrated financial-crimes and compliance suite that cut false positives 35% in pilot insurers.
- September 2025: Hong Kong’s Insurance Authority launched an Artificial Intelligence Cohort Program with seven carriers to test fraud models and transparency standards.


Global Insurance Fraud Detection Market Report Scope
The Insurance Fraud Detection Market Report is Segmented by Component (Software, and Services), Deployment Mode (On-Premise, Cloud-Based, Hybrid), Organization Size (Large Enterprises, and Small and Medium Enterprises), Application (Claims Fraud Detection, Underwriting Fraud, Identity Theft Detection, Payment and Billing Fraud, Other Applications), End User (Property and Casualty Insurance, Life Insurance, Health Insurance, Other End Users), and Geography (North America, South America, Europe, Asia-Pacific, Middle East and Africa). The Market Forecasts are Provided in Terms of Value (USD).
| Software |
| Services |
| On-Premise |
| Cloud-Based |
| Hybrid |
| Large Enterprises |
| Small and Medium Enterprises |
| Claims Fraud Detection |
| Underwriting Fraud |
| Identity Theft Detection |
| Payment and Billing Fraud |
| Other Applications |
| Property and Casualty Insurance |
| Life Insurance |
| Health Insurance |
| Other End Users |
| North America | United States | |
| Canada | ||
| Mexico | ||
| South America | Brazil | |
| Argentina | ||
| Rest of South America | ||
| Europe | United Kingdom | |
| Germany | ||
| France | ||
| Italy | ||
| Rest of Europe | ||
| Asia Pacific | China | |
| Japan | ||
| India | ||
| South Korea | ||
| Rest of Asia Pacific | ||
| Middle East and Africa | Middle East | United Arab Emirates |
| Saudi Arabia | ||
| Rest of Middle East | ||
| Africa | South Africa | |
| Egypt | ||
| Rest of Africa | ||
| By Component | Software | ||
| Services | |||
| By Deployment Mode | On-Premise | ||
| Cloud-Based | |||
| Hybrid | |||
| By Organization Size | Large Enterprises | ||
| Small and Medium Enterprises | |||
| By Application | Claims Fraud Detection | ||
| Underwriting Fraud | |||
| Identity Theft Detection | |||
| Payment and Billing Fraud | |||
| Other Applications | |||
| By End User | Property and Casualty Insurance | ||
| Life Insurance | |||
| Health Insurance | |||
| Other End Users | |||
| By Geography | North America | United States | |
| Canada | |||
| Mexico | |||
| South America | Brazil | ||
| Argentina | |||
| Rest of South America | |||
| Europe | United Kingdom | ||
| Germany | |||
| France | |||
| Italy | |||
| Rest of Europe | |||
| Asia Pacific | China | ||
| Japan | |||
| India | |||
| South Korea | |||
| Rest of Asia Pacific | |||
| Middle East and Africa | Middle East | United Arab Emirates | |
| Saudi Arabia | |||
| Rest of Middle East | |||
| Africa | South Africa | ||
| Egypt | |||
| Rest of Africa | |||


Key Questions Answered in the Report
What is the projected size of the insurance fraud detection market by 2031?
It is forecast to reach USD 20.22 billion by 2031, growing at an 18.87% CAGR over 2026-2031.
Which deployment model is expanding fastest?
Hybrid architectures are advancing at a 19.34% CAGR as carriers balance cloud scalability with data-sovereignty needs.
Why are services gaining share versus software?
Carriers increasingly outsource bias audits, model tuning, and regulatory documentation, driving a 19.07% CAGR for services.
Which application will register the highest growth rate?
Identity-theft detection, fueled by synthetic-identity schemes, is projected to grow at 19.82% CAGR through 2031.
How are regulations influencing technology spending?
Mandates from bodies such as NAIC, IRDAI, and the EU Artificial Intelligence Act require explainability and audit trails, pushing insurers toward platforms that include built-in governance features.
Which region shows the fastest market expansion?
Asia-Pacific leads with a 19.89% CAGR due to new fraud-monitoring requirements and collaborative data-sharing initiatives.
Page last updated on:


