Deception Technology Market Size and Share
Market Overview
| Study Period | 2020 - 2031 |
|---|---|
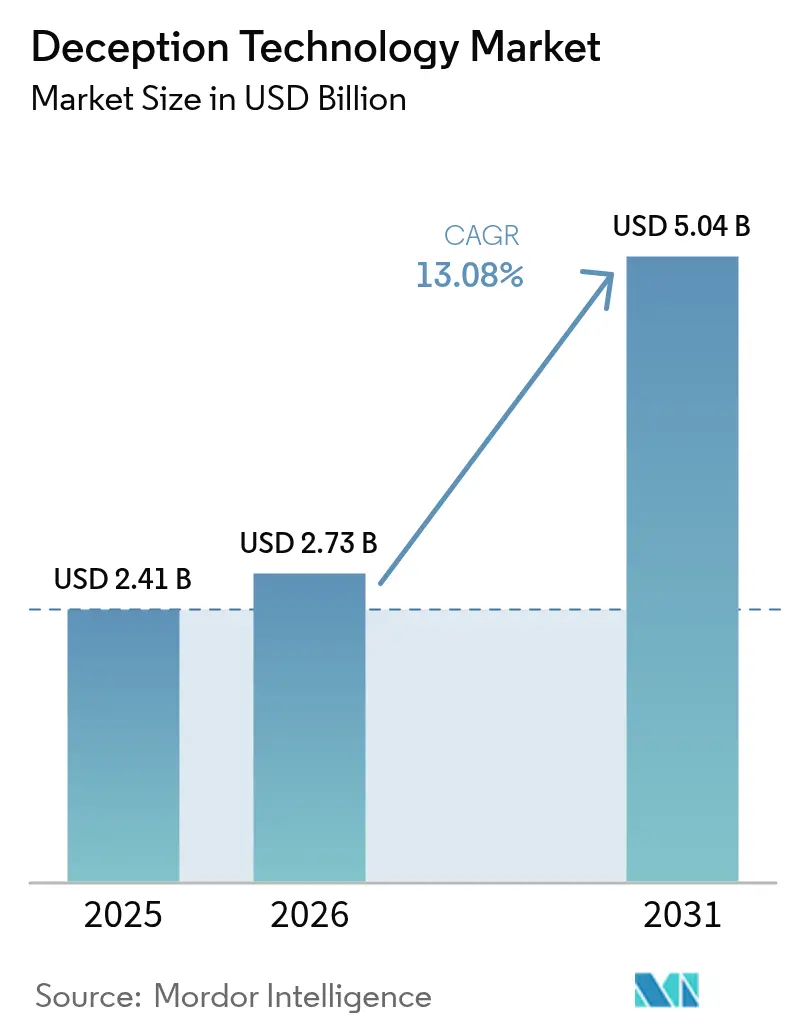
| Market Size (2026) | USD 2.73 Billion |
| Market Size (2031) | USD 5.04 Billion |
| Growth Rate (2026 - 2031) | 13.08% CAGR |
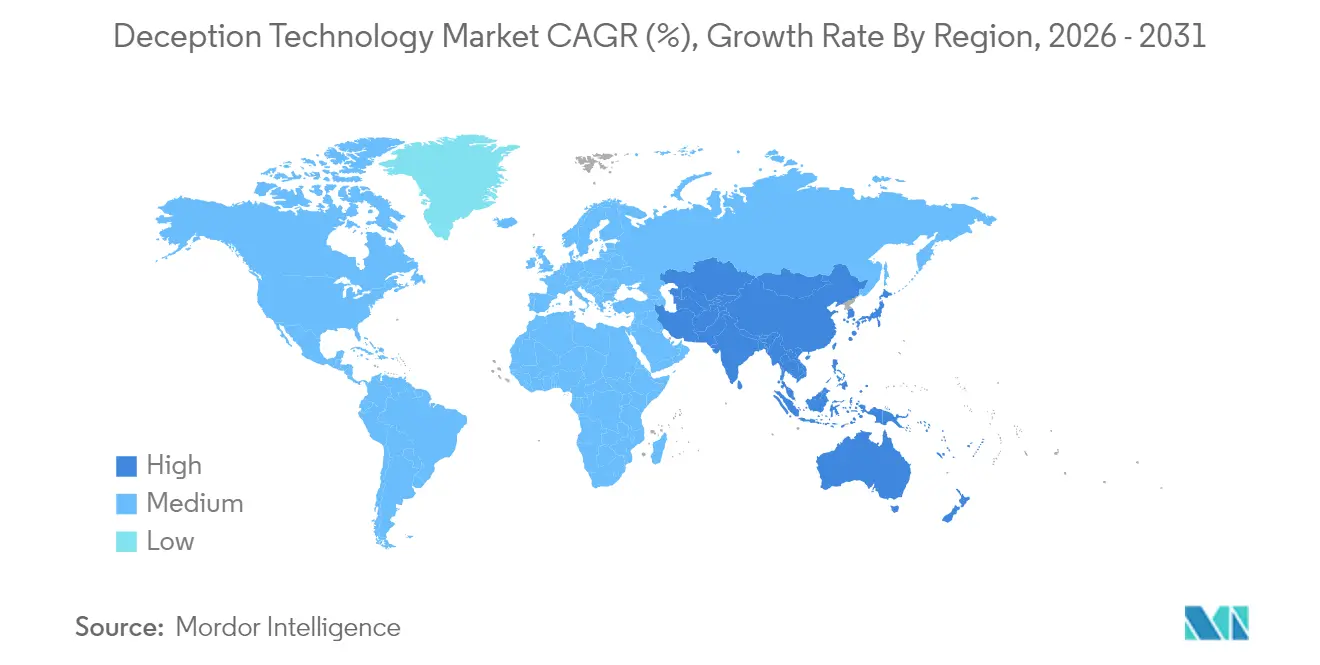
| Fastest Growing Market | Asia Pacific |
| Largest Market | North America |
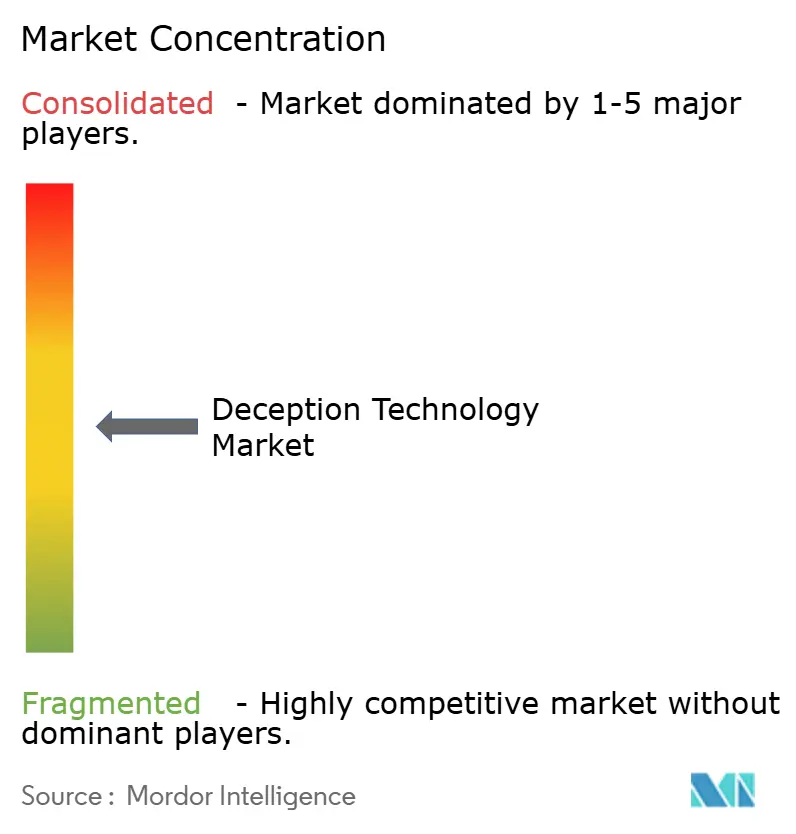
| Market Concentration | Medium |
Major Players *Disclaimer: Major Players sorted in no particular order Image © Mordor Intelligence. Reuse requires attribution under CC BY 4.0. | |
Deception Technology Market Analysis by Mordor Intelligence
The deception technology market size was valued at USD 2.41 billion in 2025 and estimated to grow from USD 2.73 billion in 2026 to reach USD 5.04 billion by 2031, at a CAGR of 13.08% during the forecast period (2026-2031). Rising zero-day exploits, AI-driven deepfake fraud, and cloud-native workload expansion compel security teams to adopt early-warning controls that spot attackers inside the network before damage occurs. Vendors now weave decoys into zero-trust micro-segmentation, giving defenders tripwires that work even when identities or endpoints are compromised. Demand also accelerates because cyber-insurance carriers require proactive lateral-movement detection as a condition for favorable premiums. Although North America keeps spending leadership, the deception technology market gains rapid momentum in Asia-Pacific as multicloud adoption surges and local regulators tighten breach-notification rules.
Key Report Takeaways
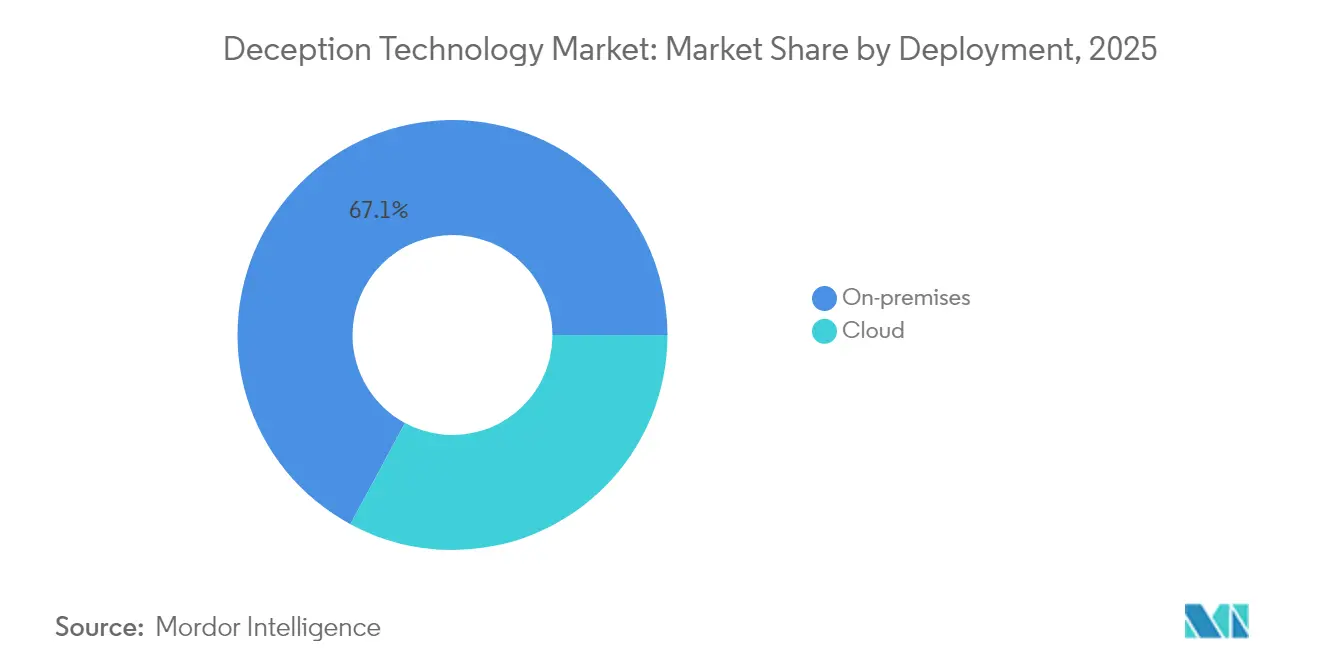
- By deployment, on-premises models led with 67.12% of deception technology market share in 2025, while cloud implementation records the fastest 14.84% CAGR through 2031.
- By organization size, large enterprises captured 69.55% revenue in 2025; the SME segment is projected to expand at 14.41% CAGR to 2031.
- By service, managed services accounted for 67.93% of the deception technology market size in 2025 and are set to post a 14.28% CAGR through 2031.
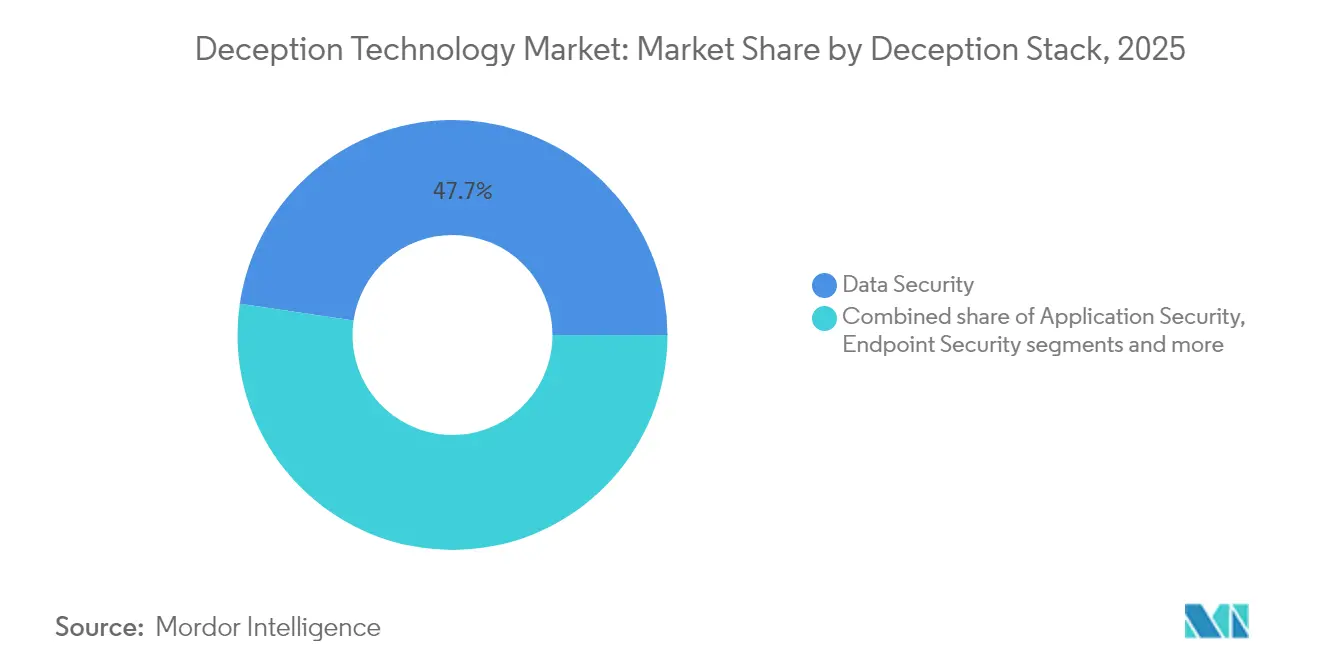
- By deception stack, data security remained dominant at 47.68% share in 2025, whereas endpoint security is forecast to grow 13.81% annually to 2031.
- By end-user, BFSI held 35.72% share in 2025; healthcare is forecast to grow at a 13.17% CAGR.
- By geography, North America contributed 41.35% revenue in 2025; Asia-Pacific will grow fastest at 13.44% CAGR to 2031.
Note: Market size and forecast figures in this report are generated using Mordor Intelligence’s proprietary estimation framework, updated with the latest available data and insights as of 2026.
Global Deception Technology Market Trends and Insights
Drivers Impact Analysis*
| Driver | (~) % Impact on CAGR Forecast | Geographic Relevance | Impact Timeline |
|---|---|---|---|
| Surge in zero-day exploits and targeted APTs | 3.2% | Global, with concentration in North America & Europe | Short term (≤ 2 years) |
| Escalating cloud-native workloads broaden attack surface | 2.8% | Global, led by APAC and North America | Medium term (2-4 years) |
| CISO preference for low-friction, agent-less detection tools | 2.1% | North America & Europe, expanding to APAC | Medium term (2-4 years) |
| Rise of AI-generated deepfake identity attacks | 1.9% | Global, with early impact in BFSI and government sectors | Short term (≤ 2 years) |
| Convergence of deception with zero-trust micro-segmentation | 1.7% | North America & Europe, gradual APAC adoption | Long term (≥ 4 years) |
| Cyber-insurance policies demanding proactive lateral-movement detection | 1.6% | North America & Europe, emerging in APAC | Medium term (2-4 years) |
| Source: Mordor Intelligence | |||


Surge in Zero-Day Exploits and Targeted APTs
State-sponsored collectives automate reconnaissance with AI, finding novel vulnerabilities faster than signature-based defenses adapt. The Institute for Security and Technology notes that automated reconnaissance compresses attacker dwell time, forcing defenders to rethink reactive playbooks. Deception platforms insert believable but fake assets that weaponize curiosity; once probed, alerts trigger in seconds while production systems stay untouched. Because detection is based on attacker behavior rather than threat-intelligence feeds, the deception technology market provides resilience against bespoke malware that evades hash-matching controls. Vendors now pre-package decoys for industrial control systems and SaaS APIs, reflecting attacker pivot toward operational technology.
Escalating Cloud-Native Workloads Broaden Attack Surface
Containerized and serverless applications can spin up and down within minutes, leaving security operations centers blind to east-west traffic. Zscaler deploys generative-AI decoys that mimic large-language-model endpoints, luring attackers into instrumented sandboxes[1]Zscaler, “Zscaler Introduces Generative AI Decoys for Cloud-Native Environments,” zscaler.com. Because decoys scale automatically inside Kubernetes namespaces, defenders gain continuous coverage even as underlying microservices change. The deception technology market capitalizes on cloud providers’ metadata APIs to place traps inside virtual private clouds without installing agents. As organizations adopt multi-cloud strategies, cross-provider decoy orchestration becomes a buying criterion, especially in regulated industries that cannot centralize logs in a single region.
CISO Preference for Low-Friction, Agent-Less Detection Tools
Tool sprawl produces alert fatigue and ballooning license costs. CISOs gravitate toward technologies that integrate smoothly, emit few false positives, and require little maintenance. Deception platforms meet these demands because asset placement is passive; nothing touches the endpoint. SC Media reports that organizations reduce mean-time-to-detect by 48 hours when shifting to deception-first strategies. Vendor dashboards now expose attack paths graphically, enabling junior analysts to act without deep forensics skills. These usability gains drive procurement, particularly in mid-market firms that lack specialized threat hunters.
Rise of AI-Generated Deepfake Identity Attacks
Voice cloning and synthetic video enable fraudsters to bypass traditional verification checks. Reality Defender recorded a 245% year-over-year spike in enterprise deepfake incidents, with one-quarter impacting finance workflows. Deception solutions respond by placing counterfeit executive credentials in privileged-access vaults; any authentication attempt against these phantom identities reveals compromise. Lucinity documented a USD 25 million transfer initiated through a deepfake video call, underscoring why real-time lateral-movement flags are crucial[2]Lucinity, “Arup Deepfake Case Study,” lucinity.com. The deception technology market embeds media-forensics hooks that score the authenticity of voice traffic, linking anomalies to specific network sessions for rapid containment.
Restraints Impact Analysis*
| Restraint | (~) % Impact on CAGR Forecast | Geographic Relevance | Impact Timeline |
|---|---|---|---|
| Entrenched reliance on legacy honeypots | -1.8% | Global, particularly in cost-sensitive SME segments | Long term (≥ 4 years) |
| Scarcity of deception-skilled SecOps staff | -1.5% | Global, acute in APAC and emerging markets | Medium term (2-4 years) |
| Adversary use of large-language-model recon to spot decoys | -1.2% | Advanced threat actors globally | Short term (≤ 2 years) |
| Budget cannibalization by bundled EDR/XDR platforms | -0.9% | North America & Europe enterprise segments | Medium term (2-4 years) |
| Source: Mordor Intelligence | |||
Entrenched Reliance on Legacy Honeypots
Many firms still run static honeypots deployed years ago. Attackers now fingerprint such assets through protocol quirks or uptime patterns, bypassing them with ease. This sunk-cost bias delays upgrades to adaptive decoys able to morph operating-system banners or rotate credentials automatically. Legacy honeypots also demand manual log parsing, consuming resources that should focus on real attack paths. Because these tools produce few actionable alerts, boards question ROI, thereby constraining new investment and dampening growth of the deception technology market.
Scarcity of Deception-Skilled SecOps Staff
Deploying credible decoys requires knowledge of attacker psychology, asset valuation, and network topology. Universities seldom teach these skills, so employers compete for a limited talent pool. Shortfalls are most acute in Asia-Pacific, where cybersecurity curricula concentrate on compliance rather than active defense. To close the gap, vendors embed guided workflows and offer managed services, but salaries for deception architects still command premiums that small enterprises cannot match. This workforce constraint slows broad adoption even though the technology’s value proposition is widely acknowledged.
*Our forecasts treat driver/restraint impacts as directional, not additive. The impact forecasts reflect baseline growth, mix effects, and variable interactions.
Segment Analysis
By Deployment: Cloud Acceleration Despite On-Premises Dominance
On-premises deployment commanded 67.12% of deception technology market share in 2025, illustrating enterprises’ need to keep high-interaction decoys close to crown-jewel systems for compliance and forensic control. That control, however, brings hardware refresh cycles and change-management overhead that limit agility. Cloud deployment contributes a modest slice today but is slated to rise at a 14.84% CAGR through 2031, the fastest pace within the deception technology market. Cloud-based consoles spin up decoys across regions within minutes, making them attractive for global branch rollouts.
Hybrid models emerge as a pragmatic bridge, letting teams place sensitive database decoys on-premises while offloading analysis and scaling tasks to public clouds. As multicloud adoption rises, buyers demand single-pane views across AWS, Azure, and Google Cloud, pushing providers to invest in identity federation and immutable infrastructure blueprints. These capabilities enhance the deception technology market size for cloud modules and convince regulation-bound sectors that shared-responsibility models can still satisfy audit controls.


By Organization Size: SMEs Drive Adoption Through Managed Services
Large enterprises retained 69.55% revenue share in 2025 and continue shaping feature roadmaps by insisting on API depth, MITRE ATT&CK alignment, and advanced analytics. Yet SMEs now register a 14.41% growth trajectory, outpacing big-company spending within the deception technology market. Subscription-based managed deception services, billed per asset, cut entry barriers and deliver curated alerts that fit smaller teams’ bandwidth.
Savings compound because cloud consoles eliminate hardware purchase, allowing SMEs to reallocate capital toward employee awareness programs. For vendors, the segment’s scale effect is compelling; thousands of mid-sized customers can equal the license revenue of a handful of Fortune 500 accounts. Consequently, roadmap priorities now include low-code playbooks and automated decoy placement, features designed to compress onboarding from weeks to hours and thereby expand deception technology market size among smaller firms.
By Service: Managed Services Dominate Through Operational Efficiency
Managed services represented 67.93% of the deception technology market size in 2025, a reflection of buyer preference for turnkey operations that offer measurable risk-reduction without headcount spikes. Growth remains brisk at 14.28% CAGR because service providers integrate deception layers with 24×7 security operations centers, handing clients curated attack timelines rather than raw logs.
Professional services still play a vital role in day-zero architecture assessments, regulatory mapping, and red-team validation. However, once baseline deployment is done, most organizations prefer subscription renewals to internal tooling. Vendors upsell premium tiers that include annual breach simulations, threat-intel enrichment, and automatic decoy refresh, driving predictable recurring revenue while broadening overall deception technology market.
By Deception Stack: Data Security Leads While Endpoint Security Accelerates
Data-centric deception kept 47.68% share in 2025 as privacy regulations impose stiff fines for record exposure. Finance and healthcare clients deploy fake database tables and document lures to spot illicit queries against personal data. This dominance underlines why the deception technology market remains tightly coupled with governance, risk, and compliance priorities.
Endpoint security decoys, though smaller today, are growing at 13.81% annually. Remote workforces, bring-your-own-device policies, and ransomware spikes drive investment in fake process trees, memory artifacts, and local credential stores that look indistinguishable from actual laptops. Integration with EDR telemetry allows security teams to pivot from detection to device isolation in seconds, raising the combined value proposition and expanding deception technology market share for endpoint-focused solutions.
By End-User: BFSI Leadership with Healthcare Acceleration
The BFSI sector held 35.72% revenue in 2025, reflecting banks’ and insurers’ low tolerance for insider fraud and credential-stuffing risk. High-interaction decoys now imitate SWIFT terminals and trading platforms, enabling head-office SOCs to trace lateral-movement attempts that aim at payment systems.
Healthcare records command high prices on underground forums, explaining why the segment is expected to grow 13.17% annually. Hospital networks deploy medical device decoys that mimic infusion pumps or radiology equipment, catching threat actors targeting Internet-of-Medical-Things attack surfaces. Budget boosts come as regulators tighten breach-notification timetables, reinforcing the business case for the deception technology market in clinical settings.
Geography Analysis
North America generated 41.35% of revenue in 2025, buoyed by stringent mandates such as CISA’s directive on incident reporting and a concentration of Fortune 100 headquarters that can fund specialized controls. Federal contracts increasingly specify deception capabilities, further cementing the region’s leadership within the deception technology market.
Europe advances steadily as the NIS2 Directive broadens the scope of entities required to maintain proactive threat-detection programs Local vendors stress data-sovereignty features, ensuring logs stay inside EU borders. Emerging EU cloud providers now embed deception natively, offering compliance-ready bundles that appeal to mid-market industrial manufacturers.
Asia-Pacific remains the fastest-growing territory at 13.44% CAGR. Governments in Japan, India, and Singapore launch grant programs that co-fund zero-trust pilots incorporating deception. Telecom rollouts of 5G standalone cores enlarge attack surfaces, pushing operators to install signaling-protocol decoys that detect rogue base-station registration attempts. These initiatives collectively enlarge deception technology market size in the region. Meanwhile, Latin America and Middle East and Africa start integrating deception into critical-infrastructure revamps, although budget constraints and talent gaps temper near-term uptake.

Competitive Landscape
Top Companies in Deception Technology Market
The deception technology market shows moderate fragmentation. Large cybersecurity suites integrate native deception modules, while specialist pure-plays innovate aggressively on AI-driven lures. Illusive Networks’ integration with CrowdStrike Falcon enriches endpoint telemetry with deception-triggered attribution, slashing average dwell time by 60%[4]CrowdStrike, “Illusive Networks Integration Unlocks Endpoint Deception,” crowdstrike.com. Zscaler collaborates with NVIDIA to accelerate model-based decoy generation that adapts to attacker behavior in real time.
Mergers and acquisitions reshapes boundaries: Google’s USD 32 billion purchase of Wiz expands cloud-native coverage, while CyberArk’s Venafi acquisition injects machine-identity risk data into decoy placement logic. Start-ups such as CyberTrap target mid-size European firms with subscription bundles combining deception and managed detection, capitalizing on skills shortages. For incumbents, proof-of-value cycles focus on measurable ROI—principally reduced mean-time-to-detect and improved audit outcomes—as procurement boards grow wary of shelfware.
Competitive intensity is expected to rise as privacy-enhancing computation and quantum-safe protocols create new decoy formats. Vendors able to demonstrate seamless orchestration across endpoints, cloud, and operational technology, without adding analyst workload, will gain share. Conversely, firms that rely on static honeypot architectures risk marginalization as attackers exploit pattern recognition to evade detection, reinforcing dynamic deception as the baseline expectation within the deception technology market.
Deception Technology Industry Leaders
Illusive Networks
Commvault Systems Inc.
Smokescreen Technologies Pvt. Ltd
Attivo Networks Inc. (SentinelOne Inc.)
Rapid7 Inc.
- *Disclaimer: Major Players sorted in no particular order

Recent Industry Developments
- May 2025: Zscaler announced acquisition of Red Canary to fold MDR capabilities into Zero Trust Exchange.
- April 2025: Palo Alto Networks completed acquisition of Protect AI for USD 650–700 million, boosting AI governance coverage.
- April 2025: OpenAI led USD 43 million funding in Adaptive Security to grow AI attack-simulation services.
- March 2025: Google finalized USD 32 billion takeover of Wiz to reinforce multi-cloud security features.
- March 2025: Darktrace acquired Cado Security, adding AI-driven cloud forensics to its platform.
- February 2025: Sophos bought Secureworks for USD 859 million, merging XDR and identity deception analytics.


Research Methodology Framework and Report Scope
Market Definitions and Key Coverage
According to Mordor Intelligence, we size the deception technology market as all global revenue accruing from software-led platforms and attendant services that plant decoys, honey-tokens, and lures across endpoint, data, network, and application layers to detect, mislead, and study intruders already inside an enterprise environment. Values are reported in constant 2024 dollars.
Scope exclusion: pure hardware-only honeypot appliances sold strictly for academic testing remain outside this study's remit.
Segmentation Overview
- By Deployment
- On-premises
- Cloud
- By Organization Size
- Large Enterprises
- Small and Medium Enterprises (SMEs)
- By Service
- Managed Services
- Professional Services
- By Deception Stack
- Data Security
- Application Security
- Endpoint Security
- Network Security
- By End-User
- Government
- Defense
- BFSI
- IT and Telecommunication
- Healthcare
- Other End-Users
- By Geography
- North America
- United States
- Canada
- Mexico
- Europe
- Germany
- United Kingdom
- France
- Italy
- Spain
- Russia
- Rest of Europe
- Asia-Pacific
- China
- Japan
- India
- South Korea
- Australia and New Zealand
- Rest of Asia-Pacific
- South America
- Brazil
- Argentina
- Rest of South America
- Middle East and Africa
- Middle East
- Saudi Arabia
- United Arab Emirates
- Turkey
- Rest of Middle East
- Africa
- South Africa
- Nigeria
- Rest of Africa
- Middle East
- North America
Detailed Research Methodology and Data Validation
Primary Research
Discussions with CISOs, deception architects, MSSPs, and resellers across North America, Europe, and Asia let us test adoption rates, renewal cycles, and average selling prices that written material only hinted at. Follow-up surveys with midsize banks and healthcare providers closed gaps on managed-service penetration.
Desk Research
Our team began with public-domain datasets such as CERT advisories, NIST NVD, ENISA threat briefs, and Verizon's DBIR to spot breach patterns that trigger deception budgets. Insights were enriched with Cloud Security Alliance white papers, SANS incident notes, patent counts from Questel, and shipment traces for decoy hardware obtained via Volza.
Company 10-Ks, S-1 filings, and investor decks revealed contract sizes, while D&B Hoovers and Dow Jones Factiva helped break vendor revenue into deception-specific lines. The sources named illustrate our approach; many additional references supported data collection and validation.
Market-Sizing & Forecasting
We rebuild spending from the top down by isolating deception's share of global cybersecurity budgets and mapping it against breach frequency, mean time to detect, and SOC tooling outlays, which are then cross-checked with sampled vendor roll-ups and ASP times active decoy counts. Key inputs include cloud workload share, zero-day incident growth, average decoy density per 1,000 endpoints, regulatory mandates, and service attach rates. A multivariate ARIMA model projects 2025-2030 totals, with scenario tweaks where shocks emerge.
Data Validation & Update Cycle
Model results face peer review, variance flags trigger fresh calls, and outputs refresh each year, with interim updates issued when material events move the market. Before delivery, an analyst performs a final pass so clients receive our latest view.
Why Our Deception Technology Baseline Commands Reliability
Published figures often diverge because firms vary scope, base year, and currency treatment. By tracking only deception-specific revenue and refreshing inputs every twelve months, Mordor Intelligence furnishes a dependable point of reference.
Key gap drivers we observe include some publishers folding broader active-defense tools into totals, others converting regional sales at spot rather than average rates, and still others projecting growth without adjusting for ASP compression revealed in our interviews.
Benchmark comparison
| Market Size | Anonymized source | Primary gap driver |
|---|---|---|
| USD 2.41 B (2025) | Mordor Intelligence | - |
| USD 2.18 B (2024) | Global Consultancy A | Earlier base year and exclusion of managed services |
| USD 2.90 B (2024) | Regional Consultancy B | Bundles deception with wider active-defense platforms |
| USD 1.99 B (2024) | Trade Journal C | Counts software licenses only, omits subscription renewals |
In sum, the disciplined scope, dual-path modeling, and continuous validation we employ ensure Mordor's numbers remain balanced, transparent, and readily traceable for decision-makers.


Key Questions Answered in the Report
What is the current value of the deception technology market?
The market reached USD 2.73 billion in 2026 and is projected to climb to USD 5.04 billion by 2031.
Which segment is growing fastest within the deception technology market?
Cloud deployment is pacing the field with a 14.84% CAGR thanks to its agility and ease of rollout.
Why are insurers pushing companies toward deception solutions?
Many cyber-insurance policies now require proactive lateral-movement detection, and decoys provide verifiable evidence that attackers have breached internal networks.
How does deception technology help against deepfake attacks?
Vendors place fake executive identities and voice patterns within decoy systems so that any deepfake attempt trips an alert before real credentials are touched.
Which region is forecast to lead growth?
Asia-Pacific is expected to expand at a 13.44% CAGR as digital-transformation projects accelerate and regulators tighten security mandates.
Are deception platforms difficult to manage?
Modern offerings are agent-less and often delivered as managed services, letting even small security teams gain high-fidelity alerts without heavy operational overhead.
Page last updated on:


