
Industrial Tablet PC Market Size and Share
Market Overview
| Study Period | 2020 - 2031 |
|---|---|
| Market Size (2026) | USD 1.19 Billion |
| Market Size (2031) | USD 1.64 Billion |
| Growth Rate (2026 - 2031) | 6.50 % |
| Fastest Growing Market | Asia Pacific |
| Largest Market | North America |
| Market Concentration | Medium |
Major Players
*Disclaimer: Major Players sorted in no particular order Image © Mordor Intelligence. Reuse requires attribution under CC BY 4.0. |
|
Industrial Tablet PC Market Analysis by Mordor Intelligence
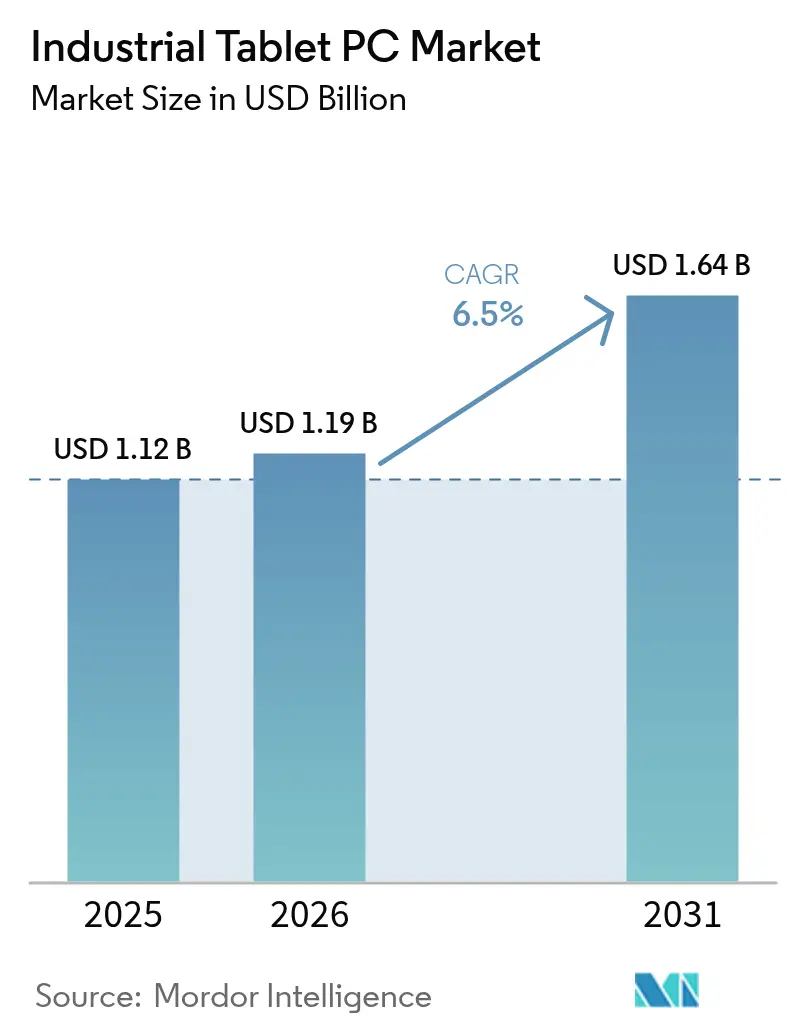
Industrial Tablet PC market size in 2026 is estimated at USD 1.19 billion, growing from 2025 value of USD 1.12 billion with 2031 projections showing USD 1.64 billion, growing at 6.50% CAGR over 2026-2031. Demand accelerates because factories, energy facilities, and logistics hubs require mobile computers that tolerate heat, dust, and vibration while feeding operational data directly into enterprise analytics platforms [1]Getac, “Unlocking Efficiency: The Power of Rugged Android Tablets for AI in Various Industries,” getac.com. Industry 4.0 adoption, private 5G roll-outs, and digitization mandates converge to make rugged tablets a default tool on shop floors, flight lines, and distribution centers. North America sustains the largest share owing to stringent quality regulations and a well-established automation base, while Asia Pacific outpaces all regions as manufacturers modernize and governments fund smart-factory programs. On the customer side, fleet owners and warehouse operators embrace connected workflows that demand durable screens, enterprise-grade wireless, and all-day batteries. Meanwhile, semiconductor shortages and custom-panel lead times pressure vendors to secure diversified supply chains or risk order backlogs that push buyers toward competitors with faster delivery.
Key Report Takeaways
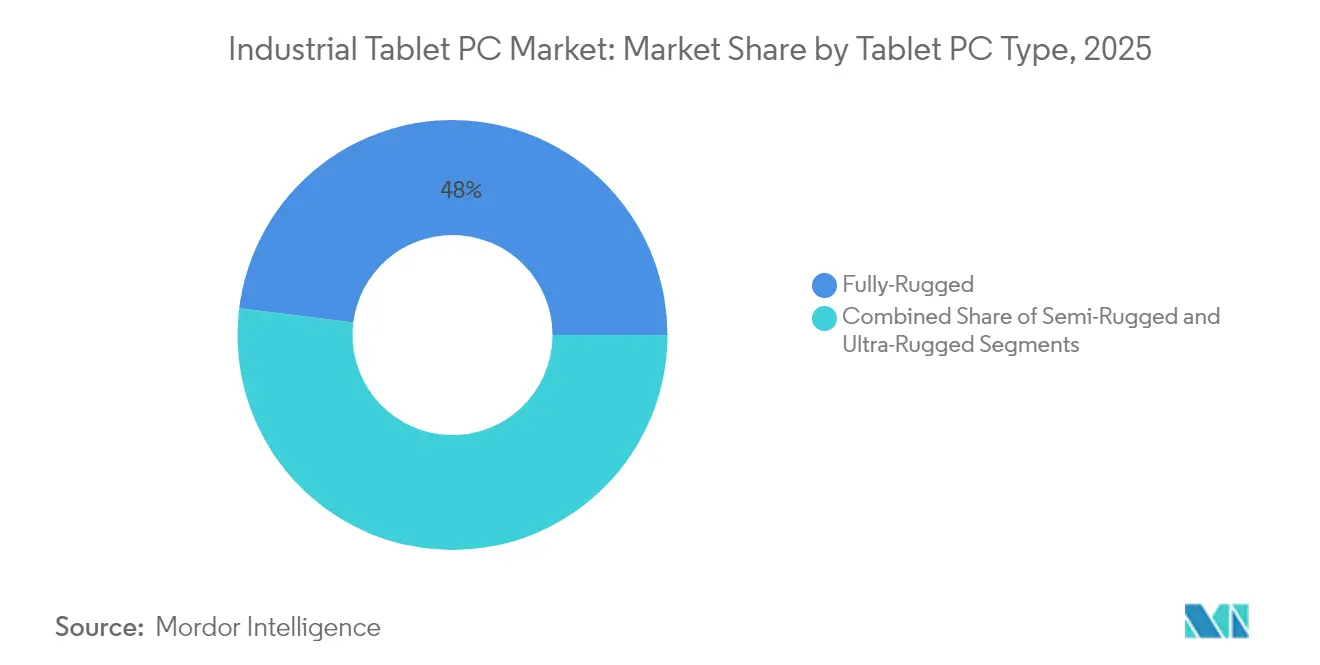
- By tablet PC type, fully-rugged tablets led with 48.02% of the Industrial Tablet PC market share in 2025; ultra-rugged models are advancing at an 8.06% CAGR through 2031.
- By operating system, Windows devices commanded 60.78% share of the Industrial Tablet PC market in 2025, while Android units are projected to expand at 8.92% CAGR to 2031.
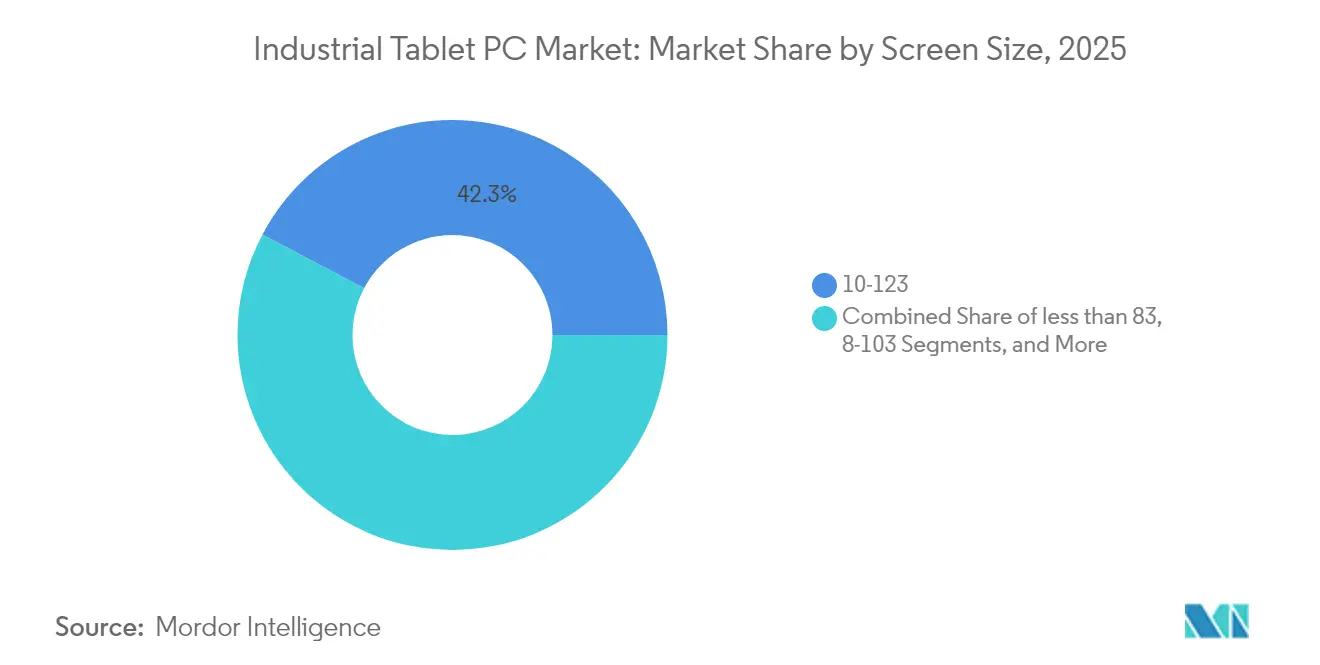
- By screen size, the 10-12 inch segment held 42.25% of the Industrial Tablet PC market size in 2025; displays above 12 inches are on track for an 8.54% CAGR between 2026 and 2031.
- By end-user industry, manufacturing accounted for 29.06% share of the Industrial Tablet PC market size in 2025, and transportation and logistics is growing fastest at 9.61% CAGR through 2031.
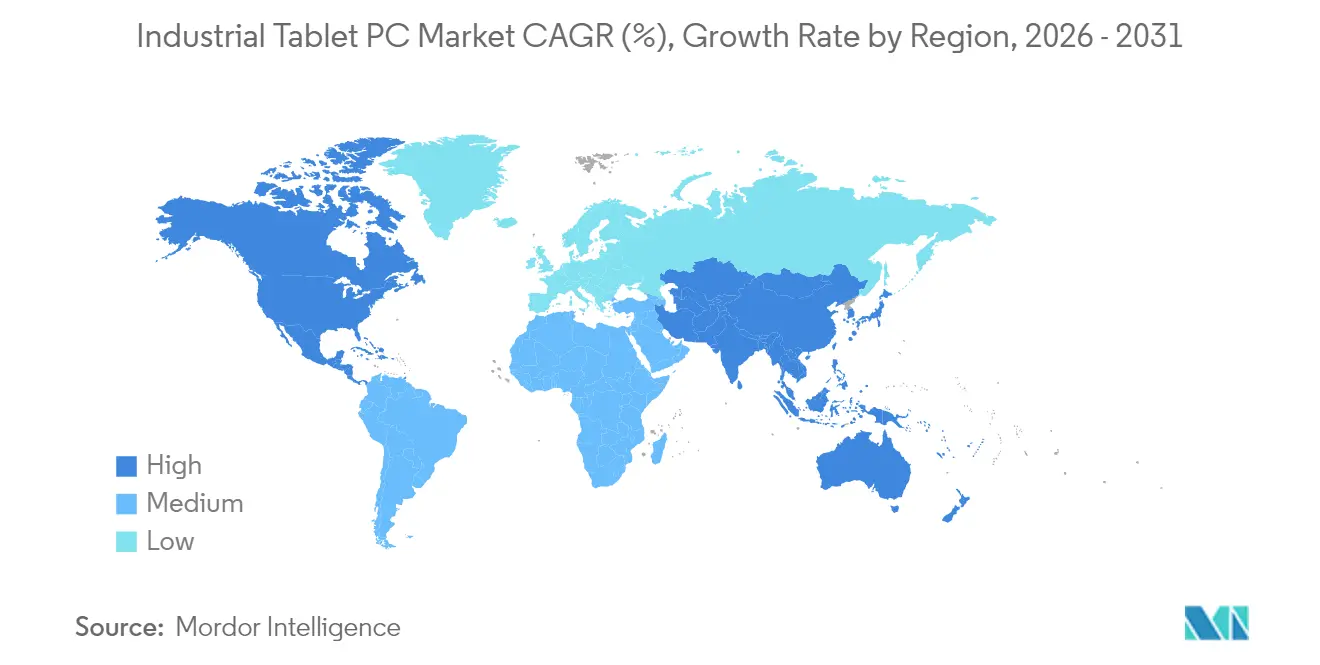
- By geography, North America controlled 40.78% of the Industrial Tablet PC market share in 2025, while the Asia Pacific is forecast to post a 9.12% CAGR through 2031.
Note: Market size and forecast figures in this report are generated using Mordor Intelligence’s proprietary estimation framework, updated with the latest available data and insights as of 2026.
Market Trends and Insights
Drivers Impact Analysis of Industrial Tablet PC Market*
| Driver | (~) % Impact on CAGR Forecast | Geographic Relevance | Impact Timeline |
|---|---|---|---|
| Industry 4.0-driven demand for rugged mobility | +1.8% | North America, Europe, global enterprises | Medium term (2–4 years) |
| Real-time data visibility needs in logistics and warehousing | +1.2% | Asia Pacific, North America | Short term (≤ 2 years) |
| Regulatory digital‐record mandates | +0.9% | North America, Europe, expanding in Asia Pacific | Long term (≥ 4 years) |
| Roll-out of private 5G networks in smart factories | +0.7% | North America, Europe, advanced Asia Pacific | Medium term (2–4 years) |
| Explosion-proof tablets for hazardous environments | +0.6% | Oil and gas regions worldwide | Long term (≥ 4 years) |
| Mixed-reality service and maintenance usecases | +0.5% | Early adopters in North America and Europe | Long term (≥ 4 years) |
| Source: Mordor Intelligence | |||
Industry 4.0-driven Demand for Rugged Mobility
Factories upgrade assembly lines with sensors, edge AI, and autonomous vehicles that must all speak to a mobile human interface. Rugged tablets bridge information-technology and operational-technology domains because they run analytics locally, resist airborne oils, and survive drops on concrete. By hosting digital work instructions and predictive-maintenance dashboards at the point of use, tablets help technicians cut mean time to repair and avoid unplanned downtime. The value proposition rises when private 5G delivers reliable gigabit links and keeps latency under 10 ms, enabling video-based defect inspection and AI inference on the same portable device. Enterprises that previously relied on cart-mounted PCs now favor handheld or shoulder-strap tablets so workers stay mobile without sacrificing computing horsepower. This shift underpins half of the new Industrial Tablet PC market orders in discrete manufacturing because every asset upgrade requires a complementary mobile screen.
Real-time Data Visibility in Logistics and Warehousing
E-commerce growth has turned fulfillment speed into a competitive metric, driving warehouse operators to replace clipboards with drop-tested tablets that scan barcodes, photograph damage, and update order status instantly. Fleet drivers likewise need electronic proof-of-delivery and dynamic routing that syncs every few seconds with dispatch. Rugged tablets allow continuous use in freezers, rain, and direct sunlight, so depot managers see inventory accuracy rise and mis-shipments fall. As labor markets tighten, companies leverage data collected on the floor to model staffing peaks and automate replenishment. Predictive analytics thrives on richer datasets, propelling recurring upgrades to higher-resolution cameras and faster chipsets. This cycle sustains the fastest segment growth, transportation and logistics, within the Industrial Tablet PC market through 2030.
Regulatory Digital Record Mandates
From the FDA’s electronic batch-record rules to EU machinery directives, regulators now require time-stamped audit trails that consumer tablets rarely secure out of the box [2]FDA, “Part 11, Electronic Records; Electronic Signatures — Scope and Application,” fda.gov. Rugged units ship with hardware encryption, tamper-evident screws, and long OS-patch lifecycles that satisfy validation protocols. Pharmaceutical plants, food processors, and medical-device workshops therefore budget for validated tablets whenever they add a new production line. The result is a virtuous loop, as more compliance software migrates to tablets, CIOs standardize on a single rugged platform to simplify audits.
Roll-out of Private 5G Networks in Smart Factories
Rugged tablets become control nodes when firms deploy licensed-spectrum 5G to orchestrate robots and cameras. Ericsson pilots show a single private cell can stream 4K quality-control video and AR overlays to tablets roaming a 300,000 sq ft facility with latency under 5 ms. This performance pushes plant managers to issue tablets instead of rugged smartphones, because larger screens are essential for complex dashboards. Device makers, in turn, ship models with sub-6 GHz and mmWave radios plus Wi-Fi 7 fallback, opening revenue streams for antenna suppliers and managed-service providers.
Restraints Impact Analysis of Industrial Tablet PC Market*
| Restraint | (~) % Impact on CAGR Forecast | Geographic Relevance | Impact Timeline |
|---|---|---|---|
| High upfront cost vs. consumer tablets | –1.4% | Cost-sensitive emerging markets worldwide | Short term (≤ 2 years) |
| Lengthy replacement cycles in conservative industries | –0.8% | Global legacy manufacturers and utilities | Medium term (2–4 years) |
| Supply-chain shortages for rugged display components | –0.6% | Asia Pacific manufacturing hubs | Short term (≤ 2 years) |
| BYOD policies shifting spend to rugged smartphones | –0.5% | North America, Europe, Asia Pacific | Medium term (2–4 years) |
| Source: Mordor Intelligence | |||
High Upfront Cost versus Consumer Tablets
A fully rugged tablet often lists at USD 1,800, roughly triple a prosumer slate. CFOs in emerging markets fixate on this initial delta even though lifecycle math favors rugged gear once downtime and accessory replacement are factored [3]MobileDemand, “Total Cost of Ownership of Rugged Tablets,” mobiledemand.com. Subscription-as-a-service models try to smooth capital spikes, yet legacy procurement policies in utilities and public-sector fleets slow adoption. Vendors counter by bundling extended warranties and hot-swap batteries to demonstrate lower five-year spend.
Lengthy Replacement Cycles in Conservative Industries
Water utilities, mining conglomerates, and some automotive tiers keep tablets in service for seven years or longer, far beyond the 2-to-4-year window that hardware roadmaps assume. This stretches revenue-recognition cycles and tempers unit shipments. Safety certifications compound the delay because once a device passes ATEX or IECEx audits, operators hesitate to re-qualify successors. Tablet makers, therefore, offer incremental SKUs with identical housings but new CPUs to entice a refresh without forcing re-certification.
*Our forecasts treat driver/restraint impacts as directional, not additive. The impact forecasts reflect baseline growth, mix effects, and variable interactions.
Industrial Tablet PC Market Segment Analysis
By Tablet PC Type:
Ultra-Rugged Drives Premium GrowthThe ultra-rugged class captures a forecast 8.06% CAGR as petrochemical, mining, and offshore drilling clients prioritize ATEX Zone 1/21 compliance. In 2025, fully rugged designs held 48.02% of the Industrial Tablet PC market share. That dominance stems from broad appeal in manufacturing, logistics, and field service, where IP65 sealing and MIL-STD-810H impact ratings suffice. Ultra-rugged units, however, command price premiums of 20-40% and include sealed ports, glove-touch capacitive panels, and drop resistance beyond 1.8 m. Buyers accept the uplift because downtime in explosive areas costs magnitudes more than the device price.
Vendor strategy centers on modular expansion bays for serial ports, CAN bus, or RFID sleds, letting one chassis serve multiple verticals. Getac’s collaboration with T-Mobile to certify devices on Band 71 exemplifies how connectivity partnerships boost appeal in oil pipelines that traverse remote zones. Competitive friction intensifies as consumer-device giants test the water with ruggedized variants, but certification hurdles protect incumbents in the near term. Long-run consolidation could emerge because obtaining and maintaining safety approvals is capital-intensive, favoring players with global test-lab networks.



By Operating System:
Android Gains Enterprise MomentumWindows owns a 60.78% slice of the 2025 Industrial Tablet PC market, buoyed by legacy SCADA clients and ubiquitous .NET applications. Yet Android’s 8.92% CAGR signals a structural pivot toward cloud-native stacks and lower license fees. Security updates, once a pain point, now extend up to eight years on enterprise SKUs, aligning with industrial lifecycle expectations.
Manufacturers bundle zero-touch enrollment and verified boot to satisfy IT governance. Warehouse operators value Android’s broad choice of scanning APIs and camera extensions, which cut integration time with WMS platforms. Windows remains entrenched in pharmaceutical and defense sites where AD group-policy scripts and proprietary lab software tie workers to x86 binaries. Nevertheless, Google’s 2026 plan to unify Android and ChromeOS kernels will blur device categories further. Procurement teams may eventually standardize on a single Android-based image for handhelds, tablets, and thin clients to simplify patch management.
By Screen Size:
Large Displays Capture Growth PremiumPanels larger than 12 inches post the fastest rise at an 8.54% CAGR because engineers, inspectors, and maintenance crews favor spacious canvases for CAD files, thermal imagery, and augmented-reality overlays. In contrast, 10-12 inch models remain volume champions with 42.25% share of the Industrial Tablet PC market size, balancing visibility with one-hand carry comfort. Shipments below 8 inches recede as employees replace paper task lists with data-rich dashboards that strain small fonts.
Large screens absorb brightness levels above 1,000 nits and include optical bonding to fend off glare on drilling platforms or tarmac. They also host dual batteries to offset the higher power draw from backlights and 5G modems. Microsoft’s HoloLens integration roadmaps underscore this trajectory: mixed-reality apps run smoother on tablets that mirror head-mounted displays for supervisors. Suppliers of IPS and mini-LED panels see fertile ground in this size band, but yield constraints on strengthened cover glass can choke supply in peak quarters, prolonging lead times.
By End-User Industry:
Transportation Leads Digital AccelerationTransportation and Logistics accelerate at a 9.61% CAGR as e-commerce providers chase one-hour delivery benchmarks. Fleet mandates for electronic logging, proof-of-delivery, and cross-dock routing cement tablets as mission gear. Manufacturing keeps the lion’s share at 29.06% in 2025 because discrete and process plants installed tablets early for SPC checks and machine setups.
Energy and Utilities deploy units for outage tracking and GIS overlays, while oil and gas upstream sites add hydrogen-rated options to monitor wellheads. Automotive service bays fit tablets with OBD dongles for over-the-air software updates. Agriculture’s adoption gathers pace via precision-farming consoles that calculate fertilizer maps on the move. This domain diversity insulates the Industrial Tablet PC market from single-sector slowdowns and promotes incremental rugged-feature innovation.
Geography Analysis
North America Industrial Tablet PC Market
North America retains 40.78% of the Industrial Tablet PC market share in 2025, owing to deep automation roots in aerospace, pharmaceuticals, and high-tech assembly. FDA Part 11 rules make validated tablets indispensable on production floors seeking electronic batch records and real-time deviation alerts. Canada and Mexico trail but benefit from the reshoring of critical supply chains that stipulate rugged devices for cross-border visibility. Private 5G adoption in automotive paint shops pivots buyers toward Wi-Fi 7 plus 3GPP Release 17-ready tablets, a spec alignment more prevalent in US catalogs than elsewhere.
APAC Industrial Tablet PC Market
Asia Pacific is set to clock a 9.12% CAGR, the highest worldwide, as Chinese, Indian, and ASEAN factories race to meet smart-industry targets. Capital-equipment subsidies allow mid-tier manufacturers to skip intermediate IT stages and land directly on tablet-based MES screens. Custom SoC fabs in Taiwan and Korea invest in clean-room-safe tablets with fanless magnesium frames to avoid particle contamination. Meanwhile, Japan’s energy utilities mount explosion-proof tablets on hydrogen pipelines, merging hazard compliance with IoT gateways that feed cloud twins over 5G SA cores.
Europe Industrial Tablet PC Market
Europe advances steadily on the back of sustainability regulations and strict worker-safety norms that require field inspections, emission logging, and audit trails accessible in real time. Germany’s automotive lines add tablets with UWB location chips for collision avoidance between forklifts and AGVs. ATEX and IECEx labels carry particular weight in the North Sea, driving demand for ultra-rugged SKUs. France’s luxury-goods outfits deploy tablets at finishing ateliers to digitize craftsmanship steps, combining heritage processes with traceability demanded by global consumers.

Regulatory Landscape
Industrial tablet PCs sit at the intersection of industrial safety, electromagnetic compatibility, and product-market access regimes. For hazardous-area deployments that underpin ultra-rugged demand, certification frameworks such as ATEX and IECEx reference the IEC 60079 series, while broader market access commonly requires CE marking for the EEA and FCC/IC compliance for North America, with EMC alignment often mapped to EN 301 489 series requirements; vendors typically document conformity through formal declarations for specific tablet SKUs.
Trade policy has become a more visible input to device landed cost and sourcing strategy. In the United States, Section 232 duties affecting semiconductors and derivative products took effect in mid-January 2026 at 25% ad valorem, introducing additional administrative burden around classification and exclusion eligibility for industrial-use cases and intensifying efforts to qualify alternate component sources and assembly pathways for rugged computing products.
Value Chain Analysis
The value chain starts with upstream component suppliers for industrial-grade SoCs/modems, specialized high-brightness display stacks (often optically bonded), memory (DRAM/NAND), power-management ICs, batteries, rugged housings (magnesium-alloy or reinforced polymers), and wireless modules and antennas. These flow into ODM/OEM design and integration, certification and compliance testing (MIL-STD ruggedization, ingress protection, and hazardous-location approvals where applicable), and then into final assembly, kitting (vehicle docks, scanners, RFID modules), imaging, and lifecycle support programs aligned to 5- to 7-year industrial refresh windows.
Midstream strategies increasingly blend manufacturing control with ecosystem partnerships. Device makers and platform vendors are tightening integration around edge AI acceleration and fleet management via collaborations, while manufacturing footprints are being expanded or modernized to reduce dependency on third-party assembly and improve schedule control. At the downstream end, distribution runs through enterprise mobility resellers, industrial automation and IIoT integrators, and direct sales to verticals such as manufacturing, logistics, energy and utilities, and oil and gas, where deployment services (MDM enrollment, application integration, and spares logistics) influence total delivered value as much as hardware specifications.
Competitive Landscape
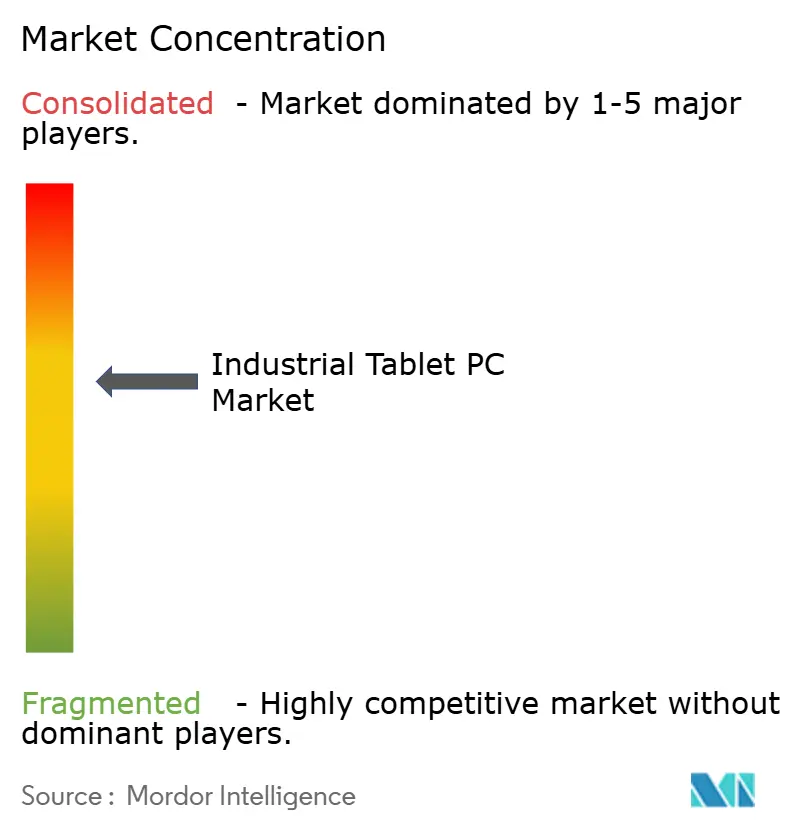
The Industrial Tablet PC market remains moderately concentrated. Panasonic, Advantech, Zebra, and Getac together account for just under half of global revenue, leaving room for niche specialists. Competitive gravity tilts toward firms that bundle hardware with mobile-device-management portals and vertical apps, creating lock-in beyond the physical device. Getac’s 2025 unveiling of the world’s first rugged Copilot+ PC inserts generative AI at the edge, signaling an arms race over on-device inference horsepower.
Consumer-electronics incumbents such as Samsung test rugged variants to extend brand equity into enterprise budgets. However, certification bottlenecks and MIL-STD testing costs deter rapid scaling, giving pure-play rugged houses breathing room. Vendors with direct relationships at panel fabs and SOC foundries can promise shorter lead times, capturing orders when rivals quote 20-week deliveries. Analysts observe early-stage consolidation moves as mid-tier brands seek shelter under larger balance sheets that can absorb inventory shocks.
Suppliers now court software alliances. Zebra’s 2025 tie-up with Merck to address counterfeiting merges secure pigments with handheld scanners, illustrating how hardware value migrates into solution ecosystems. Looking ahead, mixed-reality maintenance and digital-twin visualization apps will force partnerships between tablet makers, AR glasses, and cloud analytics providers. Those unable to orchestrate full-stack offerings risk relegation to white-label status.
Industrial Tablet PC Industry Leaders
-
Panasonic Corporation
-
Advantech Co., Ltd.
-
Getac Holdings Corporation
-
Zebra Technologies Corporation
-
Samsung Electronics Co., Ltd.
- *Disclaimer: Major Players sorted in no particular order
Industrial Tablet PC Market Companies Covered in this Report
- Panasonic Corporation
- Advantech Co., Ltd.
- Getac Holdings Corporation
- Zebra Technologies Corporation
- Samsung Electronics Co., Ltd.
- Siemens AG
- Winmate Inc.
- ARBOR Technology Co., Ltd.
- Dell Technologies Inc.
- AAEON Technology Inc.
- Bartec GmbH
- Durabook (Twinhead International Corporation)
- RuggON Corp.
- NEXCOM International Co., Ltd.
- MobileDemand Inc.
- MobileWorxs Ltd.
- Honeywell International Inc.
- DT Research, Inc.
- Trimble Inc.
- Juniper Systems, Inc.
- Lenovo Group Limited

Market Opportunities and Future Outlook
Product roadmaps in 2025-2026 show an opportunity band around AI-ready rugged tablets, where on-device inference, larger screens, and low-latency connectivity converge with industrial workflows. Examples include Getac introducing a fully rugged Copilot+ PC tablet (G140) and expanding its 8-inch ZX80 line with Windows 11 on ARM variants, and Winmate introducing an NVIDIA Jetson Orin Nano-based rugged tablet aimed at robotics and automation use cases. These launches highlight buyer requirements moving beyond ruggedization into NPU/GPU acceleration, fanless thermals, and mixed-OS fleets (Windows and Android) that can be governed under enterprise mobility policies.
Hazardous-environment and regulated-data deployments create additional whitespace for certified devices that pair safety approvals with enterprise software stacks. In 2026, Bartec released the ET60/65 EX2 Android tablet co-engineered with Zebra Technologies and aligned with Zebra Mobility DNA, reinforcing the market pull for vertically optimized solutions in oil and gas, chemicals, utilities, and field service where ATEX/IECEx considerations and auditability shape procurement. On the supply side, added manufacturing capacity and tighter hardware-software partnerships expand the addressable deployment scenarios by improving availability, shortening customization cycles (ports, docks, RFID, CAN bus), and supporting longer security and support lifecycles demanded by conservative industrial operators.
Recent Industry Developments in Industrial Tablet PC Market
- June 2026: Getac announced the ZX80W and ZX80W-EX 8-inch fully rugged tablets built on Windows 11 on ARM with a fanless design for field work. The move broadens ARM-based rugged offerings that emphasize battery life and thermal efficiency while keeping a Windows workflow for industrial users. It also increases competitive pressure on x86-centric portfolios in small-form-factor rugged deployments.
- May 2026: Panasonic Connect announced a collaboration with Red Hat to preload Red Hat Device Edge on TOUGHBOOK rugged laptops and tablets. Bundling a container-ready edge platform strengthens Panasonic's position with industrial customers standardizing on managed edge stacks for real-time data processing and automation. The integration aligns rugged endpoints more tightly with enterprise DevOps and security practices deployed at the edge.
- June 2024: Getac launched the next-generation K120 rugged tablet aimed at harsh-environment digital transformation programs. The refresh reinforces competition in fully rugged devices used across manufacturing, utilities, and field service where durability ratings and long lifecycle support drive vendor selection. It also supported solution bundling through accessories and fleet-management compatibility for large deployments.


Industrial Tablet PC Market Report Scope and Research Methodology
Market Definition and Coverage
For this study, the industrial tablet PC market covers purpose-built tablets designed for industrial use, where ruggedness, connectivity, and device management features are required for work in plants, warehouses, vehicles, and field sites.
Scope exclusions: Consumer tablets used casually at work, keyboards or docks sold separately, and services such as device leasing, support contracts, and software subscriptions are not counted in the market value.
Segments Covered in This Report
-
By Tablet PC Type
- Fully-Rugged
- Semi-Rugged
- Ultra-Rugged
-
By Operating System
- Windows
- Android
- Other Operating Systems (Linux-based, etc.)
-
By Screen Size
- < 8″
- 8-10″
- 10-12″
- > 12″
-
By End-User Industry
- Manufacturing
- Energy and Utilities
- Oil and Gas
- Transportation and Logistics
- Automotive
- Agriculture and Farming
- Other End-User Industries (Public Safety and Defense, Retail and Warehousing, etc.)
-
By Geography
-
North America
- United States
- Canada
- Mexico
-
South America
- Brazil
- Argentina
- Rest of South America
-
Europe
- Germany
- United Kingdom
- France
- Italy
- Spain
- Russia
- Rest of Europe
-
Asia Pacific
- China
- Japan
- India
- South Korea
- Southeast Asia
- Australia and New Zealand
- Rest of Asia Pacific
-
Middle East
- Saudi Arabia
- UAE
- Turkey
- Rest of Middle East
-
Africa
- South Africa
- Nigeria
- Rest of Africa
-
North America
Data Sources, Market Sizing, and Validation
Desk Research
To set the market boundaries and build starting assumptions, we reviewed public information that signals demand and supply for rugged and semi-rugged tablets. Sources used include, for example, US Census Bureau and Eurostat industrial activity series, UN Comtrade trade data for relevant electronics categories, International Electrotechnical Commission (IEC) standards references for ruggedness testing, and filings and product documentation posted by manufacturers and distributors.
We also checked tender portals and procurement notices for industrial mobility deployments, plus investor presentations and earnings call transcripts to understand pricing bands and replacement cycles. Patent databases were used selectively to see where core design activity was picking up, which helped validate feature trends such as ingress protection and sunlight-readable displays. The sources listed are illustrative, and other public references were also used to collect, validate, and clarify data points.
Primary Interviews and Surveys
Primary discussions were run with a mix of device manufacturers, component and module suppliers, channel partners, and large end users that deploy rugged tablets in manufacturing, logistics, energy, and field service. We covered APAC, EMEA, and the Americas so regional buying patterns, certification needs, and typical device replacement timing could be checked and then applied back to the model assumptions.
Distribution of primary research fieldwork respondents
| Company type | Respondent position | Region |
|---|---|---|
| Top tier: 39% | CXOs: 17% | APAC: 49% |
| Mid tier: 44% | Functional/Unit leaders: 41% | EMEA: 32% |
| Smaller Players: 17% | Managers: 42% | Americas: 19% |
Market-Sizing & Forecasting
The core sizing uses a top-down approach where industrial activity and mobility adoption signals are used to reconstruct the addressable demand pool for rugged and semi-rugged tablets, and then converted into value using realistic pricing bands. In practice, we leaned on indicators such as factory automation and digitization intensity, warehousing and last mile throughput growth, field workforce expansion in utilities and energy, replacement cycle norms, and the spread of higher-spec devices (for example, higher ingress protection ratings and bright-display requirements).
Once the total was shaped, it was checked with selective bottom-up approximations using sampled shipment volumes from channel conversations, typical average selling price ranges by ruggedness class, and sanity checks against public company revenue commentary tied to industrial mobility hardware. When gaps showed up in smaller countries or niche end uses, proxy ratios based on industrial employment and logistics intensity were applied, and then re-tested through follow-up calls.
For forecasting, scenario analysis was used so adoption rate changes and pricing movement could be expressed clearly, and then adjusted based on what interviewees expect for procurement cycles and device refresh budgets. The final forecast also reflects practical constraints like certification lead times and supply availability for industrial-grade displays and batteries.
Data Validation & Update Cycle
Estimates are validated through multiple checks, starting with internal consistency tests across volumes, pricing, and implied spending per site, and then moving to external comparisons such as trade movement direction and procurement activity signals. If a segment shows an unusual jump, it is flagged for a second review, and assumptions are either tightened or re-grounded through re-contact with relevant respondents.
Before sign-off, the model is reviewed by another analyst to confirm that definitions, currency conversion timing, and growth drivers match the evidence gathered. Reports are refreshed annually, and interim updates are made when material events occur, such as major regulatory shifts, supply disruptions, or large industrial deployment announcements. Right before delivery, we run a final pass so the latest public updates are reflected in the narrative and numbers.
Mordor Intelligence's Industrial Tablet Pc Market Size Versus Other Published Estimates
Published numbers for industrial tablet PCs can look far apart because not everyone counts the same device types, price points, and buying channels. Differences also come from the year used as the starting point, the currency timing, and whether the estimate is built from demand signals or from limited supplier revenue snapshots.
Shipment direction, procurement activity, and cross-checks on ruggedness-class pricing are the evidence points that keep Mordor Intelligence tied to a defined industrial demand pool for tablets used in harsh or controlled work environments, instead of mixing in consumer or generic enterprise devices.
Benchmark comparison
| Source | Market Size | Gaps in Research Methodology |
|---|---|---|
| Mordor Intelligence | USD 1.19 B (2026) | |
| Market Catalog A | USD 1.12 B (2025) | Uses an earlier base year and a shorter forecast window, and the scope may treat some semi-rugged enterprise deployments as industrial, which can shift the starting value and CAGR. |
| Industry Compendium B | USD 1.18 B (2024) | Applies a supplier-qualification threshold and focuses on a narrower vendor set, which can undercount long-tail manufacturers and channel-led sales in smaller countries. |
Across the three figures, most of the spread is explained by base-year choice, how semi-rugged units are classified, and how fully the long-tail supply side is captured. By anchoring assumptions to observable demand and pricing signals and then re-checking them with targeted bottom-up tests, the estimate stays traceable to clear inputs that a reader can replicate and challenge if needed.


Key Questions Answered in the Report
How large will the Industrial Tablet PC market be by 2031?
Forecasts indicate USD 1.64 billion in global sales by 2031, reflecting a 6.50% CAGR from 2026.
Which tablet category grows fastest in rugged environments?
Ultra-rugged tablets post an 8.06% CAGR because explosion-proof certifications unlock spending in oil, gas, and chemical sites.
Why is Android adoption rising in industrial tablets?
Lower licensing, longer security support, and cloud-native apps help Android units grow 8.92% annually and erode Windows dominance.
What region drives future demand?
Asia Pacific records a 9.12% CAGR as China, India, and ASEAN states invest in smart-factory upgrades and private 5G networks.
How do regulatory mandates influence purchases?
FDA, food-safety, and EU rules force electronic audit trails, pushing plants to validated rugged tablets with secure data capture.
What is the biggest cost barrier for buyers?
Upfront unit prices are two to four times higher than consumer tablets, but lifecycle savings offset sticker shock after deployment.
Page last updated on:





