
Industrial Rubber Market Size and Share
Market Overview
| Study Period | 2021 - 2031 |
|---|---|
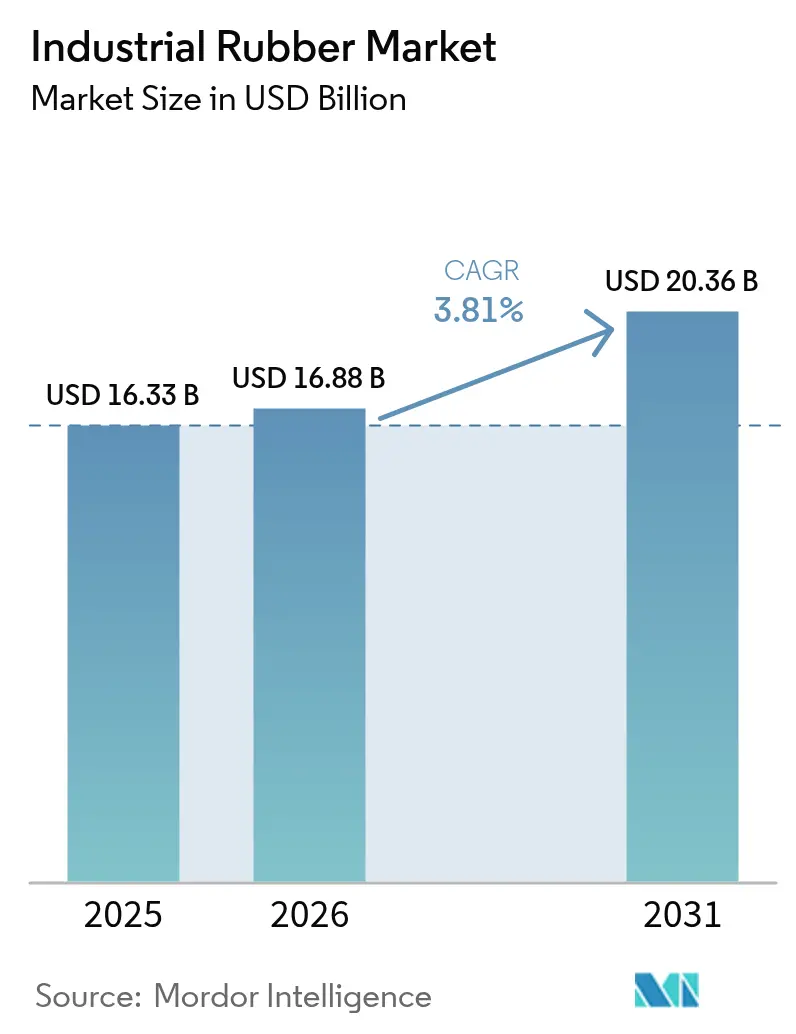
| Market Size (2026) | USD 16.88 Billion |
| Market Size (2031) | USD 20.36 Billion |
| Growth Rate (2026 - 2031) | 3.81 % |
| Fastest Growing Market | Asia Pacific |
| Largest Market | Asia Pacific |
| Market Concentration | Medium |
Major Players *Disclaimer: Major Players sorted in no particular order Image © Mordor Intelligence. Reuse requires attribution under CC BY 4.0. | |
Industrial Rubber Market Analysis by Mordor Intelligence
The Industrial Rubber Market size is projected to expand from USD 16.33 billion in 2025 and USD 16.88 billion in 2026 to USD 20.36 billion by 2031, registering a CAGR of 3.81% between 2026 to 2031. Electrified vehicles, digitalized compounding lines, and circular-economy mandates are reshaping the industrial rubber market as suppliers replace traditional EPDM with lighter thermoplastic elastomers, embed IoT sensors in mixing mills, and scale reclaimed-rubber devulcanization plants. At the same time, butadiene price swings between USD 800 and USD 1,200 per ton in 2024 forced producers to hedge feedstock risk while accelerating bio-based alternatives. Synthetic grades still dominate, yet reclaimed rubber is advancing at 5.06% annually because EU microplastics rules and China’s Green Manufacturing Action Plan reward closed-loop material flows. Demand is also rising for flame-retardant, high-tensile conveyor belts in new mining corridors across Indonesia, Chile, and South Africa that must meet ISO 340/14890 standards. Asia-Pacific remains the production and consumption hub as Belt and Road corridors add infrastructure megaprojects and India lifts vehicle output toward 5 million units, sustaining tier-1 investment in local sealing, hose, and vibration-control capacity.
Key Report Takeaways
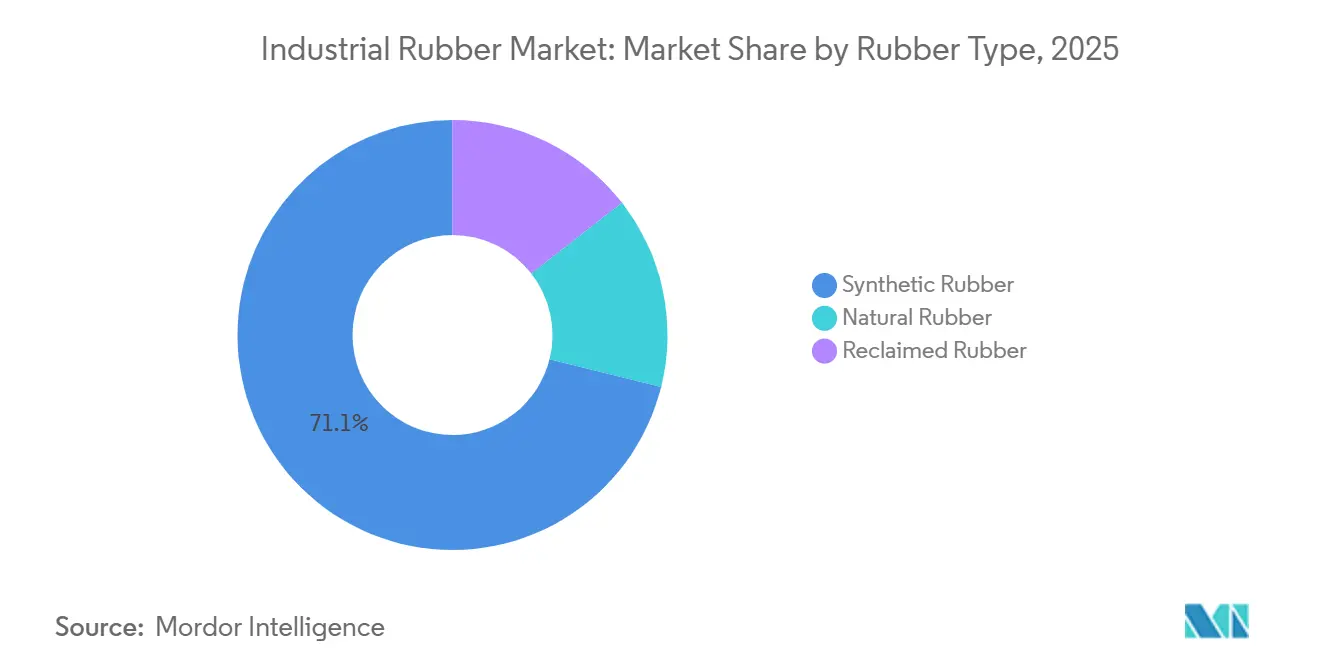
- By rubber type, synthetic rubber led with 71.12% of the industrial rubber market share in 2025, while reclaimed rubber posted the highest projected CAGR at 5.06% to 2031.
- By process, extrusion commanded 45.18% share of the industrial rubber market size in 2025; 3D printing is set to expand the fastest at a 4.20% CAGR.
- By application, conveyor belts accounted for 38.67% of the industrial rubber market size in 2025 and are also advancing at a 4.91% CAGR through 2031.
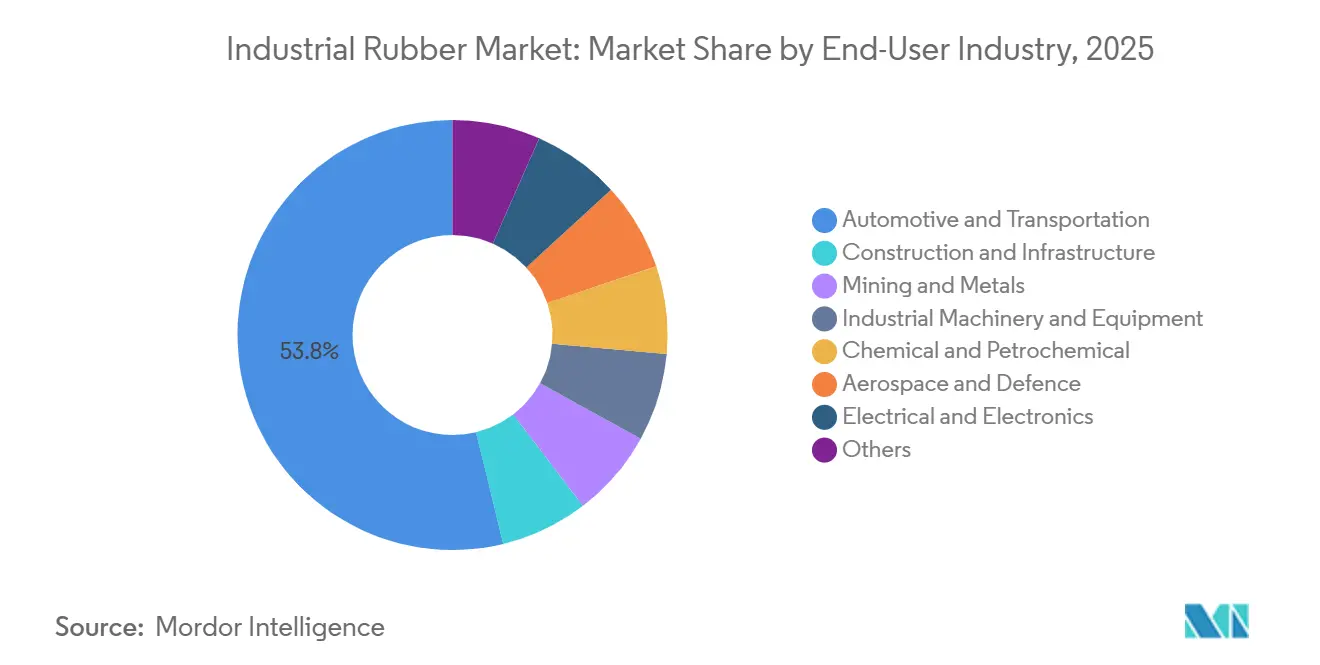
- By end-user industry, automotive and transportation held 53.78% share of the industrial rubber market size in 2025, while aerospace and defense is projected to grow at 4.98% CAGR.
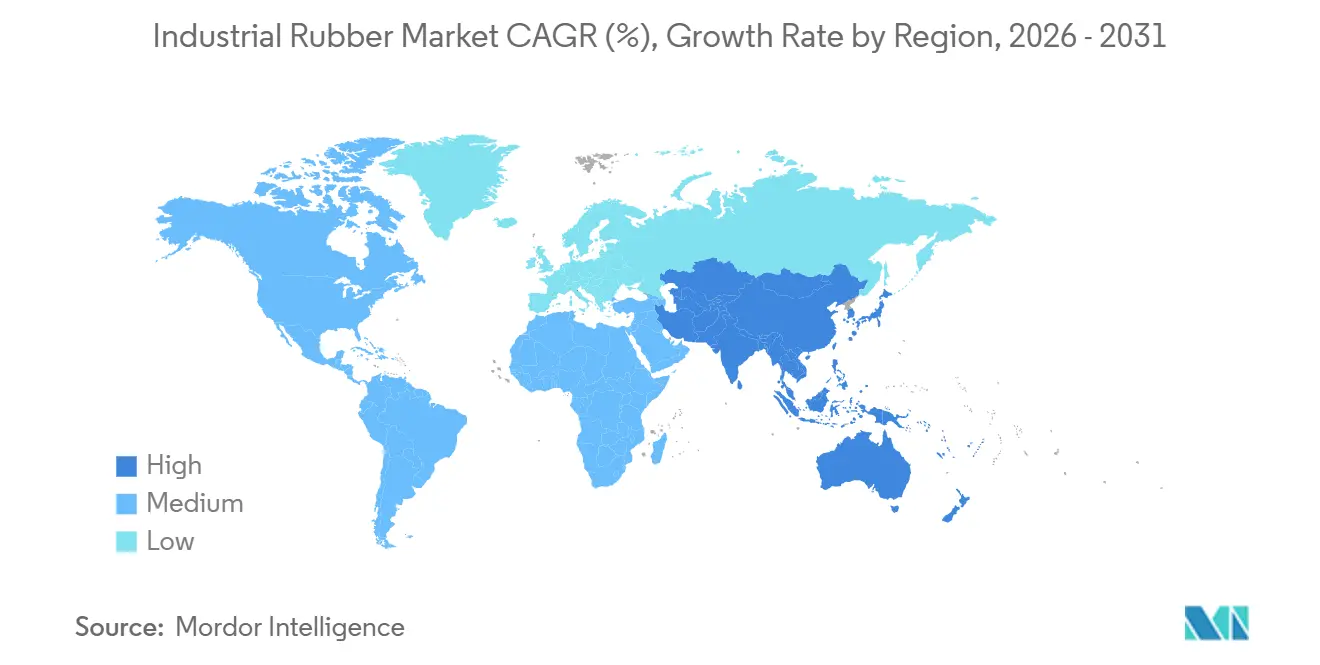
- By geography, Asia-Pacific captured 59.09% of the industrial rubber market share in 2025 and is forecast to rise at a 4.14% CAGR.
Note: Market size and forecast figures in this report are generated using Mordor Intelligence’s proprietary estimation framework, updated with the latest available data and insights as of 2026.
Market Trends and Insights
Drivers Impact Analysis of Industrial Rubber Market*
| Driver | (~) % Impact on CAGR Forecast | Geographic Relevance | Impact Timeline |
|---|---|---|---|
| Increasing application as conveyor & transmission belts | +1.10% | APAC core (China, India, Indonesia), spill-over to South America (Chile, Brazil) and MEA (South Africa) | Medium term (2-4 years) |
| Growing demand for high-pressure hoses | +0.80% | Global, with concentration in North America & Middle East oil & gas sectors | Short term (≤ 2 years) |
| EV-led boom in lightweight automotive components | +1.30% | North America, EU, and China automotive manufacturing hubs | Medium term (2-4 years) |
| Infrastructure build-out in emerging economies | +1.00% | APAC (India, Southeast Asia), Middle East (Saudi Arabia, UAE), Africa (Egypt, Nigeria) | Long term (≥ 4 years) |
| Adoption of Industry 4.0 smart rubber-compounding lines | +0.60% | APAC (China, Japan, South Korea), expanding to EU and North America | Long term (≥ 4 years) |
| Source: Mordor Intelligence | |||
Increasing Application as Conveyor & Transmission Belts
Mining, bulk-handling, and e-commerce logistics are switching to steel-cord rubber belts rated above 3,150 N/mm and able to run at ambient temperatures beyond 60°C, spurring specification upgrades in Asia-Pacific and South America. Indonesia’s 1.8 million-ton nickel surge in 2024 accelerated orders for flame-retardant belts compliant with ISO 340 to mitigate underground fire risk. Chile’s 5.3 million-ton copper output retrofit legacy conveyors with low-rolling-resistance belts that cut drive-motor loads 15%. Transmission belts are also evolving, with aramid-fiber reinforcement replacing cotton canvas in high-speed CNC machining centers and automated packaging lines. Embedded RFID tags now allow operators to replace belts based on real-time wear data, lowering the total cost of ownership.
Growing Demand for High-Pressure Hoses
Hydraulic assemblies rated above 350 bar are expanding in offshore oil, subsea construction, and mobile hydraulics as equipment operates at higher loads[1]Parker Hannifin, “787TC High-Pressure Hose,” parker.com. Parker Hannifin’s 787TC hose, launched in 2024, delivers 420 bar working pressure and a 6:1 safety factor under SAE 100R13 and EN 856 4SP. Middle-East crackers commissioned in 2025 specify fluoropolymer-lined hoses for corrosive transfers, a niche growing faster than overall hydraulics. North America’s shale basins, averaging 98 bcf/day in 2025, require hoses able to withstand 10,000 pressure cycles, reinforcing ISO 18752 compliance in new tenders.
EV-Led Boom in Lightweight Automotive Components
Battery-electric vehicle architectures are forcing a redesign of sealing, vibration-isolation, and thermal-management parts, accelerating demand for thermoplastic elastomers and fluoroelastomers that deliver equivalent durability at up to 44% lower mass[2]Cooper Standard, “FlexiCore Lightweight Sealing,” cooperstandard.com. Cooper Standard’s FlexiCore body-sealing system, commercialized in 2024, cut weight by 44% by replacing solid EPDM with foam-core profiles, boosting vehicle range without compromising NVH. Continental’s air-spring modules for electric trucks introduced in 2025 lower lifecycle CO₂ emissions by 50% through material optimization. Rising EV volumes above 20 million units by 2027 are prompting tier-1s to add clean-room molding capacity and seek IATF 16949 certification for battery-pack gaskets that must cycle between -40°C and 125°C while retaining IP67 integrity.
Adoption of Industry 4.0 Smart Rubber-Compounding Lines
IoT sensors and machine-learning algorithms are reducing formulation variance below 1% and cutting scrap by 22% in German InSuKa pilots launched in 2024. The EUR 8.5 million DIPONI consortium running 2025-2029 pairs extrusion digital twins with dynamic die-swell prediction to shave product-development lead times to under 12 months. Japanese plants now use inline rheometers to replace manual Mooney tests, boosting throughput and batch consistency for auto-OEM contracts. China labeled 15 rubber factories “smart manufacturing demonstration facilities” in 2025, backing MES platforms and predictive maintenance rollouts.
Restraints Impact Analysis of Industrial Rubber Market*
| Restraint | (~) % Impact on CAGR Forecast | Geographic Relevance | Impact Timeline |
|---|---|---|---|
| Stringent environmental regulations | -0.70% | EU (REACH, microplastics ban), North America (EPA VOC limits), China (Green Manufacturing) | Short term (≤ 2 years) |
| Volatile crude-oil-linked feedstock prices | -0.50% | Global, with acute impact on synthetic rubber producers in APAC and North America | Short term (≤ 2 years) |
| Rapid uptake of reclaimed rubber | -0.40% | EU (circular economy mandates), China (Extended Producer Responsibility), North America | Medium term (2-4 years) |
| Source: Mordor Intelligence | |||
Stringent Environmental Regulations
The EU’s 2023 microplastics restriction phases out rubber granules <5 mm in turf and flooring, adding EUR 50,000-150,000 per product for third-party testing and dossiers to national authorities. REACH Annex XVII limits eight PAHs to 1 mg/kg, forcing tire and belt makers to source low-aromatic process oils and raising raw-material spend by 8-12%. China’s 2024 Green Manufacturing update mandates a 15% VOC reduction per ton of rubber by 2027, driving investment in solvent-recovery systems. The U.S. EPA’s proposed 65 ppb ozone cap under review in 2025 could require USD 2 million-5 million per site for abatement gear in non-attainment areas.
Volatile Crude-Oil-Linked Feedstock Prices
Butadiene tracked crude swings of 40-50% in 2024, reaching USD 1,200 per ton in Northeast Asia and compressing synthetic-rubber margins under fixed OEM supply contracts. Monthly feedstock volatility versus quarterly contract resets is forcing compounders to hedge and multi-source, adding 2-3% to working capital. Natural-rubber prices also fluctuated with erratic monsoons in Thailand and Indonesia, whose plantations supplied 6.2 million tons in 2024. Producers are trialing bio-isoprene despite 20-30% cost premiums to cut reliance on petrochemicals.
*Our forecasts treat driver/restraint impacts as directional, not additive. The impact forecasts reflect baseline growth, mix effects, and variable interactions.
Industrial Rubber Market Segment Analysis
By Rubber Type:
Synthetic Dominance Meets Circular PressureSynthetic rubber commanded a 71.12% industrial rubber market share in 2025 as SBR remained the workhorse for abrasion-resistant hoses and seals, while nitrile captured premium fuel-system demand. Reclaimed rubber, however, is expanding 5.06% annually as EU directives push for 25% recycled content by 2030 and China’s EPR scheme incentivizes tire makers to close loops. Tyromer and Genan devulcanize waste tires to recover 70-80% of virgin properties, making reclaimed viable for mats and roofing, but still constrained by ISO 1795 testing gaps that limit use in automotive safety parts.
Feedstock volatility and microplastics scrutiny are prompting compounders to blend synthetic, natural, and reclaimed grades for balanced performance and cost. Fluoro- and silicone-based elastomers, though niche, are outgrowing the broader industrial rubber market at mid-single-digit rates thanks to semiconductor cleanroom, aerospace fuel-system, and medical-device demand where thermal stability is paramount.



By Process:
Extrusion Leads, Additive Manufacturing DisruptsExtrusion represented 45.18% of the industrial rubber market size in 2025 because of its scalability for profiles, hoses, and weather-strips. Twin-screw lines with inline rheology sensors now cut setup waste by 30% by adapting die geometry in real time. Molding and casting continue to serve high-tolerance engine mounts and vibration isolators, with liquid silicone injection gaining medical and food-contact share under FDA 21 CFR 177.2600 compliance.
Additive manufacturing is advancing 4.20% as Stratasys TPU 92A gained aerospace certification in 2024, allowing on-demand fabrication of gaskets and seals with 500% elongation. The US Department of Defense standard MIL-STD-3049 accelerates material qualification for field maintenance prints, expanding defense demand. Calendaring, vital for conveyor-belt covers and roofing membranes, is integrating embossing and laminating in a single pass to raise line speed and material utilization.
By Application:
Conveyor Belts Drive Volume and GrowthConveyor belts accounted for 38.67% of application revenue in 2025 and will grow 4.91% annually on mining CAPEX, logistics automation, and infrastructure megaprojects across Asia-Pacific and South America. Steel-cord belts spanning 10 km in Australia and Chile now handle >5,000 t/h under extreme heat and UV, requiring ozone-resistant compounds. Transmission belts evolve from wrapped V-belts to aramid-reinforced synchronous belts that eliminate slip in high-speed machinery.
Pressure hoses benefit from offshore wind installations, global capacity hit 75 GW in 2025, which need seawater-resistant assemblies with integrated pressure sensors for ISO 18752 traceability. Roofing membranes, tubing, and rolls grow more slowly as thermoplastic or metal composites substitute in select applications, although RFID-tagged premium belts now predict splice failure 2-4 weeks ahead, cutting downtime 40%.
By End-User Industry:
Automotive Leads, Aerospace AcceleratesAutomotive and transportation consumed 53.78% of the industrial rubber market output in 2025, buoyed by 88 million global light-vehicle builds and EV-specific sealing needs. Aerospace and defense, while smaller, posts a 4.98% CAGR as next-gen aircraft and UAV programs require lightweight fire-resistant seals that meet AS9100 standards.
Construction and infrastructure absorb steady demand for bridge bearings and expansion joints as the Asia-Pacific invests USD 1.7 trillion annually. Mining specifies flame-retardant, abrasion-resistant belts and slurry hoses as Indonesia’s nickel and Chile’s copper projects scale. Industrial machinery, chemical processing, and electrical applications drive precision-molded parts in high-temperature, corrosive, and low-smoke environments, while packaging and consumer goods test bio-based elastomers despite 20-30% cost premiums.
Geography Analysis
APAC Industrial Rubber Market
Asia-Pacific held 59.09% of global industrial rubber market demand in 2025, expanding at a forecast 4.14% CAGR to 2031, supported by USD 1 trillion Belt and Road infrastructure corridors and India’s Production-Linked Incentive for auto manufacturing. ASEAN states attracted USD 890 million in approved rubber projects in 2024 as firms diversify supply chains away from China, while Japanese and Korean processors deploy digital-twin compounding lines for just-in-time auto deliveries.
North America Industrial Rubber Market
North America’s share is anchored by 98 bcf/day shale gas production and a USD 1.2 trillion infrastructure program that keeps demand high for bridge bearings, roofing membranes, and high-pressure hydraulic hoses. Mexico’s 3.5 million-vehicle output is localizing rubber components to meet USMCA value rules, drawing investment into extrusion clusters in Guanajuato and Puebla.
EMEA and South America Industrial Rubber Market
Europe’s consumption reflects stringent REACH limits that accelerate reclaimed and bio-based uptake, while Germany’s advanced compounds supply low-VOC parts to machinery OEMs. South America relies on copper, lithium, and iron-ore extraction that needs heavy-duty belts and hoses, whereas the Middle East and Africa grow through Saudi Vision 2030 construction and South Africa’s mining-sector upgrades.

Regulatory Landscape
Industrial rubber producers operate under tightening chemical-safety and emissions frameworks that shape compounding additives, process oils, and plant controls. In Europe, compliance with REACH and CLP continues to drive formulation and documentation updates, with REACH Annex XVII PAH limits (eight PAHs at 1 mg/kg) pushing low-aromatic process oils and increasing the frequency of third-party testing, particularly for belts, hoses, and molded parts supplied into automotive and machinery value chains.
In North America, 2026 introduced new compliance triggers that influence site-level operating costs and reporting. Environment and Climate Change Canada issued release guidelines for chemicals used in the rubber product manufacturing sector effective April 4, 2026, while the US EPA finalized action on the Synthetic Rubber Manufacturing source category under NESHAP on April 1, 2026. Public Law 119-14 (May 23, 2025) nullified the 2024 Rubber Tire Rule in the United States, reverting federal emission standards to the 2020 NESHAP requirements and leaving a mixed compliance picture for multinational suppliers.
Value Chain Analysis
The industrial rubber value chain connects upstream natural rubber production (concentrated in Southeast Asia, notably Thailand, Indonesia, Vietnam, and Malaysia, with emerging supply from West Africa such as Ivory Coast), petrochemical feedstocks for synthetic rubber (butadiene, styrene, isoprene), compounding and mixing, conversion (extrusion, molding/casting, calendaring, and additive manufacturing), and downstream channels for conveyor belts, hoses, seals, and other industrial components. Feedstock exposure remains a constraint for synthetic rubber, since crude-oil-linked butadiene and energy costs transmit volatility into polymer and compound pricing. Many high-performance formulations also rely on specialty additives and testing capability (ISO/SAE/EN compliance) before reaching OEM and aftermarket distribution.
In 2026, traceability and logistics disruptions moved further upstream in procurement and planning. The EU Deforestation Regulation (EUDR) traceability requirement became effective for smaller enterprises in June 2026, increasing documentation needs and separating certified, traceable natural rubber from non-certified volumes in sourcing decisions. At the same time, Red Sea security incidents led to rerouting around the Cape of Good Hope, adding roughly 10-14 days to transit times for rubber shipments and forcing buyers to adjust safety stocks and supplier diversification, especially for time-sensitive hose, belt, and sealing programs.
Competitive Landscape
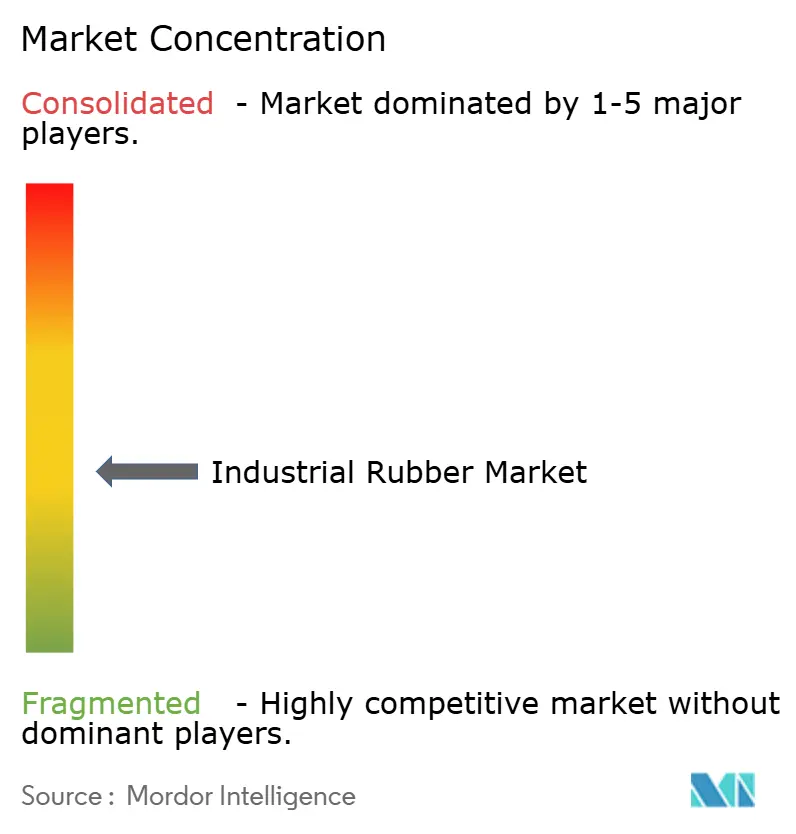
The Industrial Rubber market is moderately fragmented. Tire majors Bridgestone, Continental, and Goodyear integrate raw materials through finished goods, while regional compounders specialize in high-pressure hoses for offshore wind and chemical processing. Regulatory agility is emerging as a moat. Firms with ISO 17025 labs can validate REACH, EPA, and Green Manufacturing compliance faster, deterring new entrants.
Industrial Rubber Industry Leaders
Bridgestone Industrial
ContiTech Deutschland GmbH
Sumitomo Rubber Industries, Ltd.
The Goodyear Tire & Rubber Company
THE YOKOHAMA RUBBER CO., LTD.
- *Disclaimer: Major Players sorted in no particular order
Industrial Rubber Market Companies Covered in this Report
- Bando Chemical Industries, LTD.
- Bridgestone Industrial
- China Petrochemical Corporation (Sinopec)
- ContiTech Deutschland GmbH
- Denka Company Limited
- ENEOS Materials Corporation
- Parker Hannifin Corp
- SIBUR Holding PJSC
- Sumitomo Rubber Industries, Ltd.
- The Goodyear Tire & Rubber Company
- THE YOKOHAMA RUBBER CO., LTD.
- Trelleborg AB
- Trinseo
- TSRC
- UBE Corporation

Market Opportunities and Future Outlook
Opportunities are emerging around capacity localization, higher-performance synthetic grades, and decarbonized or certified feedstocks, supported by EV-related specifications, industrial hoses for energy applications, and tighter environmental compliance in major consuming regions. China is scaling higher-performance solution SBR for tire and industrial applications, with total SSBR capacity reported at 675,000 tonnes per year across 10 producers by May 2026, reinforcing a shift toward differentiated grades rather than commodity output. In the United States, Lion Elastomers announced plans in March 2026 to expand its Port Neches, Texas facility for nitrile rubber (NBR), a material relevant to oil and gas, chemical handling, and high-performance sealing, with the project targeting production start in September 2026.
Sustainability-linked procurement and circularity requirements also create whitespace for suppliers that can provide auditable content claims and lower lifecycle footprints without reducing industrial performance. ARLANXEO shifted its entire chloroprene rubber production to ISCC PLUS-certified chlorine in January 2026, aligning CR supply with certified inputs used by downstream customers for ESG and Scope 3 reporting. Michelin ResiCare and Axens entered negotiations in July 2026 to industrialize bio-based 5-HMF, with production planned at the Peage-de-Roussillon site starting in early 2027, indicating continued investment in platform molecules that can support bio-based pathways for elastomers and additives across industrial rubber formulations.
Recent Industry Developments in Industrial Rubber Market
- July 2026: Lone Star Funds announced a definitive agreement to acquire ContiTech, Continental AGs material solutions group, for EUR 4.0 billion with additional performance-based components of up to EUR 250 million. The transaction reshapes competitive positioning in industrial rubber components and materials, as Continental advances its strategy to focus on tires while ContiTechs industrial portfolio moves under a financial sponsor with scope for carve-out driven investment and portfolio optimization.
- September 2025: Continental commissioned a new recycling technology facility to recover raw materials from waste rubber using purified pyrolysis oil. The step strengthens circular feedstock availability for rubber value chains and supports customers seeking recycled-content pathways that reduce dependence on crude-oil-linked virgin inputs.
- October 2024: Bridgestone Americas received a US Department of Energy grant to pilot a process that converts ethanol to butadiene for synthetic rubber production. The project targets a non-fossil route to a critical monomer, aligning upstream material innovation with downstream demand for lower-carbon rubber compounds across industrial applications.


Industrial Rubber Market Report Scope and Research Methodology
Market Definition and Coverage
This market covers industrial-grade rubber materials and rubber-based components that are used in non-consumer operating environments, where rubber is selected for sealing, damping, conveying, protection, or fluid transfer.
Scope exclusions: We exclude tires and consumer footwear even if similar elastomer compounds are used.
Segments Covered in This Report
- By Rubber Type
- Natural Rubber
- Synthetic Rubber
- Reclaimed Rubber
- By Process
- Extrusion
- Molding and Casting
- Calendaring
- 3-D Printing / Additive Manufacturing
- By Application
- Conveyor Belts
- Transmission Belts
- Pressure Hoses
- Other Application (Roofing, Tubes, Rolls, etc.)
- By End-User Industry
- Automotive and Transportation
- Construction and Infrastructure
- Mining and Metals
- Industrial Machinery and Equipment
- Chemical and Petrochemical
- Aerospace and Defence
- Electrical and Electronics
- Other End-user Industries (Packaging Industry, etc.)
- By Geography
- Asia-Pacific
- China
- India
- Japan
- South Korea
- Thailand
- Indonesia
- Vietnam
- Malaysia
- Philippines
- Rest of Asia-Pacific
- North America
- United States
- Canada
- Mexico
- Europe
- Germany
- United Kingdom
- France
- Italy
- Spain
- Russia
- NORDIC Countries
- Turkey
- Rest of Europe
- South America
- Brazil
- Argentina
- Colombia
- Rest of South America
- Middle East and Africa
- Saudi Arabia
- United Arab Emirates
- Qatar
- South Africa
- Nigeria
- Egypt
- Rest of Middle East and Africa
- Asia-Pacific
Data Sources, Market Sizing, and Validation
Desk Research
Desk research was used to build the starting demand picture and keep assumptions realistic across regions. We relied on public macro and industry series such as U.S. Census Bureau industrial statistics, Eurostat manufacturing indicators, UN Comtrade trade flows for rubber articles, the International Rubber Study Group (IRSG) publications, and World Bank macro indicators for cross-country normalization.
On the supply and capacity side, company annual reports, investor presentations, and plant announcements helped validate expansions and utilization direction, along with reputable press and association sites that track downstream sectors like mining, construction, and industrial machinery. Patent databases were also reviewed to sense shifts in compounding, reclaimed content, and process adoption, and then these signals were carried into the model as directional checks. The desk sources listed are illustrative only, since many other public materials were also referred to for data collection, validation, and research clarification.
Primary Interviews and Surveys
Primary work focused on validating what the desk inputs could not settle cleanly, especially application mix, price realization, and regional run rates. We spoke with a spread of raw material and compound participants, processors, distributors, and downstream buying functions to pressure-test assumptions across APAC, EMEA, and the Americas before finalizing the model.
Distribution of primary research fieldwork respondents
| Company type | Respondent position | Region |
|---|---|---|
| Top tier: 36% | CXOs: 14% | APAC: 48% |
| Mid tier: 43% | Functional/Unit leaders: 39% | EMEA: 33% |
| Smaller Players: 21% | Managers: 47% | Americas: 19% |
Market-Sizing & Forecasting
Market sizing was built using top-down and bottom-up logic, with the core totals constructed from industrial output and trade signals that reconstruct rubber goods consumption by end-use industries. In practice, rubber demand pools were linked to indicators such as manufacturing value add, mining and construction activity, machinery output, and regional import-export balances for rubber articles, which then were converted into value using application-level pricing direction.
To keep the totals grounded, selective bottom-up approximations were used as cross-checks, including sampled price per kg trends for common compounds, channel feedback on volume momentum for belts and hoses, and supplier-side capacity and utilization direction. Where gaps were present for smaller countries or niche applications, proxy ratios from similar industrial structures were applied first, and then adjusted after interview feedback so the math stayed consistent.
For forecasting, scenario analysis was used around a central case, because industrial rubber is sensitive to cyclical sectors and energy and feedstock swings. Assumptions were updated for variables like industrial production growth, infrastructure spending intensity, mining capex cycles, replacement demand patterns for conveyor and transmission belts, and reclaimed rubber penetration (which affects effective demand for virgin material).
Data Validation & Update Cycle
Outputs were validated through multiple checks so the final numbers do not drift away from observable market signals. We compared model results against independent indicators like trade balances for rubber articles, industrial production indices, and major downstream activity trends, and then investigated large variances before sign-off.
A second analyst review was used to test arithmetic integrity, assumption consistency across regions, and year-to-year reasonableness in both volume drivers and price movement. Reports are refreshed annually, and interim updates are triggered when material events occur, such as major capacity changes, sharp feedstock price resets, or policy moves that alter reclaimed content adoption. Before delivery, a fresh review pass is completed so clients receive the latest updated view.
Mordor Intelligence's Industrial Rubber Market Size Compared With Other Published Estimates
Published market sizes for industrial rubber can vary a lot, even when the topic label looks the same. Differences usually come from what product families are counted, how regions and currencies are treated, and whether pricing is modeled as a stable average or as a moving value that reflects recent volatility.
Tires and consumer footwear are excluded because they sit outside Mordor Intelligence's scope for this market, and some published numbers appear to fold those adjacent rubber uses into a broader rubber products total. Another recurring gap is timing, since some sources anchor their value on a 2025 base year and then extend long forecasts, while others use a nearer industrial cycle point and update trade and pricing inputs more frequently.
Benchmark comparison
| Source | Market Size | Gaps in Research Methodology |
|---|---|---|
| Mordor Intelligence | USD 16.88 B (2026) | |
| Global Consultancy A | USD 31.70 B (2025) | Uses a broader product basket that appears to include additional rubber goods beyond industrial applications, and it anchors values to a 2025 base that can overstate near-term size if pricing normalization is assumed. |
| Industry Publisher B | USD 26.26 B (2025) | Leans on a wider application map that can pull in overlapping categories (for example, polymer modification and adjacent rubber uses), and long-range growth is presented from a 2025 starting point without clearly showing the intermediate price and trade checks. |
Across the table, the spread is largely explained by scope breadth and the year chosen for the starting value. By keeping inclusions tied to industrial use cases and by cross-checking totals against trade and manufacturing signals, our estimate stays traceable to clear variables and repeatable steps.


Key Questions Answered in the Report
How large will global demand for industrial rubber be by 2031?
The industrial rubber market size is projected to reach USD 20.36 billion by 2031, advancing at a 3.81% CAGR from 2026.
Which rubber type is expanding fastest?
Reclaimed rubber is growing at a 5.06% CAGR as regulators push recycled-content mandates in Europe and China.
What drives conveyor-belt demand?
Mining CAPEX, logistics automation, and infrastructure megaprojects in Asia-Pacific and South America are raising conveyor-belt installations, driving a 4.91% CAGR through 2031.
Why are high-pressure hydraulic hoses gaining traction?
Offshore oil, subsea construction, and shale gas operations need hoses rated above 350 bar and ISO 18752 compliant to handle higher pressures and cycles.
How are environmental rules affecting producers?
EU microplastics restrictions, China VOC limits, and possible tighter U.S. ozone caps raise testing and abatement costs, collectively reducing the forecast CAGR by 0.8 percentage point.
Page last updated on:


 Your data is secure and never sold or shared.


