Synthetic Rubber Market Size and Share
Market Overview
| Study Period | 2021 - 2031 |
|---|---|
| Market Size (2026) | USD 36.30 Billion |
| Market Size (2031) | USD 44.69 Billion |
| Growth Rate (2026 - 2031) | 4.25% CAGR |
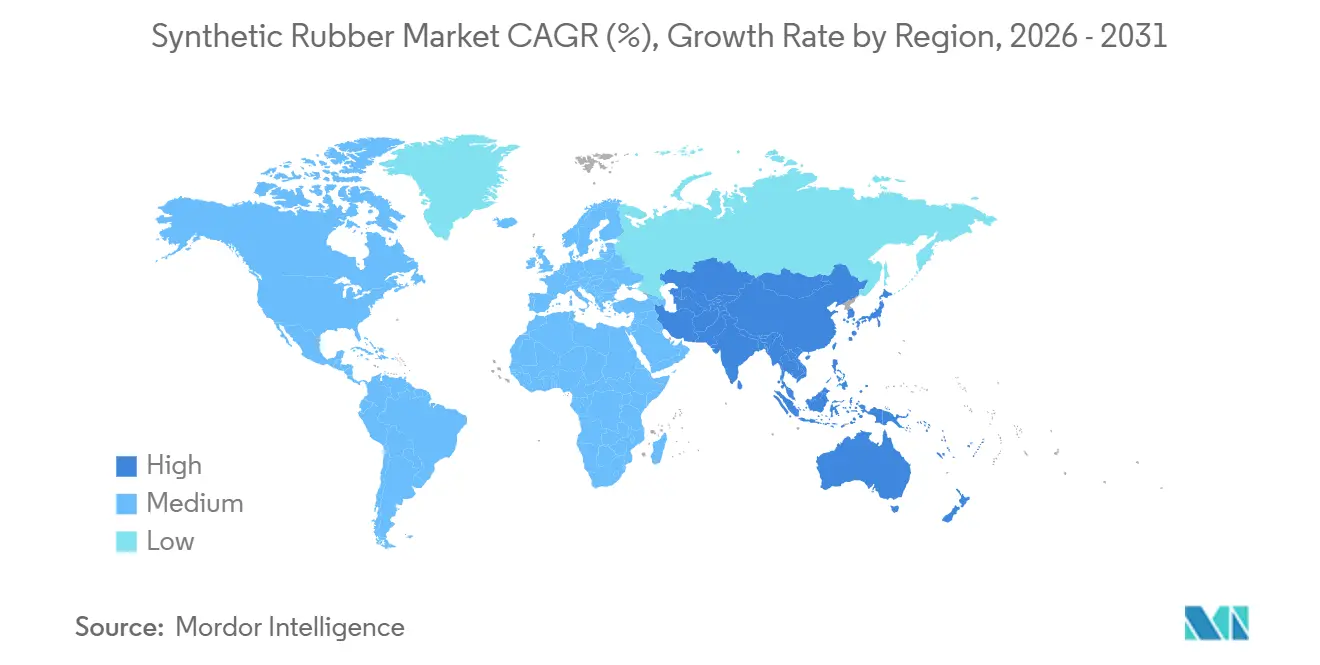
| Fastest Growing Market | Asia-Pacific |
| Largest Market | Asia-Pacific |
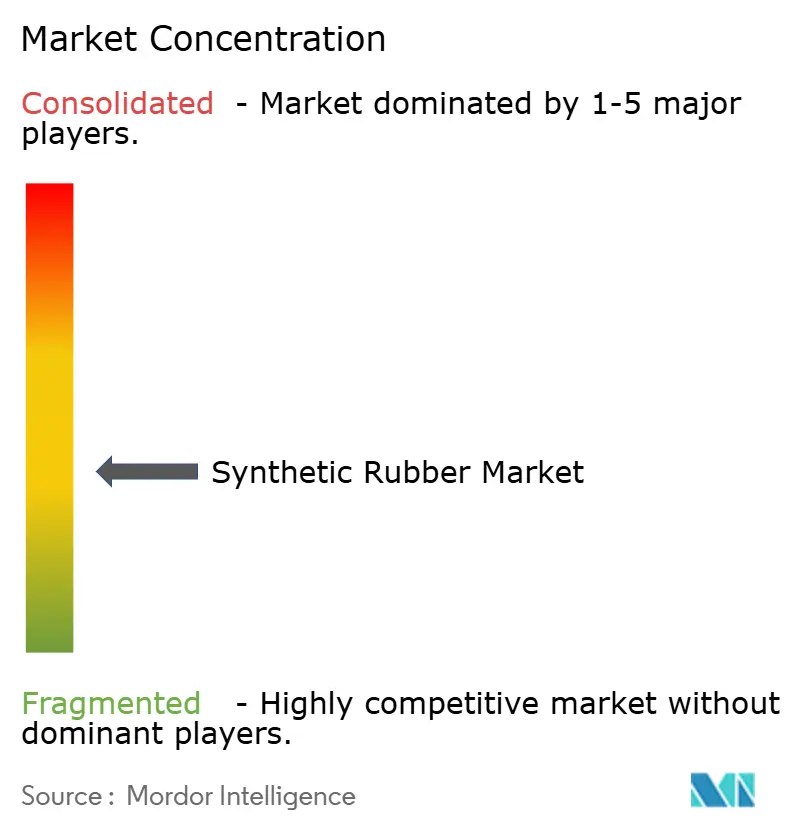
| Market Concentration | Low |
Major Players *Disclaimer: Major Players sorted in no particular order Image © Mordor Intelligence. Reuse requires attribution under CC BY 4.0. | |
Synthetic Rubber Market Analysis by Mordor Intelligence
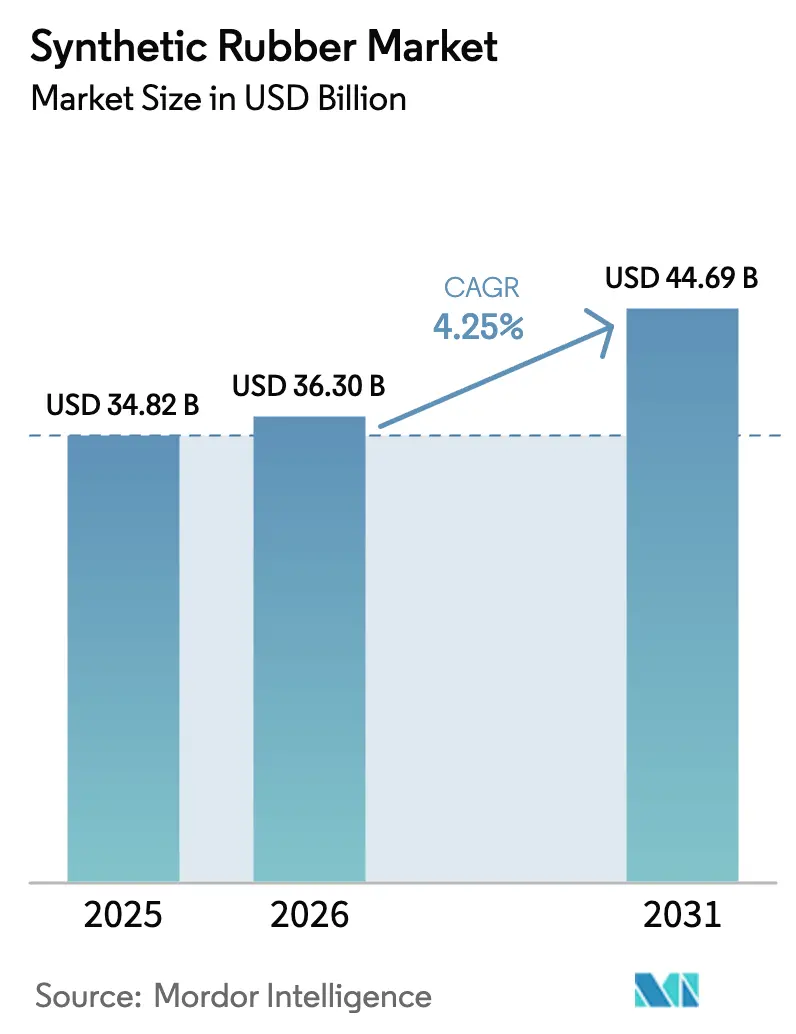
The Synthetic Rubber Market size is projected to be USD 34.82 billion in 2025, USD 36.30 billion in 2026, and reach USD 44.69 billion by 2031, growing at a CAGR of 4.25% from 2026 to 2031. Rising demand for electric-vehicle (EV) tires, industrial seals for renewable-energy assets, and bio-based feedstock initiatives underpin this expansion of the synthetic rubber market. Producers able to supply solution-polymerized SBR (S-SBR) with functionalized chain ends that bond to silica fillers now win long-term EV contracts, while vertical integration into butadiene keeps input cost volatility in check. Asia-Pacific remains the volume anchor of the synthetic rubber market, yet North America’s pilot plants for ethanol-to-butadiene and bio-isoprene signal a strategic hedge against crude-derived feedstocks. Regulatory pressure on PFAS in fluoro-elastomers and substitution by thermoplastic polyurethanes (TPU) in non-critical seals temper overall growth but also accelerate innovation toward greener, recyclable grades of synthetic rubber polymers.
Key Report Takeaways
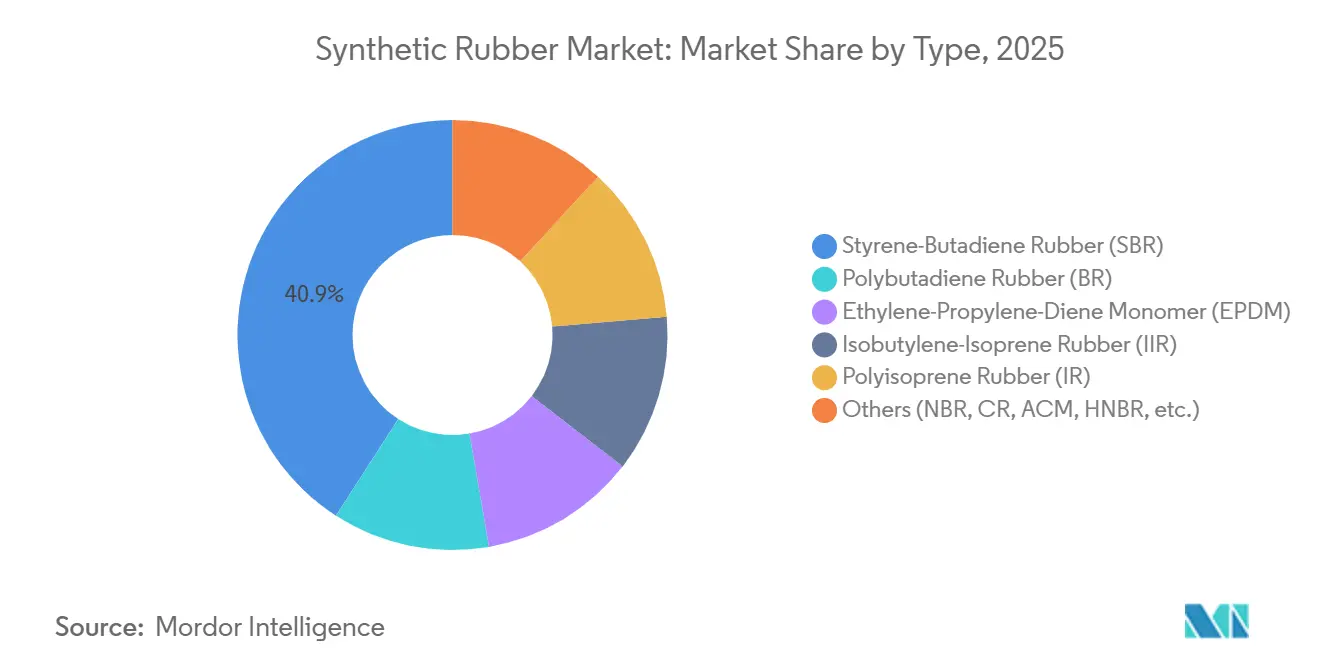
- By type, styrene-butadiene rubber captured 40.89% of the synthetic rubber market share in 2025, whereas EPDM is projected to register the fastest 5.81% CAGR through 2031.
- By manufacturing process, emulsion polymerization held 61.67% of the synthetic rubber market in 2025; solution polymerization is forecast to expand at a 5.66% CAGR out to 2031.
- By raw material, butadiene accounted for 50.85% revenue share of the synthetic rubber market in 2025, while bio-based isoprene and others are anticipated to register the fastest CAGR of 8.49% through 2031.
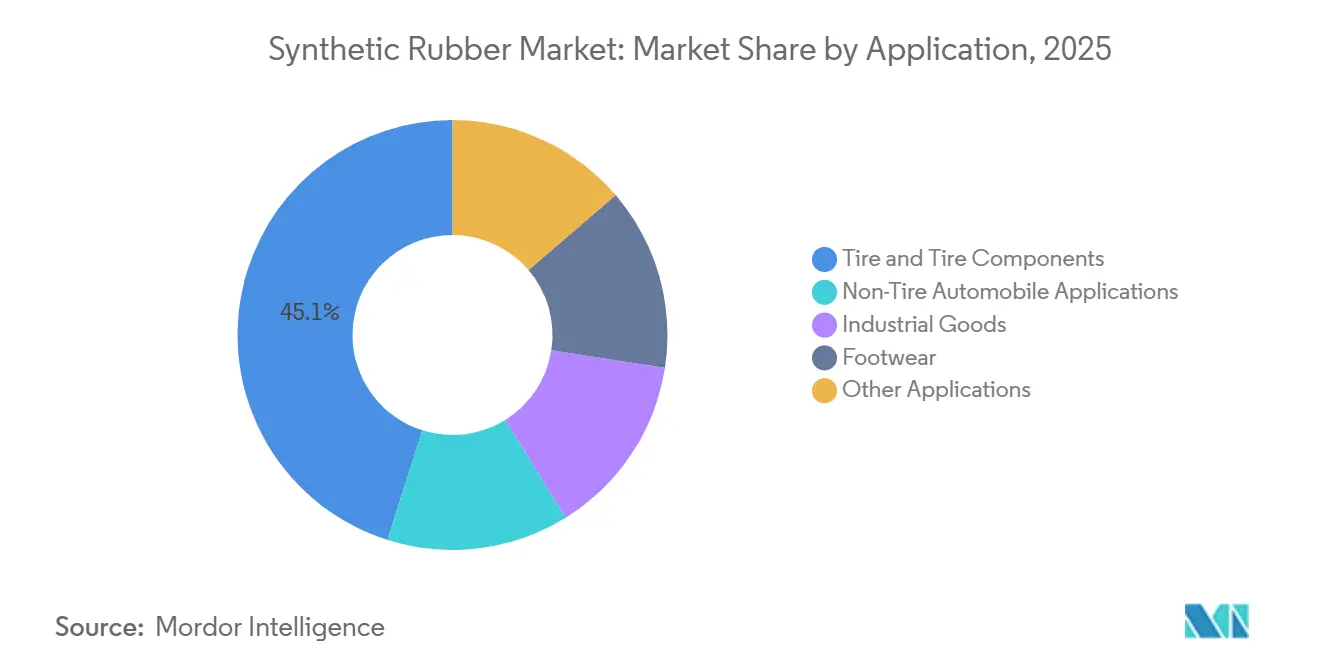
- By application, tires and tire components accounted for 45.12% of the synthetic rubber market size in 2025, while industrial goods are poised to grow at a 4.58% CAGR between 2026-2031.
- By geography, Asia-Pacific led with 57.89% revenue share in 2025 and is on track for the highest 4.46% CAGR through 2031.
Note: Market size and forecast figures in this report are generated using Mordor Intelligence’s proprietary estimation framework, updated with the latest available data and insights as of January 2026.
Global Synthetic Rubber Market Trends and Insights
Drivers Impact Analysis*
| Drivers | (~) % Impact on CAGR Forecast | Geographic Relevance | Impact Timeline |
|---|---|---|---|
| Surging demand for high-performance tires from EV OEMs | +0.9% | Global, with concentration in China, North America, Europe | Medium term (2-4 years) |
| Growth of industrial rubber goods for renewable-energy installations | +0.6% | Global, led by Europe, North America, and coastal APAC | Long term (≥ 4 years) |
| Advancements in medical and healthcare applications | +0.4% | North America, Europe, India | Medium term (2-4 years) |
| Shift toward bio-based monomers in North America | +0.5% | North America, with pilot activity in Europe | Long term (≥ 4 years) |
| Expansion of 5G infrastructure driving EPDM seal consumption | +0.3% | APAC core, spill-over to MEA | Short term (≤ 2 years) |
| Source: Mordor Intelligence | |||
Surging Demand for High-Performance Tires from EV OEMs
Electric-vehicle torque and battery mass raise tread wear by 20-30%, driving OEMs toward S-SBR formulations that bond to silica fillers and cut rolling resistance up to 20%. Tesla’s 2024 supply contracts and BYD’s 2025 in-house compounding push producers to retrofit continuous solution reactors despite USD 50-80 million capital outlays. Tier-1 suppliers without functionalized grades risk contract losses as EV sales head toward 20% of global light-vehicle volume in 2027. Aerodynamic gains from thinner sidewalls further link tire chemistry to vehicle range, cementing the synthetic rubber market as a strategic lever for automakers.
Growth of Industrial Rubber Goods for Renewable-Energy Installations
Wind-turbine nacelles cycle between −40 °C and +60 °C, requiring EPDM seals with ozone resistance beyond natural rubber limits. Dow’s 2025 launch of NORDEL REN EPDM with 50% bio-carbon secured approvals at Vestas and Siemens Gamesa, while lithium-mine conveyor belts specify nitrile grades that withstand brine and sub-zero exposure. These high-value niches underpin the 4.58% CAGR forecast for industrial goods inside the synthetic rubber market.
Advancements in Medical and Healthcare Applications
Bromobutyl and chlorobutyl stoppers meet USP <381> extractables and repeated autoclave cycles, extending shelf life for mRNA vaccines. FDA’s 2024 latex-protein guidance accelerated polyisoprene glove adoption, spurring Apcotex to add capacity in 2025[1]U.S. Food and Drug Administration, “Medical Glove Guidance,” fda.gov . Medical-grade elastomers earn 30-50% premiums yet require cleanroom polymerization, shaping a specialty pocket of the synthetic rubber market.
Shift Toward Bio-Based Monomers in North America
Bridgestone’s USD 5 million DOE grant funds a Tennessee demo plant converting ethanol to butadiene at 10 ktpa, aiming for 2027 start-up[2]Bridgestone Corp., “DOE Grant for Bio-Butadiene Demo Plant,” bridgestone.com. Goodyear and Visolis pursue bio-isoprene from sugarcane bagasse, mitigating crude-linked feedstock swings that moved Asian butadiene from USD 900 t to USD 1,500 t between 2024-2025. Although bio-monomers will supply around 5% of volume by 2031, their branding value justifies ongoing research and development across the synthetic rubber market.
Restraints Impact Analysis*
| Restraints | (~) % Impact on CAGR Forecast | Geographic Relevance | Impact Timeline |
|---|---|---|---|
| Volatility in butadiene feedstock prices | -0.7% | Global, most acute in Asia-Pacific import markets | Short term (≤ 2 years) |
| Substitution by high-performance polyurethanes in seals and gaskets | -0.4% | North America, Europe, with adoption spreading to APAC | Medium term (2-4 years) |
| PFAS-linked regulatory pressure on fluoro-elastomer blends | -0.2% | North America, Europe | Long term (≥ 4 years) |
| Source: Mordor Intelligence | |||
Volatility in Butadiene Feedstock Prices
Spot butadiene in Asia climbed 67% from 2024-2025 on cracker outages, squeezing emulsion-SBR margins when tire makers resisted price hikes. Solution-grade plants faced USD 100-150 t purity premiums, eroding their cost advantage. Vertical integration by Saudi Aramco and SABIC secures captive streams, yet independent producers in India remain exposed, forcing higher inventories that strain working capital.
Substitution by High-Performance Polyurethanes in Seals and Gaskets
TPU door seals now hold 15-20% share because of lower compression set and recyclability, meeting European circular-economy mandates. HVAC makers in North America switched to foam-in-place polyurethanes in 2025, cutting assembly times by 30%. While high-temperature zones still rely on FKM or HNBR, synthetic rubber market suppliers are rushing pre-vulcanized EPDM compounds to defend their share.
*Our forecasts treat driver/restraint impacts as directional, not additive. The impact forecasts reflect baseline growth, mix effects, and variable interactions.
Segment Analysis
By Type: Solution-Grade SBR Gains on EV Tire Specifications
Styrene-butadiene rubber commanded 40.89% of the synthetic rubber market share in 2025, benefiting from replacement-tire cost advantages. Ethylene-Propylene-Diene Monomer (EPDM) is projected to post the fastest 5.81% CAGR as roofing retrofits and NVH upgrades proliferate. Polybutadiene blends enhance winter-tire flexibility, while butyl retains premium pricing in pharmaceutical stoppers. The synthetic rubber market size attributed to EPDM is anticipated to expand significantly by 2031, reflecting its versatile weathering profile. Solution-SBR grades dominate ultra-high-performance tires as EV adoption ramps, aided by investments at LG Chem and Kumho Petrochemical.
Continuous reactor retrofits cost USD 50-80 million per 100 kt line, favoring incumbents with access to low-cost finance. ARLANXEO’s Keltan ECO EPDM, launched in 2025, embeds 70% bio-carbon and helps automotive OEMs reduce Scope 3 emissions. Specialty nitrile and chloroprene remain valuable in oil-field seals and flame-retardant cable jackets, capturing price premiums despite modest volumes. As EVs cross the 20% sales threshold in 2027, type-mix will tilt toward solution-grade SBR, tightening competitive dynamics inside the synthetic rubber market.


By Manufacturing Process: Continuous Lines Cut Energy Costs
Emulsion polymerization represented 61.67% of capacity in 2025, yet solution processes will grow at a 5.66% CAGR due to tighter molecular-weight control and solvent-loop efficiency. LG Chem’s Yeosu expansion adds automated dosing for viscosity uniformity, trimming variance by 40%. Continuous gas-phase technology remains confined to specialty high-cis polybutadiene but reduces energy intensity below 2.5 GJ t, beating older batch reactors.
Batch emulsion units built pre-2010 consume 20-30% more steam and generate high-COD latex effluent, pushing operators toward costly wastewater retrofits. Kumho Petrochemical’s 40 kt solution-SBR project, slated for 2027, targets North American EV tire demand exempt from anti-dumping duties. The process mix shift underlines sustainability pressures shaping the synthetic rubber market.
By Raw Material: Bio-Feedstocks Command Green Premiums
By raw material, Butadiene comprised 50.85% of the synthetic rubber market in 2025, with sourcing concentrated in Asia and the Middle East. Bio-isoprene and other specialty monomers will post the fastest 8.49% CAGR as Bridgestone and Michelin demonstrators validate renewable economics above USD 85 barrel crude. Synthetic rubber market size linked to bio-feedstocks is small today, yet commands 10-20% premiums that fleets and medical buyers increasingly accept.
Styrene costs follow benzene, compressing SBR margins when crude falls more slowly than polymer demand. Ethylene- and propylene-based EPDM benefits from shale-origin surplus in North America, sustaining cost competitiveness. Specialty monomers such as acrylonitrile and chloroprene anchor niche volumes but have high value in oil-resistant hoses and flame-retardant cables, reinforcing diverse feedstock needs inside the synthetic rubber market.
By Application: Industrial Goods Outpace Tire Replacement
Tires and tire components accounted for 45.12% of market revenue in 2025, yet industrial goods are forecast to grow at a 4.58% CAGR, the fastest among end uses. Conveyor belts for lithium mining, EPDM seals for wind turbines, and vibration dampers for data centers fuel this outperformance. OEM tire demand remains cyclical with vehicle production, whereas industrial goods track equipment utilization, offering steadier revenue streams.
Footwear retains cost-sensitive volumes in Asia, while non-tire automotive parts such as engine mounts face TPU substitution in low-temperature zones. Apollo Tyres’ Andhra Pradesh plant illustrates backward integration that cuts lead times and currency risk. MRF’s 2025 radial-tire expansion underscores heavier synthetic-rubber loading per unit, boosting absolute demand despite market share stability.
Geography Analysis
Asia-Pacific commanded 57.89% of the synthetic rubber market revenue in 2025 and is projected to advance at a 4.46% CAGR through 2031. India’s radial-tire lines and China’s EV boom offset margin pressure from butadiene spikes above USD 1,400 per ton. ASEAN nations gain FDI as tariff-free hubs into Australia and Japan, diversifying regional supply.
North America's synthetic rubber demand is driven by USMCA reshoring and DOE-funded bio-monomer pilots. Bridgestone’s ethanol-to-butadiene demo and Goodyear’s Visolis tie-up position the region at the forefront of renewable feedstock commercialization.
Europe accounts for significant demand but faces REACH microplastic rules and PFAS scrutiny, nudging formulators toward non-fluorinated chemistries. However, the continent’s aged roofing stock drives EPDM retrofits at attractive margins. The Middle East integrates downstream via Saudi Aramco’s synthetic-rubber assets and SABIC’s Fujian complex, targeting export sales into Asia and Europe. South America’s synthetic rubber demand concentrates in Brazil’s replacement-tire segment, while Nigeria’s nascent assembly industry promises incremental demand post-2027.

Competitive Landscape
The synthetic rubber market is moderately fragmented. Sinopec capitalizes on refinery integration to maintain cost leadership in Asia, while Western manufacturers focus on high-margin specialty segments. Asian producers are ramping up capacity, particularly in China’s Guangdong and Liaoning provinces, to meet growing domestic demand from the EV and infrastructure sectors. Western competitors are optimizing portfolios through divestitures and targeted acquisitions in healthcare and aerospace. Start-ups focusing on fermented isoprene and biologically synthesized butadiene are attracting venture capital, intensifying competition for established petrochemical players.
Synthetic Rubber Industry Leaders
China Petrochemical Corporation
Arlanxeo
Kumho Petrochemical
Synthos
LG Chem
- *Disclaimer: Major Players sorted in no particular order

Recent Industry Developments
- December 2025: LG Chem committed USD 300 million to add 50 ktpa solution-SBR at Yeosu, targeting EV tire compounds.
- September 2025: Kumho Petrochemical secured USD 200 million to build a 40 ktpa solution-SBR line for Q3 2027 start-up.
- January 2025: ARLANXEO launched Keltan ECO EPDM with 70% bio-content for automotive weatherstrips and roofing membranes.


Research Methodology Framework and Report Scope
Market Definitions and Key Coverage
Our study defines the synthetic rubber market as the value generated from sales of petro-based or bio-based elastomer polymers, such as SBR, BR, EPDM, NBR, IIR, SBC, and other specialty grades, sold in primary solid or liquid form to downstream converters and end-users. Products compounded into finished tires, belts, hoses, seals, footwear, or adhesives are therefore outside the revenue pool; only first-sale material is counted.
Scope Exclusion: natural rubber is not covered.
Segmentation Overview
- By Type
- Styrene-Butadiene Rubber (SBR)
- Polybutadiene Rubber (BR)
- Ethylene-Propylene-Diene Monomer (EPDM)
- Isobutylene-Isoprene Rubber (IIR)
- Polyisoprene Rubber (IR)
- Others (NBR, CR, ACM, HNBR, etc.)
- By Manufacturing Process
- Emulsion Polymerization (E-SBR)
- Solution Polymerization (S-SBR)
- Advanced Continuous Polymerization
- By Raw Material
- Butadiene
- Isoprene
- Styrene
- Ethylene and Propylene
- Other Specialty Monomers (ACN, Chloroprene)
- By Application
- Tire and Tire Components
- Non-Tire Automobile Applications
- Industrial Goods
- Footwear
- Other Applications
- By Geography
- Asia-Pacific
- China
- India
- Japan
- South Korea
- Malaysia
- Thailand
- Vietnam
- Indonesia
- Rest of Asia-Pacific
- North America
- United States
- Canada
- Mexico
- Europe
- Germany
- United Kingdom
- France
- Italy
- Spain
- Russia
- Nordics
- Turkey
- Rest of Europe
- South America
- Brazil
- Argentina
- Colombia
- Rest of South America
- Middle East and Africa
- Saudi Arabia
- United Arab Emirates
- Qatar
- South Africa
- Egypt
- Nigeria
- Rest of Middle East and Africa
- Asia-Pacific
Detailed Research Methodology and Data Validation
Primary Research
Mordor analysts interviewed procurement managers at tire majors, compound formulators, polymer traders, and equipment suppliers across Asia-Pacific, Europe, and North America. These discussions clarified plant utilization swings, grade-specific premiums, and the pace at which EV makers shift toward solution-polymerized SBR, letting us validate desk findings and fine-tune regional assumptions.
Desk Research
We began by mapping historical supply using plant-level capacity and output disclosed by customs statistics and trade trackers, such as UN Comtrade, Eurostat-Comext, U.S. ITC DataWeb, and Japan's Ministry of Finance, to estimate cross-border flows. Industry balance sheets from the International Rubber Study Group, price indices from the U.S. Energy Information Administration, and feedstock contract data posted by ICIS further anchor feedstock-to-polymer conversion ratios.
Annual reports, 10-Ks, and investor decks from leading elastomer producers add pricing guidance, while regulatory documents (for example, EU REACH restriction dossiers on PAH content in SBR) signal demand inflections. Subscription resources in Mordor's stack, D&B Hoovers for company financials and Dow Jones Factiva for deal tracking, help us screen abnormal revenue jumps. This list is illustrative, not exhaustive, and many additional sources supported data gathering and validation.
Market-Sizing & Forecasting
A top-down reconstruction starts with global synthetic rubber production and trade volumes, which are then priced using weighted average transaction values to yield 2025 revenue. Selective bottom-up checks, capacity × utilization roll-ups for 25 key plants and sampled ASP-per-grade quotes, ensure totals remain realistic. Key variables fed into the model include butadiene feedstock prices, new light-vehicle output, replacement-tire shipments, industrial PMI trends, and regional construction spending. A multivariate regression, stress-tested through scenario analysis, projects demand to 2030; gaps where plant data were missing were closed using conservative regional penetration benchmarks discussed with experts.
Data Validation & Update Cycle
Outputs pass automated variance scans against historical series, followed by two-step analyst peer reviews. Reports refresh each year, and interim updates are triggered when feedstock shocks, capacity closures, or demand-side policy shifts move modeled values by over three percent.
Why Mordor's Synthetic Rubber Baseline Inspires Confidence
Published estimates often diverge because firms slice the market differently, choose unlike price sets, or refresh on separate cadences.
Key gap drivers include whether recycled or downstream compounded rubber is counted, how aggressively future EV tire penetration is assumed, and the currency-conversion month each provider adopts. Mordor discloses its scope, uses dual-route modeling, and refreshes annually, which reduces such drift.
Benchmark comparison
| Market Size | Anonymized source | Primary gap driver |
|---|---|---|
| USD 34.83 B (2025) | Mordor Intelligence | - |
| USD 32.84 B (2024) | Regional Consultancy A | Includes limited liquid grades only, one-year older base |
| USD 28.28 B (2024) | Global Consultancy A | Treats synthetic segment as share of total rubber, excludes specialty elastomers |
| USD 23.00 B (2022) | Trade Journal B | Historic base year, narrower application scope, bi-annual refresh |
In summary, by declaring scope up front, triangulating volumes with capacity checks, and refreshing figures yearly, Mordor delivers a balanced, transparent baseline that decision-makers can retrace and replicate with confidence.


Key Questions Answered in the Report
What is the current global value of the synthetic rubber market?
The synthetic rubber market size is estimated at USD 36.30 billion in 2026.
How fast is demand for synthetic rubber expected to grow?
Between 2026-2031, the market is forecast to post a 4.25% CAGR, reaching USD 44.69 billion by 2031.
Which polymer type will grow the quickest?
EPDM is projected to expand at a 5.81% CAGR through 2031 due to roofing and automotive weatherstrip upgrades.
What region leads synthetic rubber consumption?
Asia-Pacific held 57.89% of 2025 revenue share and remains the largest and fastest-growing regional consumer.
How are EVs influencing tire-grade rubber demand?
EV torque and efficiency targets push OEMs toward solution-SBR with silica bonding, driving new capacity investments.
Are bio-based feedstocks commercially viable in synthetic rubber?
Pilot plants for ethanol-to-butadiene and bio-isoprene are online, and commercial uptake is expected once crude stays above USD 85 per barrel.
Page last updated on:


