
Styrene Butadiene Rubber (SBR) Market Size and Share
Market Overview
| Study Period | 2020 - 2031 |
|---|---|
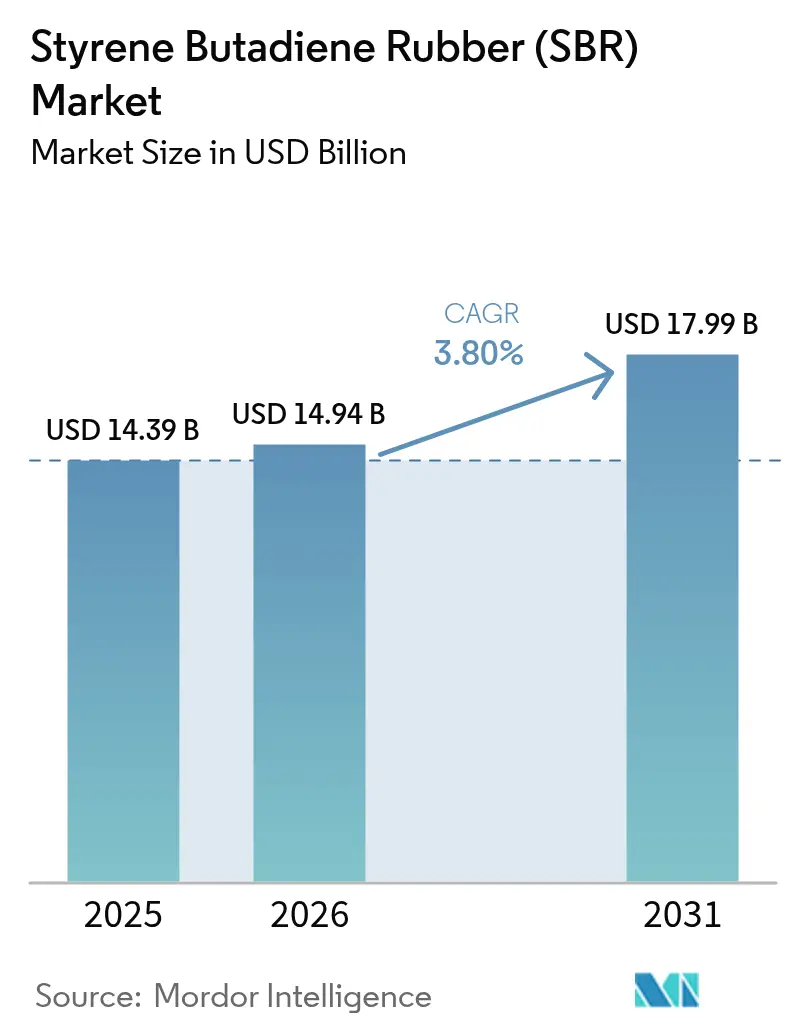
| Market Size (2026) | USD 14.94 Billion |
| Market Size (2031) | USD 17.99 Billion |
| Growth Rate (2026 - 2031) | 3.80 % |
| Fastest Growing Market | Asia Pacific |
| Largest Market | Asia Pacific |
| Market Concentration | Medium |
Major Players *Disclaimer: Major Players sorted in no particular order Image © Mordor Intelligence. Reuse requires attribution under CC BY 4.0. | |
Styrene Butadiene Rubber (SBR) Market Analysis by Mordor Intelligence
The Styrene Butadiene Rubber Market size is expected to grow from USD 14.39 billion in 2025 to USD 14.94 billion in 2026 and is forecast to reach USD 17.99 billion by 2031 at 3.80% CAGR over 2026-2031. Strong tire demand in emerging economies, sustained infrastructure investment, and mandatory sustainability regulations shape this moderate growth path. Investments in low-rolling-resistance tire technology, expanding adhesive usage in construction and packaging, and polymer-modified asphalt specifications all strengthen the consumption outlook. At the same time, crude-linked feedstock volatility, stricter carbon rules, and mounting competition from thermoplastic elastomers temper volume and pricing power. Asian manufacturing clusters reinforce global leadership by pairing large-scale capacity with proximity to automotive customers, whereas Western producers pursue divestitures and sustainable product pivots to protect margins.
Key Report Takeaways
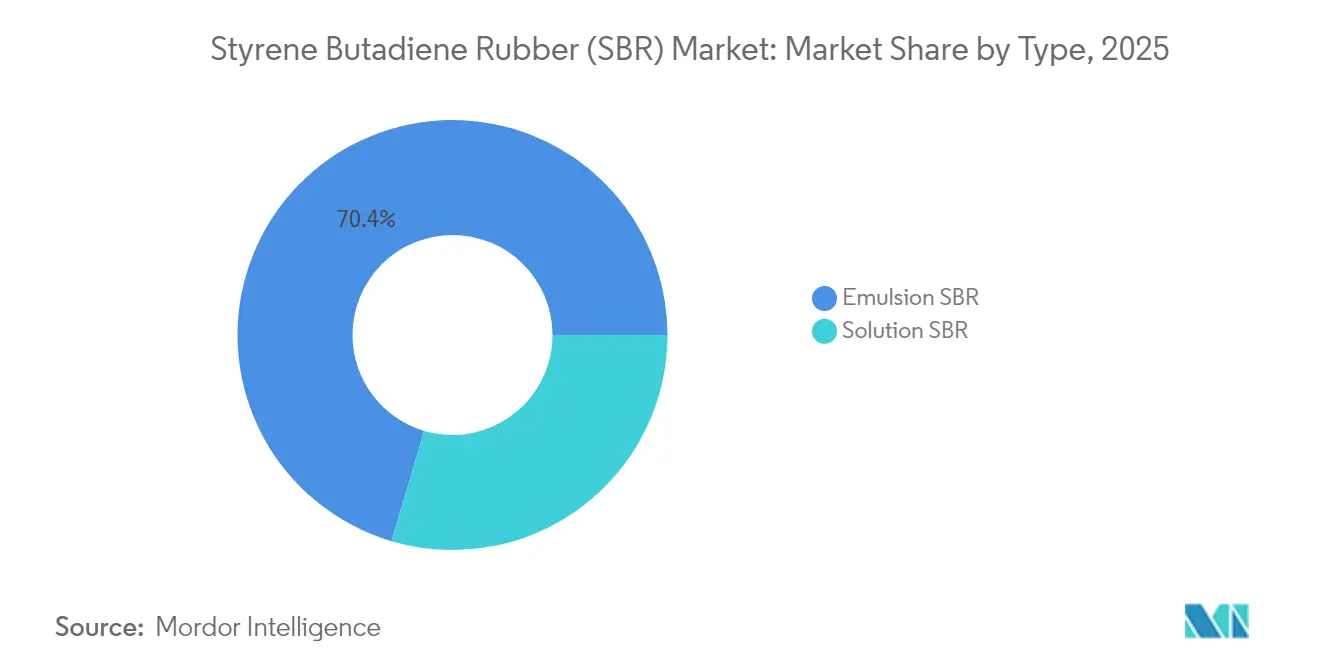
- By type, emulsion SBR held 70.42% of the Styrene Butadiene Rubber market share in 2025, while solution SBR posted the fastest 4.27% CAGR to 2031.
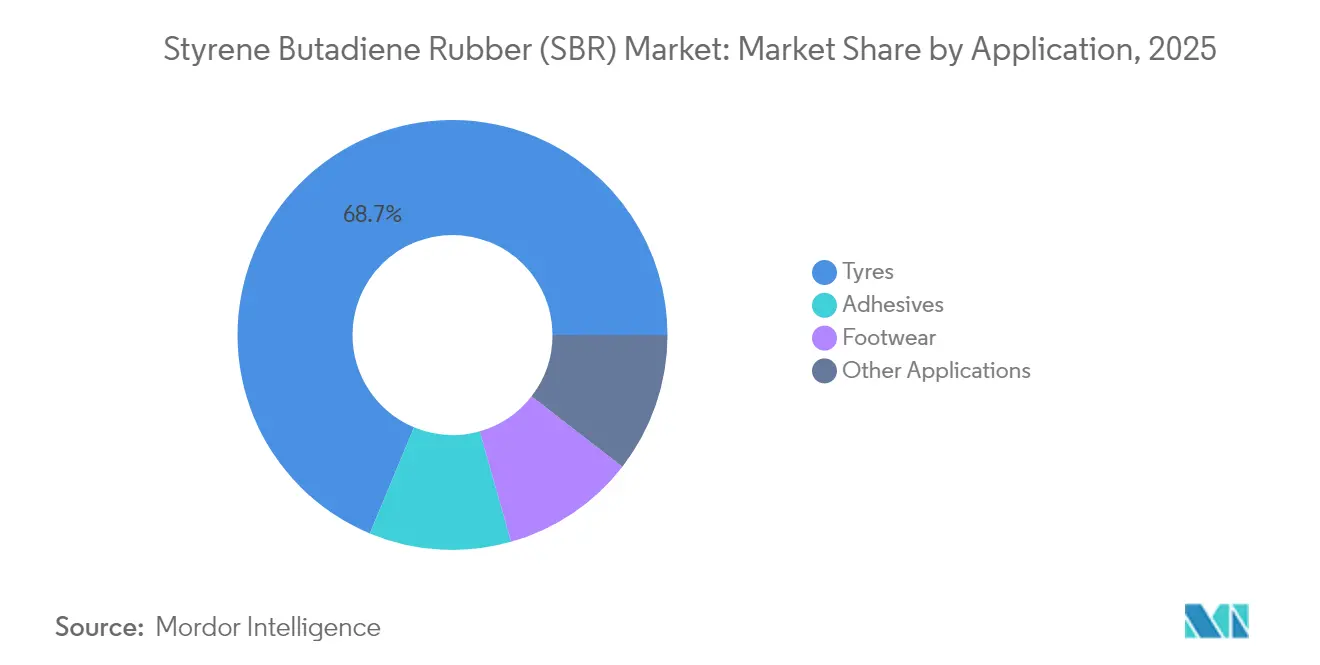
- By application, tires accounted for 68.72% of the Styrene Butadiene Rubber market size in 2025; adhesives are on track for the highest 4.39% CAGR through 2031.
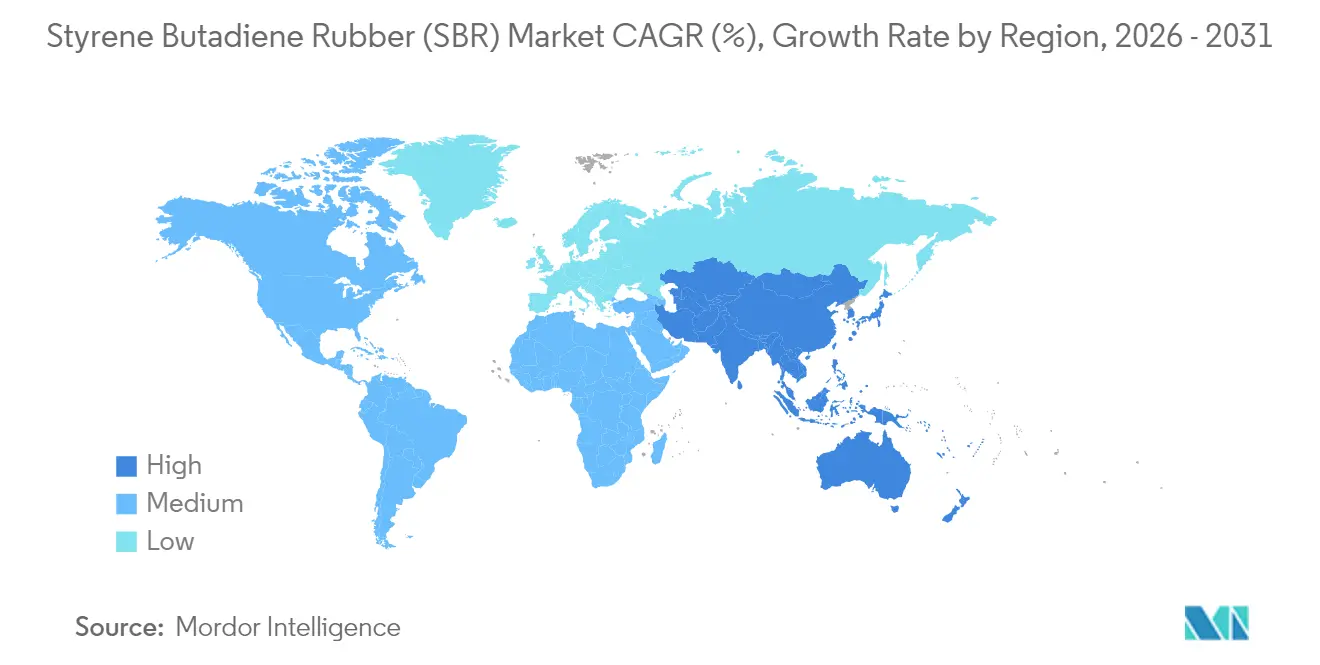
- By geography, Asia-Pacific commanded 45.10% revenue in 2025 and is advancing at a 4.17% CAGR up to 2031.
Note: Market size and forecast figures in this report are generated using Mordor Intelligence’s proprietary estimation framework, updated with the latest available data and insights as of 2026.
Global Styrene Butadiene Rubber (SBR) Market Trends and Insights
Drivers Impact Analysis*
| Driver | (~) % Impact on CAGR Forecast | Geographic Relevance | Impact Timeline |
|---|---|---|---|
| Tire replacement demand spike in emerging economies | +0.8% | Asia-Pacific, Latin America, MEA | Medium term (2-4 years) |
| Shift toward low-rolling-resistance tires in EU & China | +0.6% | Europe, China | Short term (≤2 years) |
| Rapid highway & airport construction boosting polymer-modified asphalt | +0.4% | Global, concentrated in Asia-Pacific | Long term (≥4 years) |
| OEM push for 10% tread weight reduction via functionalised S-SBR | +0.3% | Global automotive hubs | Medium term (2-4 years) |
| Mandatory wet-grip labelling in ASEAN spurring high-vinyl S-SBR uptake | +0.2% | ASEAN markets | Short term (≤2 years) |
| Source: Mordor Intelligence | |||
Tire Replacement Demand Spike in Emerging Economies
Vehicle fleet expansion combined with improved road networks significantly raises tire wear rates, pushing Styrene Butadiene Rubber market demand for tire compounds. Replacement tires already contribute 60% of total tire consumption in India, and Bridgestone has responded by committing USD 85 million to expand local production capacity. Radial tire adoption multiplies SBR usage per unit, further escalating volumes. Replacement cycles remain less affected by economic slowdowns than OEM demand, providing downside protection during industry troughs. Emerging Asia and Latin America therefore deliver a reliable mid-term uplift to global sales.
Shift Toward Low-Rolling-Resistance Tires in EU & China
Regulations aimed at fleet fuel efficiency elevate demand for solution SBR grades that enable silica-filled tread compounds with lower hysteresis. EU consumer labeling has already shifted purchasing toward A-rated rolling-resistance products, with manufacturers recording 15-20% volume growth in these premium categories[1]European Commission, “Tire Labeling Regulation Impact Assessment,” ec.europa.eu. China mirrors the trend in heavy-duty segments, translating to sizeable opportunities for suppliers capable of advanced functionalisation. The widening performance gap between emulsion and solution SBR reinforces price premiums for high-spec polymers while rewarding R&D-driven producers.
Rapid Highway & Airport Construction Boosting Polymer-Modified Asphalt
Asia-Pacific infrastructure programs accelerate consumption of SBR-modified asphalt that delivers enhanced rutting resistance and flexibility. Laboratory data show 18.8% higher stability and 46.2% stronger dynamic creep stiffness when 5% SBR is blended into asphalt binders[2]Illinois Department of Transportation, “Polymer Modified Asphalt Performance Study,” idot.illinois.gov. Such performance gains justify the material premium for runways and expressways exposed to extreme loads. Because infrastructure spending is usually multi-year, the application gives producers a long-wave demand pillar that diversifies away from cyclical automotive sales and strengthens the Styrene Butadiene Rubber market.
OEM Push for 10% Tread Weight Reduction via Functionalised S-SBR
Automakers require lighter tires to improve fuel economy and extend electric vehicle range, stimulating uptake of functionalised S-SBR with stronger filler bonds. Michelin’s roadmap to produce bio-based synthetic rubber with 40% renewable content by 2030 underscores this objective. Weight-reduction programs favour suppliers that provide low-density yet durable tread polymers, creating premium margin pools. The resulting design complexity raises switching costs, deepening customer relationships for incumbents with advanced compounding know-how.
Restraints Impact Analysis*
| Restraint | (~) % Impact on CAGR Forecast | Geographic Relevance | Impact Timeline |
|---|---|---|---|
| Crude-linked butadiene price volatility | -0.7% | Global | Short term (≤2 years) |
| Growing TPE substitutes in footwear | -0.3% | Global, concentrated in Asia-Pacific | Medium term (2-4 years) |
| EU CBAM extending to synthetic rubber imports post-2027 | -0.2% | Europe, trade partners | Long term (≥4 years) |
| Recycling quotas in China cutting virgin SBR demand for conveyor belts | -0.1% | China, spillover to Asia-Pacific | Medium term (2-4 years) |
| Source: Mordor Intelligence | |||
Crude-Linked Butadiene Price Volatility
Feedstock costs typically represent up to 70% of total SBR manufacturing expenses, leaving margins exposed when crude prices spike. Currency swings add a further layer of unpredictability for exporters. While natural rubber rallies in 2024 temporarily improved SBR’s relative cost position, dual increases in crude derived butadiene quickly eroded that advantage. Long-term supplier contracts with fixed pricing clauses limit the industry’s ability to pass on sudden feedstock hikes, forcing many firms to adopt hedging and inventory strategies that raise working capital requirements.
Growing TPE Substitutes in Footwear
Footwear brands increasingly specify thermoplastic elastomers to streamline injection-molding processes and support recyclability commitments. TPE materials also simplify color matching and reduce cure times, compressing production cycles. Although SBR retains superior abrasion resistance for demanding athletic soles, casual and fashion segments migrate toward TPE at an accelerating pace. The shift pressures Styrene Butadiene Rubber industry volumes in a historically stable end-use segment, stimulating research into more sustainable SBR grades.
*Our forecasts treat driver/restraint impacts as directional, not additive. The impact forecasts reflect baseline growth, mix effects, and variable interactions.
Segment Analysis
By Type: Solution SBR Drives Premium Applications
Solution SBR recorded the highest 4.27% CAGR through 2031, even though emulsion SBR controlled 70.42% of 2025 volumes. The Styrene Butadiene Rubber market size attributed to solution grades is projected to expand from USD 4.27 billion in 2026 to USD 5.26 billion in 2031, reflecting granular demand for high-performance tire treads. Functionalised solution polymers achieve tighter molecular weight distributions and superior filler compatibility, enabling tread weight reductions without compromising wet grip. ARLANXEO’s recent capacity addition in Dormagen aligns with automaker requirements for low-rolling-resistance tires. As performance specifications tighten, solution SBR gains share, particularly in Europe, China, and premium replacement markets where consumer awareness is highest. Emulsion SBR remains indispensable in mass-market segments thanks to scale advantages, extensive installed reactor base, and wide compounding latitude. Yet its price-driven positioning leaves margins vulnerable to feedstock swings. Blended distribution strategies that pair low-cost emulsion platforms with premium solution offerings thus protect revenue streams across automotive cycles.
The Styrene Butadiene Rubber market share commanded by solution grades is likely to rise by 2.7 percentage points by 2031, supported by ongoing tire label regulation, electric vehicle proliferation, and OEM sustainability targets. Even in cost-sensitive emerging economies, policy-driven requirements for wet-grip and rolling-resistance performance accelerate migration to solution SBR. Producers investing in continuous processes, advanced catalyst systems, and in-line functionalisation can capture premium pricing while lowering variable costs via energy efficiency improvements and digitalised plant control.



By Application: Adhesives Emerge as Growth Driver
Tires contributed 68.72% of 2025 revenue, anchoring overall Styrene Butadiene Rubber market demand. The segment benefits from resilient replacement cycles, with commercial vehicle fleets valuing SBR’s abrasion resistance and cost-effectiveness. However, adhesives represent the most dynamic application, advancing at 4.39% CAGR toward 2031. The Styrene Butadiene Rubber market size for adhesives is set to increase from USD 1.17 billion in 2026 to USD 1.45 billion by 2031 as construction outlays, e-commerce packaging volumes, and do-it-yourself consumer projects rise. SBR-based emulsions deliver strong adhesion on porous substrates like concrete and cardboard, combined with flexibility needed for temperature cycling. Packaging firms also adopt SBR hot-melt formulas that support mono-material recycling streams, helping them meet circular-economy pledges. Concurrently, high-growth Asian residential development fuels demand for tile adhesives, waterproof coatings, and sealants that require elastomer modification for crack bridging and impact resistance.
While footwear compound demand faces TPE substitution, premium athletic shoes still rely on SBR’s wear characteristics in high-abrasion outsole segments. Industrial goods including drive belts, hoses, and vibration isolators provide additional diversification, stabilising producer order books when automotive production fluctuates. These varied applications collectively reinforce the Styrene Butadiene Rubber market’s multi-sector resilience, though strategic focus is shifting toward higher-margin, differentiated formulations rather than pure volume pursuits.
Geography Analysis
Asia-Pacific maintained 45.10% revenue share in 2025 and is projected to grow at 4.17% CAGR through 2031. China anchors regional dominance with extensive captive tire and synthetic rubber capacity, enabling fast scale-up for both emulsion and solution grades. Domestic demand receives a boost from rising car parc, infrastructure stimulus, and national recycling quotas that release capacity for export. India’s market is propelled by a forecast doubling of tire industry revenue to USD 22 billion by 2032, spurring incremental capacities and backward integration investments. Thailand and Malaysia complement upstream supply via natural rubber output, affording compounders integrated sourcing advantages. However, carbon pricing, stricter air-emission norms, and water-pollution controls could trigger cost escalations or relocation of older SBR assets within the bloc.
North America delivers mature yet steady consumption underpinned by replacement tires, polymer-modified asphalt for highway rehabilitation, and adhesive uptake in e-commerce packaging. United States tire makers continue to emphasise performance niches such as light-truck and ultra-high-performance variants that lean heavily on functionalised solution SBR. Mexico’s emergence as a near-shoring hub for motor vehicle assembly adds incremental demand for automotive rubber parts. Canadian mining and oil sands operations keep industrial SBR uses buoyant, particularly in conveyor belts and protective coatings. Overall, regional growth hovers close to the global average but skews toward higher value polymers.
Europe is constrained by a lower vehicle production trajectory but benefits from the EU’s sustainability agenda that favours advanced and lower-carbon SBR. German, French, and Italian tire plants intensify adoption of eco-performance grades, amplifying imports of solution SBR from Korea and Singapore until European capacity expands. Eastern European highway and airport upgrades stimulate polymer-modified asphalt usage, partially offsetting automotive softness. The upcoming CBAM will likely curtail high-carbon imports and encourage local sourcing or renewable-energy upgrades in exporting countries. Scandinavian and Benelux markets lead on recycled SBR applications in flooring and sports surfaces, fostering niches that valorise circular solutions.

Value Chain Analysis
The SBR value chain starts with upstream feedstocks, primarily butadiene (C4 stream) and styrene sourced from steam crackers and refineries, followed by polymerization into emulsion SBR and solution SBR. Finishing steps such as coagulation/stripping (as applicable), drying, baling or pelletizing, and packaging come next. Downstream, the material moves through traders and distributors or via direct producer-to-compounder contracts into tire makers and other rubber goods manufacturers, where compound formulation, mixing, and tire or product manufacturing capture most of the value added.
Operational flexibility depends on feedstock availability and logistics, with cracker maintenance cycles and C4 allocation influencing plant run rates and spot pricing dynamics. On the downstream side, qualification requirements for high-performance tire tread polymers keep technical service, application development, and long-term supply agreements at the center of purchasing decisions, particularly for solution SBR used in low-rolling-resistance and premium tire applications. Regionally integrated trade frameworks also shape flows, with RCEP providing tariff advantages for rubber exports within Asia supply corridors (including China, Japan, and South Korea), reinforcing Asia-Pacific as the primary production and consumption hub.
Competitive Landscape
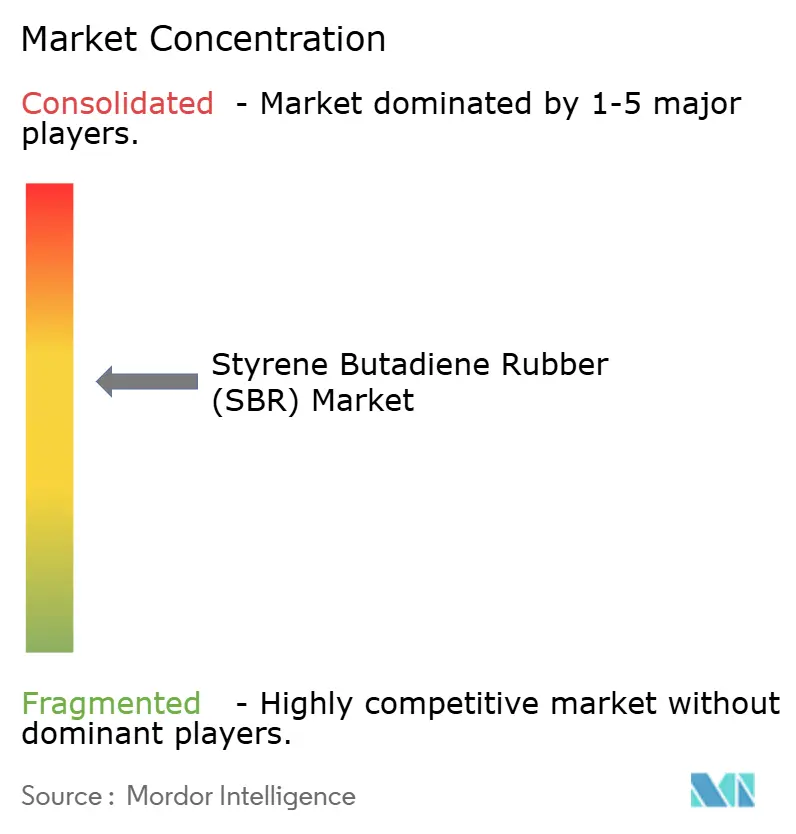
The Styrene Butadiene Rubber market is moderately concentrated, with the top five players accounting for an estimated 56% of global revenue. ARLANXEO, LANXESS, and JSR Corporation retain competitive advantage through process technology, diverse product portfolios, and integration with butadiene feedstock. ARLANXEO’s Dormagen line upgrade lifts annual solution SBR output by 70 kilotonnes, targeting premium EU tire customers. LANXESS leverages backward integration into anionic polymerisation catalysts, lowering variable costs. JSR expands capacity in Yokkaichi to service domestic automakers’ high-specification requests.
Chinese entrants such as Sinopec and TSRC are adding emulsion and solution reactors to supply fast-growing domestic consumption and pursue export share, intensifying price pressure in commodity grades. Western incumbents respond by pruning non-core assets, exemplified by Goodyear’s USD 650 million sale of its Beaumont synthetic rubber business to Gemspring Capital in 2025. Partnerships around circularity are emerging as decisive. Sumitomo Rubber collaborates with Mitsubishi Chemical to recycle recovered carbon black into new tire compounds, reinforcing its cradle-to-cradle narrative. Michelin’s commitments to bio-based feedstocks and next-generation pyrolysis showcase how sustainability driven differentiation trumps pure capacity expansion in the long term.
Styrene Butadiene Rubber (SBR) Industry Leaders
ARLANXEO
China Petrochemical Corporation (Sinopec)
Kumho Petrochemical
Synthos
TSRC
- *Disclaimer: Major Players sorted in no particular order

Market Opportunities and Future Outlook
The clearest opportunity sits in differentiated solution SBR grades for premium and EV-oriented tire treads, where rolling resistance, wet grip, and wear performance are tied to tighter specifications and longer qualification cycles. Capacity additions in Asia also point to where the industry is directing capital and technology: Mysteel reported that China total SSBR capacity reached 675,000 tonnes per year by May 2026 across 10 producers. Separate 2026 initiatives referenced in industry coverage include trial runs and multi-phase builds aimed at green, high-performance tire materials. In this context, functionalization, catalyst and process control, and integrated feedstock access (styrene and secured C4/butadiene) can become differentiators, especially when commodity-grade oversupply compresses margins.
Sustainability-linked product development and circular compounding offer another area to pursue, particularly as tire makers look to incorporate reclaimed rubber without compromising performance. Published 2026 academic work on reclaimed waste tire rubber in SBR compounds (for green tire applications) outlines measurable performance levers that can translate into commercial compounding programs, supporting demand for SBR engineered to work with recycled content. Non-tire outlets also continue to reward suppliers that pair stable supply with application-specific formulations, including construction and packaging adhesives and polymer-modified asphalt, which helps diversify procurement away from purely cyclical OEM tire build rates.
Recent Industry Developments
- June 2026: ARLANXEO and Covestro expanded the use of ISCC PLUS-certified inputs, with ARLANXEO stating that as of January 2026 its chloroprene rubber production is based on ISCC PLUS-certified chlorine sourced from Covestro. The development improves traceability and sustainability credentials across an industrial rubber portfolio, reinforcing procurement preferences that increasingly extend through synthetic elastomer value chains.
- April 2026: Kumho Petrochemical began commercial operation of expanded solution styrene-butadiene rubber (SSBR) facilities, adding 35,000 tonnes per year of capacity (commissioned in the first quarter of 2026). This expansion increases the availability of high-performance SBR for low-rolling-resistance and premium tire compounds, tightening competitive pressure on suppliers focused on commodity emulsion grades.
- February 2025: Sinopec Yanshan Petrochemical received group-level approval for the Nankang Green High-End Rubber New Materials Project in Tianjin, including a 100,000-tonne-per-year solution-polymerized S-SBR unit and a 100,000-tonne-per-year BR unit. The approval creates a named, site-specific pathway for new high-end synthetic rubber capacity in China, supporting domestic sourcing for advanced tire materials and reinforcing Asia-Pacific investment momentum.


Research Methodology Framework and Report Scope
Market Definition and Coverage
This market covers the value of styrene butadiene rubber (SBR) sold as a synthetic elastomer, counted at the material level across major producing and consuming regions. We treat SBR as the end product here, regardless of the downstream part it finally goes into.
Scope exclusions: Finished rubber goods (like tires, footwear, and molded parts) are not counted as market value unless the revenue is for SBR material itself.
Segmentation Overview
- By Type
- Emulsion SBR
- Solution SBR
- By Application
- Tyres
- Adhesives
- Footwear
- Other Applications
- By Geography
- Asia-Pacific
- China
- Japan
- India
- South Korea
- Thailand
- Malaysia
- Vietnam
- Indonesia
- Rest of Asia-Pacific
- North America
- United States
- Canada
- Mexico
- Europe
- Germany
- France
- United Kingdom
- Italy
- Spain
- Nordic
- Turkey
- Russia
- Rest of Europe
- South America
- Brazil
- Argentina
- Colombia
- Rest of South America
- Middle East and Africa
- Saudi Arabia
- United Arab Emirates
- Qatar
- Egypt
- Nigeria
- South Africa
- Rest of Middle East and Africa
- Asia-Pacific
Data Sources, Market Sizing, and Validation
Desk Research
Desk work starts by mapping where SBR demand comes from and how supply moves across regions. We rely on public trade and industry data points, such as national customs statistics, UN Comtrade-style trade tables, and government industry outputs, which helps validate import reliance and export intensity.
To keep the model grounded, we also review sources such as central bank and statistical office inflation and FX series, industry association releases for tire and rubber indicators, and peer-reviewed polymer and rubber journals for process and application context. Company annual reports, investor presentations, and reputable press are used to sanity check capacity changes, plant restarts, and feedstock exposure, and then a paid company financials and intelligence subscription is used selectively to standardize revenue splits and track corporate actions. These sources are not exhaustive, and many other public references were used for cross-checking, validation, and clarifying open questions.
Primary Interviews and Surveys
Primary work is used to pressure test assumptions that do not show up cleanly in public statistics, especially SBR grade mix, typical price movements, and how quickly tire and industrial buyers switch between polymers. We speak with producers, distributors, compounders, and procurement and technical roles across key consuming regions so the demand signals and supply-side constraints can be reconciled into one view.
Distribution of primary research fieldwork respondents
| Company type | Respondent position | Region |
|---|---|---|
| Top tier: 27% | CXOs: 12% | APAC: 39% |
| Mid tier: 55% | Functional/Unit leaders: 43% | EMEA: 37% |
| Smaller Players: 18% | Managers: 45% | Americas: 24% |
Market-Sizing & Forecasting
Sizing is built using a top-down approach where production and trade data help reconstruct regional apparent consumption, which is then linked to end-use pull from tire making and general rubber goods. The totals are corroborated with selective bottom-up approximations, using sampled capacity-to-output checks, supplier and distributor channel conversations, and a simple volume times average selling price logic to adjust any obvious gaps.
Key inputs that shape the model include SBR demand tied to tire output trends, the split between emulsion and solution grades, operating rate shifts at major plants, feedstock-driven price direction (styrene and butadiene sensitivity), and regional import penetration patterns that indicate when local supply is tight. For forecasting, we use scenario analysis supported by short-cycle time series smoothing on prices and demand indicators, and then the final path is chosen after primary feedback aligns on expected tire production growth and timing of capacity additions. When bottom-up checks do not cover smaller countries well, we bridge the gap using proxy indicators like regional tire exports, historical trade shares, and conservative price bands before rolling up to the global total.
Data Validation & Update Cycle
Validation is done through multiple checks so that one noisy data point does not steer the final number. We compare implied consumption against independent signals such as trade balances, reported operating rate commentary, and downstream rubber activity, and any large variance is reviewed and recalculated before sign-off.
If an assumption moves materially, like a sharp feedstock-driven price swing or a major plant outage, we re-contact participants to confirm the direction and magnitude. Reports are refreshed on an annual cycle, and interim updates are done when major events change supply or demand, followed by a final pre-delivery review so clients receive the latest view.
Mordor Intelligence's Styrene Butadiene Rubber Sbr Market Estimate Compared With Other Published Estimates
It is normal to see different SBR market sizes in public because groups do not always measure the same thing, even when the title looks identical. Differences usually come from what gets counted as SBR value, the price basis used in the base year, and how regional trade is treated when converting volumes into revenues.
Some published figures lean toward a broader synthetic rubber bucket, or they blend SBR material value with parts of downstream compounding and conversion economics. In Mordor Intelligence sizing, revenue is counted for SBR material across emulsion and solution grades, and it is kept separate from finished rubber goods pricing so the number stays tied to a repeatable demand pool.
Benchmark comparison
| Source | Market Size | Gaps in Research Methodology |
|---|---|---|
| Mordor Intelligence | USD 14.39 B (2025) | |
| Global Consultancy A | USD 15.49 B (2025) | Uses a higher base-year pricing and broader inclusion of adjacent rubber value chain items in some applications, which lifts the implied revenue per ton versus a material-only view. |
| Industry Publisher B | USD 11.95 B (2025) | Applies a more conservative price and utilization case for 2025, and the regional roll-up appears to under-capture trade-linked consumption in high-import markets. |
The spread across sources is mainly explained by price basis, how trade is converted into revenue, and whether adjacent value chain revenue is blended into the same total. By keeping assumptions visible and linking volume signals to an explicit ASP logic, the resulting estimate can be re-checked and updated in a straightforward way.


Key Questions Answered in the Report
What is the current size of the Styrene Butadiene Rubber market?
The Styrene Butadiene Rubber market size reached USD 14.94 billion in 2026, and it is forecast to hit USD 17.99 billion by 2031.
Which region leads global consumption?
Asia-Pacific dominates with 45.10% revenue share thanks to extensive tire and synthetic rubber manufacturing capacity combined with strong domestic demand growth.
Why is solution SBR gaining share over emulsion grades?
Solution SBR offers superior rolling-resistance and wet-grip performance, meeting tighter tire labeling rules and OEM efficiency targets, which drives its 4.27% CAGR through 2031.
How will the EU CBAM affect SBR trade?
From 2027, carbon levies on synthetic rubber imports will raise costs for carbon-intensive producers, encouraging European buyers to source lower-emission material or domestic supply.
Page last updated on:





