Robotic Sensors Market Size and Share
Market Overview
| Study Period | 2020 - 2031 |
|---|---|
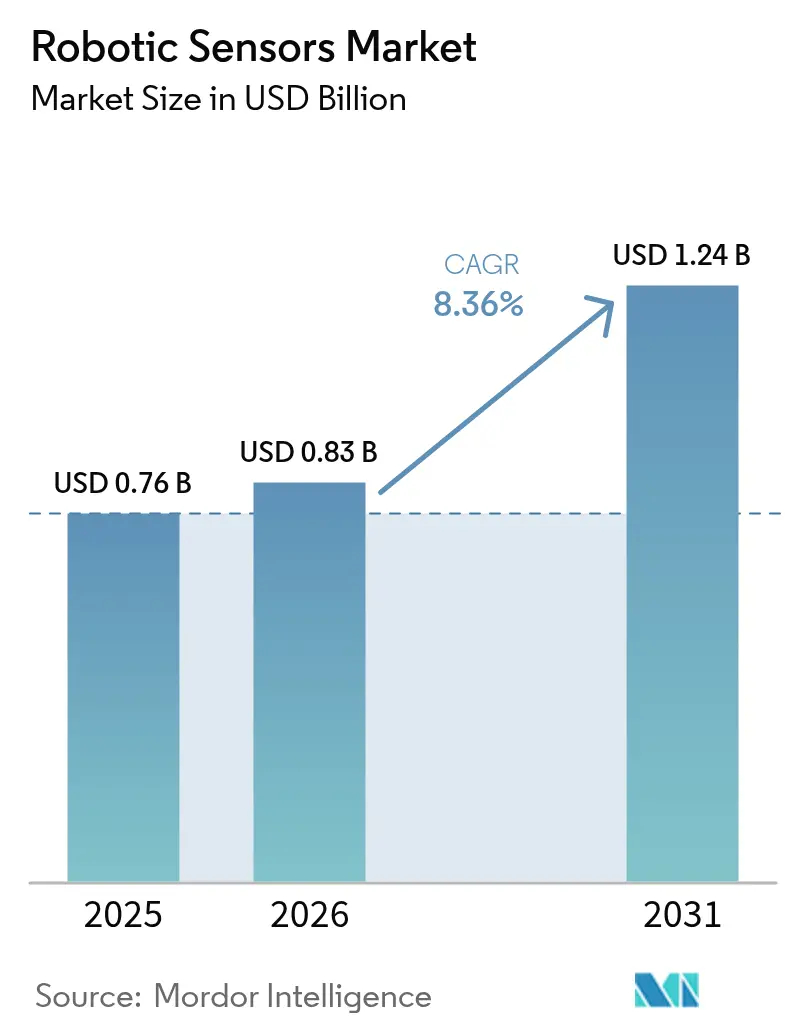
| Market Size (2026) | USD 0.83 Billion |
| Market Size (2031) | USD 1.24 Billion |
| Growth Rate (2026 - 2031) | 8.36% CAGR |
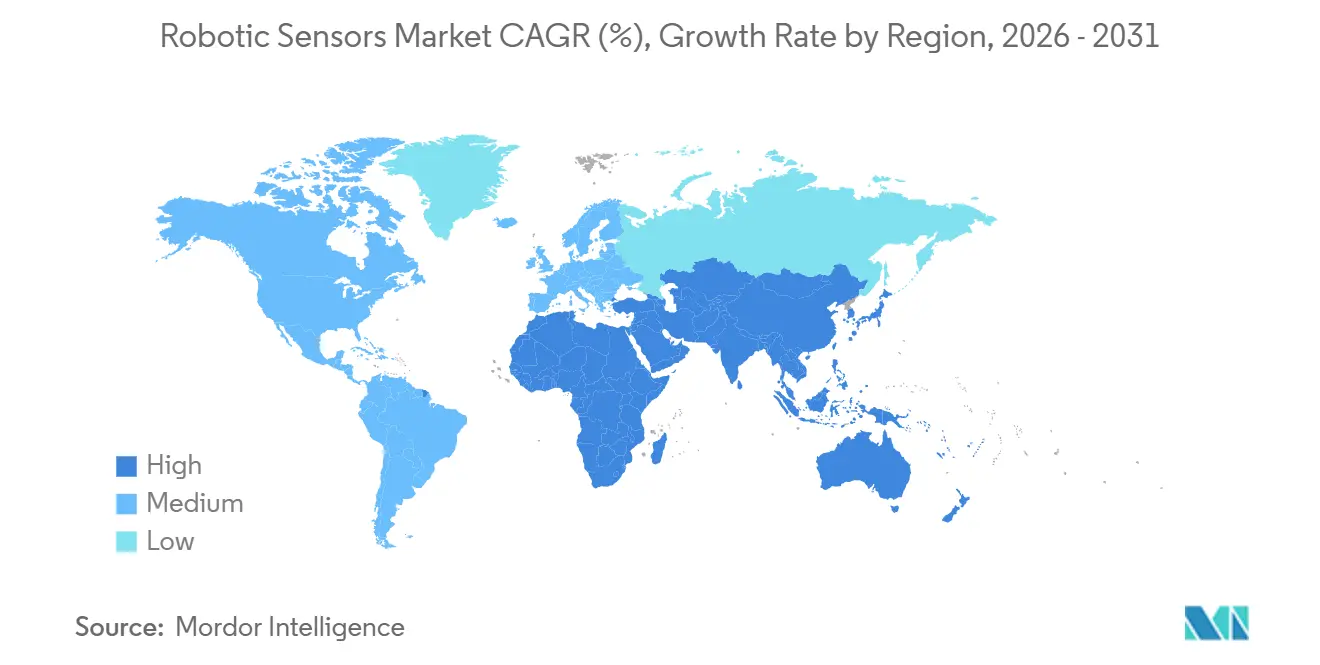
| Fastest Growing Market | Middle East |
| Largest Market | Asia Pacific |
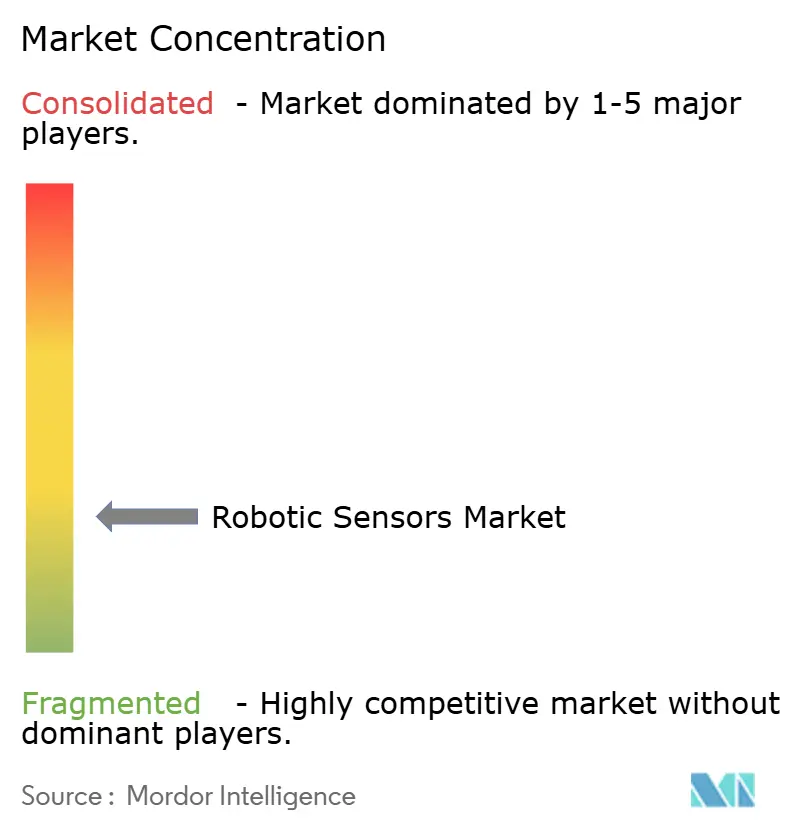
| Market Concentration | Low |
Major Players *Disclaimer: Major Players sorted in no particular order Image © Mordor Intelligence. Reuse requires attribution under CC BY 4.0. | |
Robotic Sensors Market Analysis by Mordor Intelligence
The robotic sensors market size is projected to expand from USD 0.76 billion in 2025 and USD 0.83 billion in 2026 to USD 1.24 billion by 2031, registering a CAGR of 8.36% between 2026 to 2031. Sustained capital spending on smart factories, fulfillment centers, and surgical suites keeps sensor demand firmly tied to production uptime rather than discretionary cost-cutting. Vendors that once sold basic photo-electric switches now bundle multi-modal sensing, on-edge AI, and cyber-secure connectivity because end users view real-time data as the operational core of predictive maintenance and safety certification. Autonomous mobile robots, collaborative arms, and emerging humanoids each drive incremental sensor attach rates, multiplying unit demand even when overall robot shipments grow at a slower pace. At the same time, geopolitical friction around semiconductor supply security is reshaping procurement, with large buyers insisting on second-source MEMS agreements before placing volume orders.
Key Report Takeaways
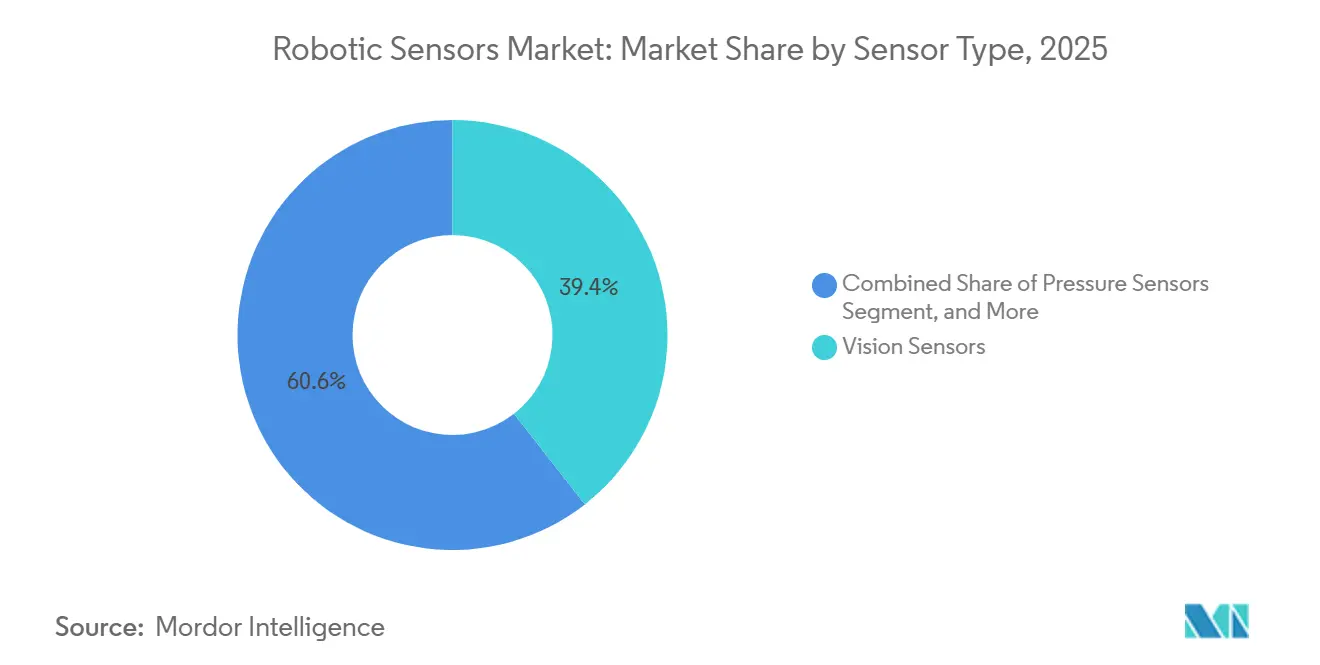
- By sensor type, vision sensors led with 39.44% of the robotic sensors market share in 2025, and the category is forecast to advance at a 9.78% CAGR through 2031.
- By robot type, industrial platforms accounted for 53.47% of the robotic sensors market share in 2025, while the humanoid segment is expanding at a 9.33% CAGR through 2031.
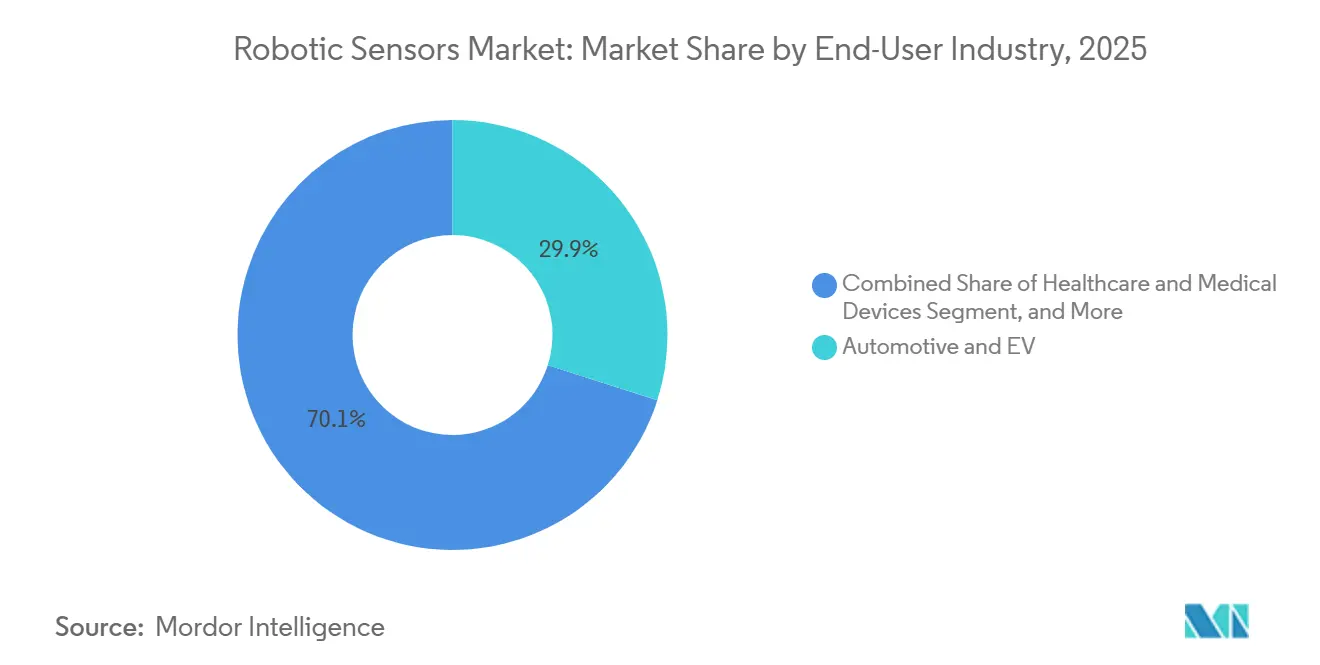
- By end-user, automotive and EV production accounted for 29.91% of 2025 revenue, whereas healthcare and medical devices are projected to grow at the fastest 9.56% CAGR through 2031.
- By sensing technology, optical methods accounted for 42.33% of 2025 revenue and are expected to post a 9.39% CAGR through 2031.
- By geography, Asia-Pacific contributed 47.89% of the 2025 value, and the Middle East is on track for the highest 9.36% CAGR through 2031.
Note: Market size and forecast figures in this report are generated using Mordor Intelligence’s proprietary estimation framework, updated with the latest available data and insights as of 2026.
Global Robotic Sensors Market Trends and Insights
Drivers Impact Analysis*
| Driver | (~) % Impact on CAGR Forecast | Geographic Relevance | Impact Timeline |
|---|---|---|---|
| Industrial-robot installations hit record levels | +2.1% | China, Japan, Germany, United States | Medium term (2-4 years) |
| E-commerce logistics demand for sensorised AMRs | +1.8% | North America, Europe, rapidly in Asia-Pacific cities | Short term (≤ 2 years) |
| Rapid price decline of six-axis force-torque sensors | +1.4% | Global, strongest in cost-sensitive emerging markets | Medium term (2-4 years) |
| Regulatory incentives for human-robot collaboration | +1.2% | Europe, North America, early in Japan and South Korea | Long term (≥ 4 years) |
| Edge-AI sensor fusion modules for humanoids | +1.5% | North America, China, spillover to Asia-Pacific and Middle East | Long term (≥ 4 years) |
| Open-source ROS2 hardware reference designs | +0.9% | Global, especially emerging markets and academic hubs | Medium term (2-4 years) |
| Source: Mordor Intelligence | |||
Industrial-Robot Installations Hit Record Levels
Manufacturers installed 542,000 industrial robots during 2024, lifting the global installed base above 4 million units and creating sustained replacement demand for vision, force-torque, and proximity devices.[1]World Robotics Report, International Federation of Robotics, ifr.org China drove more than half of new deployments as tax credits tied to the Made in China 2025 program offset capital costs, while Germany and Japan funneled public grants into next-generation battery and semiconductor fabs. Automotive OEMs are retrofitting legacy arms with six-axis force-torque sensors to protect prismatic EV battery packs from microscopic weld spatter, and electronics assemblers in South Korea now specify capacitive proximity arrays on every new cobot cell to satisfy union-negotiated safety distances. Economies of scale from this volume cycle have reduced average sensor ASPs by 15% since 2024 and unlocked the robotic sensors market for mid-tier suppliers that previously relied on manual jig stations.
E-Commerce Logistics Demand for Sensorised AMRs
Peak-season order spikes that swing by 300% inside a single week forced fulfillment operators to prioritize flexible fleets over fixed conveyors. DHL’s global network processed more than 500 million robotic picks in 2025 using LiDAR-guided AMRs that refresh environmental maps every 40 milliseconds for human cohabitation safety.[2]DHL Supply Chain, “Collaborative Robots Deployment,” dhl.com Amazon’s Proteus platform uses computer vision sensors for obstacle avoidance, increasing usable floor space by 20% after physical fencing was removed. Every AMR carries six to eight discrete sensors that require replacement every 18-24 months, generating a recurring aftermarket revenue stream for each new fleet node. Smaller 3PLs are also entering the cycle as contract bids increasingly score on picks-per-labor-hour, translating directly into additional shipments of proximity, inertial, and optical modules.
Rapid Price Decline of Six-Axis Force-Torque Sensors
Component integration and ASIC-based signal conditioning cut the bill of materials for six-axis transducers nearly in half between 2024 and 2025. Fourier Intelligence launched a unit at CNY 5,000 (USD 710) by embedding strain gauges into monolithic steel diaphragms that feed micro-power ADCs, opening the door for medium-payload cobots that previously had to sacrifice tactile feedback to hit entry-level price tags.[3]Fourier Intelligence, “Affordable Six-Axis Sensor Launch,” fftai.com FUTEK recorded a 40% jump in miniature transducer orders as packaging-line integrators shifted from three-axis to six-axis feedback to prevent seal tear-off in variable-thickness pouches. Falling sensor costs ripple through end-effector design, encouraging OEMs to pitch multi-tasking versatility rather than single-process automation, a proposition central to the widening acceptance of collaborative workcells in small and mid-sized factories.
Regulatory Incentives for Human-Robot Collaboration
ISO/TS 15066 is now the de facto compliance gate for fence-free robotics. In 2025, Germany required real-time force monitoring within 1.5 meters of employees, effectively mandating redundant force-torque and capacitive layers. South Korea rolled out a USD 200 million subsidy that reimburses SMEs up to 30% of safety-sensor outlays, cutting payback periods to below 2 years. North American plants increasingly bake IEC 61800-5-2 functional-safety clauses into purchase specs, and insurance carriers offer premium discounts for certified collision-avoidance packages. These moves lift sensor content per robot, anchoring demand growth even when macro conditions soften overall capex.
Restraints Impact Analysis*
| Restraint | (~) % Impact on CAGR Forecast | Geographic Relevance | Impact Timeline |
|---|---|---|---|
| Persistent MEMS supply-chain volatility | -0.8% | Global, most acute in East Asia–dependent regions | Short term (≤ 2 years) |
| CapEx barriers for SMEs in emerging markets | -0.6% | South America, Africa, Southeast Europe and Asia | Medium term (2-4 years) |
| Cyber-security certification costs for smart sensors | -0.5% | North America and Europe, spreading to Asia-Pacific | Medium term (2-4 years) |
| Export-control limits on advanced tactile ICs | -0.4% | Global, strictest for China and Russia shipments | Long term (≥ 4 years) |
| Source: Mordor Intelligence | |||
Persistent MEMS Supply-Chain Volatility
MEMS fabs in Taiwan, Japan, and South Korea juggle competing smartphone, automotive, and industrial orders, which swing wafer allocation quarter to quarter. TSMC devoted only 8% of advanced packaging space to MEMS in 2025, lengthening robotic sensor lead times from 12 weeks to 26 weeks and forcing suppliers to pay spot-market premiums that shaved 200-300 basis points off margins. European and North American second-source lines charge 15-20% higher wafer pricing and run lower yields, so design teams must accept either cost hikes or delayed revenue, suppressing the near-term expansion of the robotic sensors market.
Cyber-Security Certification Costs for Smart Sensors
Industrial purchasers now demand IEC 62443 and Common Criteria approvals before integrating network-addressable sensors. Honeywell estimated that cyber-certification added USD 1.2 million in non-recurring engineering and extended time-to-market by up to nine months per product line. U.S. federal directives require EAL 4+ compliance, yet fewer than 20 sensor SKUs meet that bar, creating a queue at accredited test labs, slowing iteration, and deterring smaller entrants whose balance sheets cannot absorb the up-front expense.
*Our forecasts treat driver/restraint impacts as directional, not additive. The impact forecasts reflect baseline growth, mix effects, and variable interactions.
Segment Analysis
By Sensor Type: Vision Sensors Drive Bin-Picking Breakthroughs
Vision devices accounted for 39.44% of 2025 revenue, with the segment forecast to post a 9.78% CAGR through 2031, indicating that the robotic sensors market's expansion hinges on continued innovation in camera and lighting technologies. Cognex shipped more than 1 million units in 2025 as 3D line-scan systems eliminated manual fixturing on EV battery lines. Force-torque arrays remain indispensable for collaborative arms, especially where robotic sensor market share is directly linked to ISO/TS 15066 compliance in automotive and medical factories. Rapid commoditization of proximity sensors, with some models priced under USD 50, opens the door for developing-country packaging plants that previously ran without automation.
Price pressure has also spurred hybrid designs that integrate strain gauges into camera housings, reducing cabling weight and latency. Position encoders continue steady but less spectacular growth, anchored by demand for ultra-precise laser displacement in semiconductor packaging. Pressure and temperature sensors play niche roles in vacuum gripping and thermal drift compensation, yet ensure consistent attachment rates across every cobot wrist sold. The convergence narrative keeps the robotic sensors market well diversified across modalities, limiting vendor exposure to single-technology cycles.


By Robot Type: Humanoid Platforms Reshape Sensor Specifications
Industrial arms accounted for 53.47% of 2025 sensor sales, but humanoids, advancing at a 9.33% CAGR, will reshape hardware roadmaps, as each biped demands dozens of distributed tactile nodes. Tesla’s Optimus prototype used 28 discrete sensors, underscoring the shift in sensor density as robots leave structured cages. Collaborative arms account for another major slice, where dual-redundant force monitoring adds USD 800-1,200 to the sensor bill of materials per unit, anchoring the robotic sensors market share premium relative to traditional six-axis systems.
Professional service robots in logistics and agriculture prioritize LiDAR and ultrasonic stacks, while domestic units chase the lowest possible price point with infrared and single-axis IMUs. Yaskawa reported 22% annual growth in collaborative arm shipments, with force-torque attachment rates above 85%. Bota Systems' modular tactiles that curve around limbs illustrate a new design language emerging for humanoids. Such diversity helps insulate the overall robotic sensors market revenue from downturns in any single robot class.
By End-User Industry: Healthcare Robotics Accelerate Sensor Adoption
Automotive and EV assembly accounted for 29.91% of 2025 demand, yet hospitals and device makers will drive healthcare to a 9.56% CAGR on the back of surgical-robot rollouts. Intuitive Surgical surpassed 8,500 da Vinci installations worldwide by late 2025, each requiring periodic force recalibration, which drives aftermarket sensor sales. Semiconductor fabs use vision sensors capable of detecting defects at 10 ppm or less; any yield slip jeopardizes million-dollar wafers, driving conservative over-specification.
Logistics captured roughly 16% of the 2025 volume, with every new e-commerce distribution center embedding tens of thousands of LiDAR, IMU, and proximity parts. Food processors lag on aggregate but show accelerating orders for IP67-rated force-limiting cobots that survive high-pressure washdowns. Niche verticals such as construction, mining, and agriculture collectively remain under 12% but represent upside once ruggedized, temperature-tolerant designs mature.
By Sensing Technology: Optical Methods Dominate Navigation and Inspection
Optical sensing accounted for 42.33% of 2025 revenue and is projected to grow at 9.39%, sustaining its leadership in the broader robotic sensors market. Sick AG’s TiM LiDAR shipped more than 2 million units in 2025 for warehouse navigation. Strain-gauge architecture stays the gold standard for force-torque, delivering sub-0.1% linearity critical to aerospace fastener accuracy. Capacitive technology is scaling rapidly as employers embrace fence-free cobots in unionized plants that codify pre-contact speed reduction.
Magnetic encoders and Hall-effect current sensors now feature lower sleep-mode power consumption, supporting battery-powered field robots and service drones. Piezoelectric elements remain a niche diagnostic tool for bearing and gearbox health. The advance of optical-IMU fusion, accelerated on NVIDIA Jetson Thor hardware, produces centimeter-scale indoor localization without GNSS, a capability pivotal to the spread of humanoids and last-mile delivery bots. Each advance broadens the applications of robotic sensors beyond traditional factory walls
Geography Analysis
Asia-Pacific retained 47.89% of global revenue in 2025 and is projected to grow at an 8.1% CAGR through 2031, keeping the region firmly at the center of the expansion of the robotic sensors market. China installed 290,000 new industrial arms in 2024 under Made in China 2025 subsidies, an investment wave that anchors bulk demand for optical and force-torque units. Japanese suppliers such as OMRON and Keyence raised fiscal-2025 robotic-sensor sales by 14% thanks to encoder miniaturization programs that command premium pricing in export markets. South Korean cobot makers are now integrating locally produced tactile arrays to curb European sourcing risks and undercut price points in Southeast Asia. Rising labor costs in Indian auto hubs are also boosting orders for vision sensors as Tier-1 parts plants automate final inspection lines.
North America delivered roughly 28% of 2025 revenue, buoyed by warehouse automation and a record 12 FDA surgical-robot approvals that require force feedback and ISO safety compliance. U.S. chip-packaging fabs specify sub-micron displacement sensors to guard die yields and qualify for federal reshoring credits. Canada’s prairie farms adopted LiDAR-guided harvesters to offset chronic labor shortages, supporting shipments of low-cost capacitive and inertial units. Europe approximated 20% of the 2025 value but skews toward retrofit activity; German automotive lines prefer swapping single-pixel photodiodes for 3D depth cameras rather than buying new arms, a shift that lifts robotic sensors market share for aftermarket vendors. The retrofit trend keeps European growth moderate yet predictable, even when macro headwinds delay greenfield capacity.
The Middle East is forecast to have the fastest CAGR of 9.36%, as Saudi Arabia’s Public Investment Fund commits USD 500 million to local robot and sensor manufacturing in Riyadh. United Arab Emirates logistics operators likewise integrate LiDAR-equipped delivery robots across smart-city districts to meet 15-minute fulfillment targets. South America and Africa together accounted for less than 5% of 2025 demand, as currency volatility and capex hurdles deter widespread factory automation. Brazil’s automotive output fell 9% in 2024, trimming vision-sensor imports, while South African mines continue limited pilots of autonomous haulage trucks fitted with ruggedized LiDAR, leaving a large white-space opportunity once commodity cycles turn.

Competitive Landscape
The robotic sensors market remains moderately fragmented, with the top 10 suppliers capturing about 50% revenue and the largest single player holding a near-12% share, a structure that assigns no company unassailable control. Long-established automation majors OMRON, Keyence, and Sick AG leverage decades-old OEM relationships and extensive service networks, yet their gross margins are under pressure as buyers test lower-cost Chinese and Eastern European alternatives. Cognex held roughly 35% of industrial vision shipments in 2025 by embedding deep-learning libraries that slash defect-training time, reinforcing its premium positioning even while lower-tier rivals crowd the commodity end of the camera stack. Force-torque specialists ATI, FUTEK, and Bota Systems bundle calibration scripts for ROS2, trimming start-up time from weeks to days and winning share inside collaborative-robot wrists.
Patent intensity is rising as suppliers protect edge-processing and multi-modal fusion know-how; the USPTO granted 340 tactile-sensing patents in 2025, a 22% year-over-year increase that locks in proprietary firmware advantages. Honeywell targeted radiation-hardened pressure sensors for nuclear-decommissioning robots, staking out a niche where reliability and regulatory compliance outweigh unit cost. Keyence opened a USD 120 million Osaka R and D center in September 2025, aimed at shrinking vision modules for humanoid joints to one-third current volumes, signaling an innovation race around miniaturization. Sensata’s USD 340 million purchase of a Swiss MEMS fab in July 2025 secured captive inertial supply, demonstrating that vertical integration is a viable hedge against wafer volatility as the robotic sensors market enters an expansion phase.
Open-source hardware is the wild card that keeps competitive intensity elevated. ROS2 reference boards enable university spin-outs in India and Poland to launch proximity modules that meet baseline IEC safety yet undercut incumbents by 20%, fragmenting volume at the low end. In response, incumbents fast-track platform refreshes on two-year cycles rather than the historical four, shortening payback periods for R&D budgets but demanding sharper pricing discipline. Strategic partnerships amplify this scramble; FANUC and NVIDIA now co-develop edge AI cobots, while Infineon and Bosch Rexroth jointly certify SIL 3 sensor suites, moves that both defend high-value niches and set new compliance baselines for the wider robotic sensors market share contest.
Robotic Sensors Industry Leaders
Bota Systems AG
FANUC Corporation
Honeywell International Inc.
Infineon Technologies AG
TE Connectivity Ltd.
- *Disclaimer: Major Players sorted in no particular order

Recent Industry Developments
- February 2026: FANUC announced a partnership with NVIDIA to embed Jetson Thor AI modules in next-gen cobots, promising 40% downtime reduction via real-time sensor fusion.
- January 2026: TE Connectivity completed a USD 180 million expansion of its Suzhou plant, adding capacity for 15 million force-torque and pressure sensors annually.
- December 2025: Cognex invested USD 25 million in a German hyperspectral vision startup to accelerate material-composition inspection solutions.
- November 2025: Sick AG introduced the TiM-X 360-degree LiDAR, IP67 rated for agriculture and construction sites.


Global Robotic Sensors Market Report Scope
The Robotic Sensors Market Report is Segmented by Sensor Type (Force and Torque Sensors, Vision Sensors, Proximity Sensors, Position/Encoders, Temperature Sensors, Pressure Sensors, Other Sensor Types), Robot Type (Industrial Robots, Collaborative Robots, Professional Service Robots, Domestic Service Robots, Humanoid Robots), End-user Industry (Automotive and EV, Electronics and Semiconductor, Logistics and Warehousing, Food and Beverage, Healthcare and Medical Devices, Other End-user Industries), Sensing Technology (Strain-gauge, Capacitive, Optical, Magnetic and Hall-effect, Piezoelectric), and Geography (North America, South America, Europe, Asia-Pacific, Middle East and Africa). The Market Forecasts are Provided in Terms of Value (USD).
| Force and Torque Sensors |
| Vision Sensors |
| Proximity Sensors |
| Position/Encoders |
| Temperature Sensors |
| Pressure Sensors |
| Other Sensor Types |
| Industrial Robots |
| Collaborative Robots |
| Professional Service Robots |
| Domestic Service Robots |
| Humanoid Robots |
| Automotive and EV |
| Electronics and Semiconductor |
| Logistics and Warehousing |
| Food and Beverage |
| Healthcare and Medical Devices |
| Other End-user Industries |
| Strain-gauge |
| Capacitive |
| Optical |
| Magnetic and Hall-effect |
| Piezoelectric |
| North America | United States | |
| Canada | ||
| Mexico | ||
| South America | Brazil | |
| Argentina | ||
| Rest of South America | ||
| Europe | United Kingdom | |
| Germany | ||
| France | ||
| Italy | ||
| Rest of Europe | ||
| Asia Pacific | China | |
| Japan | ||
| India | ||
| South Korea | ||
| Rest of Asia Pacific | ||
| Middle East and Africa | Middle East | United Arab Emirates |
| Saudi Arabia | ||
| Rest of Middle East | ||
| Africa | South Africa | |
| Egypt | ||
| Rest of Africa | ||
| By Sensor Type | Force and Torque Sensors | ||
| Vision Sensors | |||
| Proximity Sensors | |||
| Position/Encoders | |||
| Temperature Sensors | |||
| Pressure Sensors | |||
| Other Sensor Types | |||
| By Robot Type | Industrial Robots | ||
| Collaborative Robots | |||
| Professional Service Robots | |||
| Domestic Service Robots | |||
| Humanoid Robots | |||
| By End-user Industry | Automotive and EV | ||
| Electronics and Semiconductor | |||
| Logistics and Warehousing | |||
| Food and Beverage | |||
| Healthcare and Medical Devices | |||
| Other End-user Industries | |||
| By Sensing Technology | Strain-gauge | ||
| Capacitive | |||
| Optical | |||
| Magnetic and Hall-effect | |||
| Piezoelectric | |||
| By Geography | North America | United States | |
| Canada | |||
| Mexico | |||
| South America | Brazil | ||
| Argentina | |||
| Rest of South America | |||
| Europe | United Kingdom | ||
| Germany | |||
| France | |||
| Italy | |||
| Rest of Europe | |||
| Asia Pacific | China | ||
| Japan | |||
| India | |||
| South Korea | |||
| Rest of Asia Pacific | |||
| Middle East and Africa | Middle East | United Arab Emirates | |
| Saudi Arabia | |||
| Rest of Middle East | |||
| Africa | South Africa | ||
| Egypt | |||
| Rest of Africa | |||


Key Questions Answered in the Report
How fast is revenue expanding for robotic sensors through 2031?
Global value is projected to rise from USD 0.83 billion in 2026 to USD 1.24 billion by 2031 at an 8.36% CAGR.
Which sensor modality shows the highest growth potential?
Vision sensors lead with a 9.78% CAGR as 3D imaging and hyperspectral cameras eliminate manual bin-picking and inspection setups.
What vertical will add the most new demand by 2031?
Healthcare and medical devices are set to outpace all other sectors with a 9.56% CAGR driven by surgical-robot adoption.
Why are MEMS shortages a concern for robot builders?
Foundry capacity swings push lead times out to 26 weeks and force buyers to pay 15-20% premiums for second-source wafers, delaying new product launches.
How is regulation shaping sensor specifications in collaborative robots?
ISO/TS 15066 and regional safety rules mandate redundant force-torque and proximity sensing, making advanced safety sensors a non-negotiable purchase criterion.
Which region will grow fastest after Asia-Pacific?
The Middle East, supported by Saudi Arabia’s NEOM and robotics manufacturing investments, is forecast for a 9.36% CAGR through 2031.
Page last updated on:


