
Market Overview
| Study Period | 2021 - 2031 |
|---|---|
| Forecast Data Period | 2026 - 2031 |
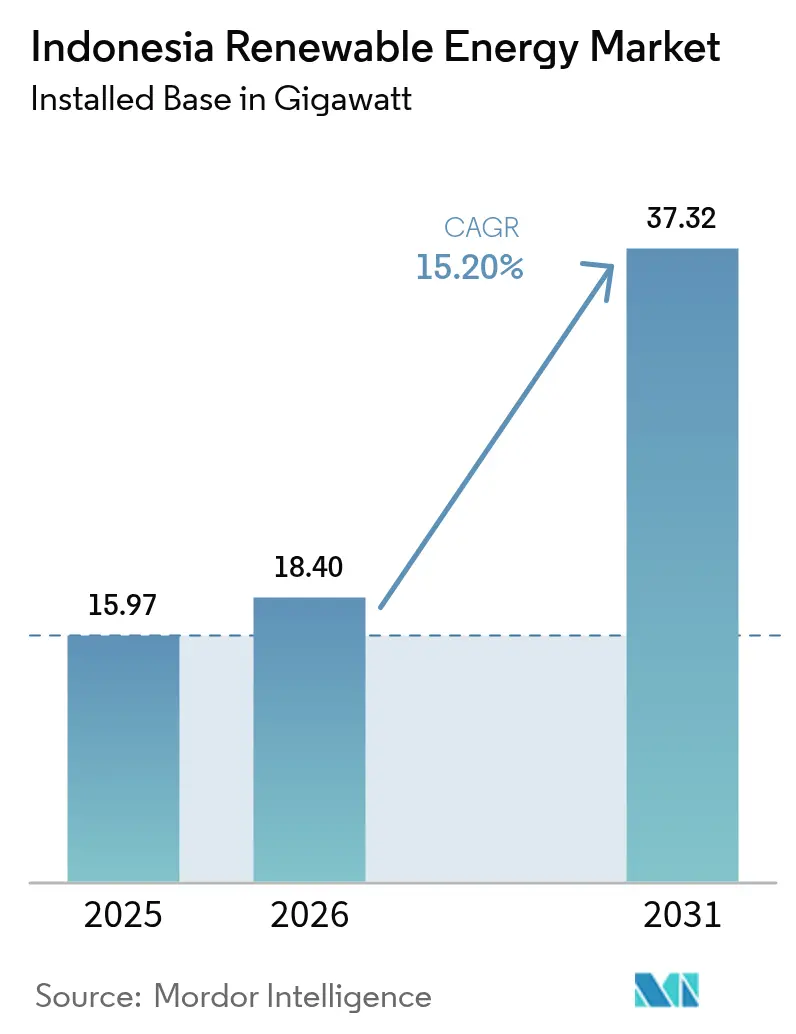
| Base Year Market Size (2025) | 15.97 gigawatt |
| Market Volume (2026) | 18.4 gigawatt |
| Market Volume (2031) | 37.32 gigawatt |
| Growth Rate (2026 - 2031) | 15.20 % |
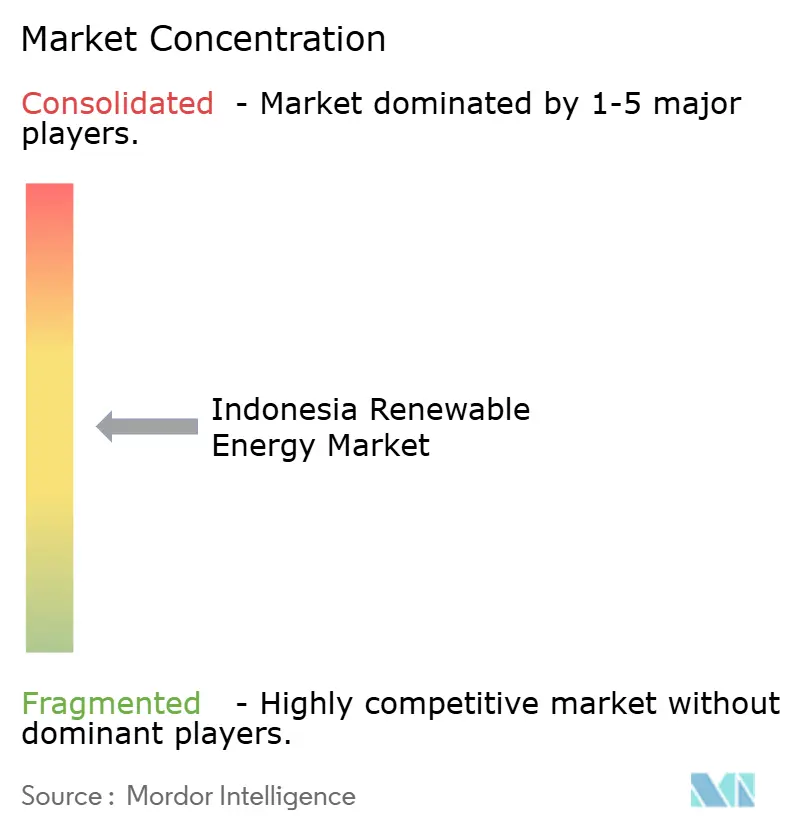
| Market Concentration | Medium |
Major Players *Disclaimer: Major Players sorted in no particular order Image © Mordor Intelligence. Reuse requires attribution under CC BY 4.0. | |
Indonesia Renewable Energy Market Analysis by Mordor Intelligence
Indonesia Renewable Energy market size in 2026 is estimated at 18.4 gigawatt, growing from 2025 value of 15.97 gigawatt with 2031 projections showing 37.32 gigawatt, growing at 15.20% CAGR over 2026-2031.
Strong policy tailwinds, falling technology costs, and rising corporate demand drive this momentum while the government balances climate goals with economic growth. President Prabowo Subianto’s January 2025 inauguration of 37 electricity projects worth IDR 72 trillion (USD 4.4 billion) underscored state backing for grid upgrades and new capacity.[1]PT PLN (Persero), “President Inaugurates 37 Electricity Projects,” pln.co.id Hydropower still leads the generation mix, yet solar PV registers the fastest growth as project economics improve, and independent power producers diversify beyond legacy assets. Climate-finance inflows, including the USD 20 billion Just Energy Transition Partnership, are easing capital constraints, though coal over-capacity and PLN’s single-buyer model continue to slow private investment.
Key Report Takeaways
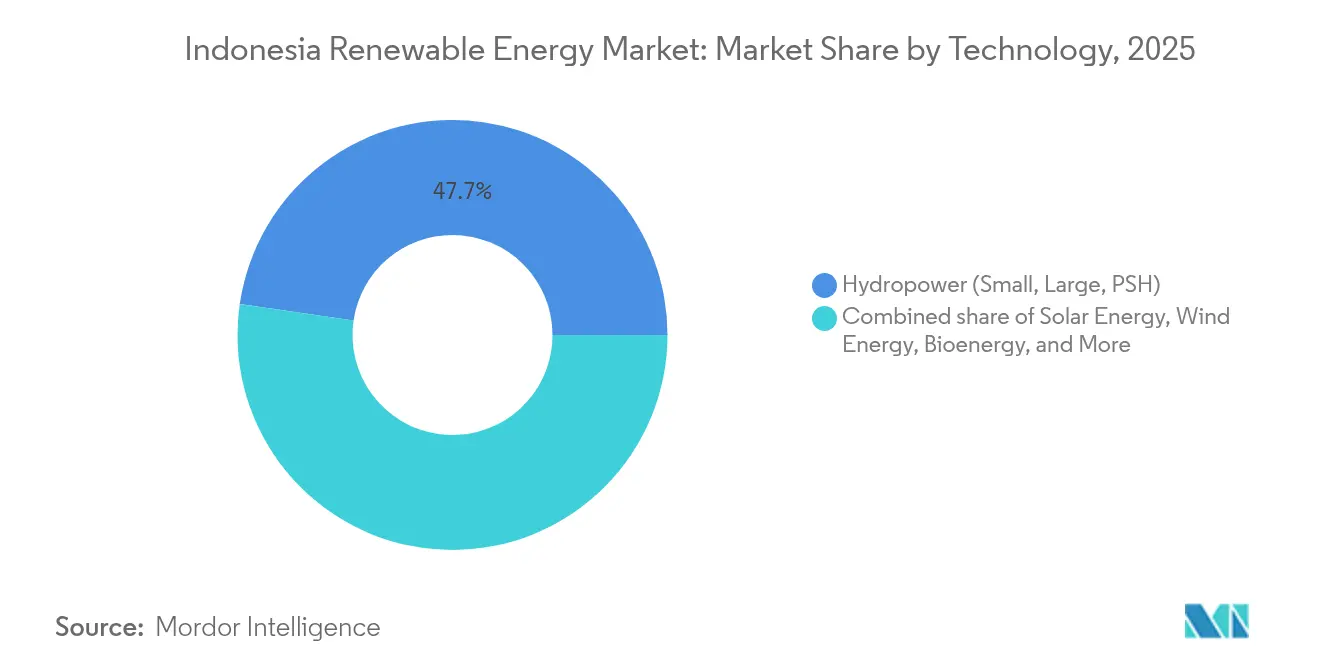
- By technology, hydropower captured 47.70% of Indonesia's Renewable Energy market share in 2025; wind is projected to expand at a 55.95% CAGR between 2026 and 2031.
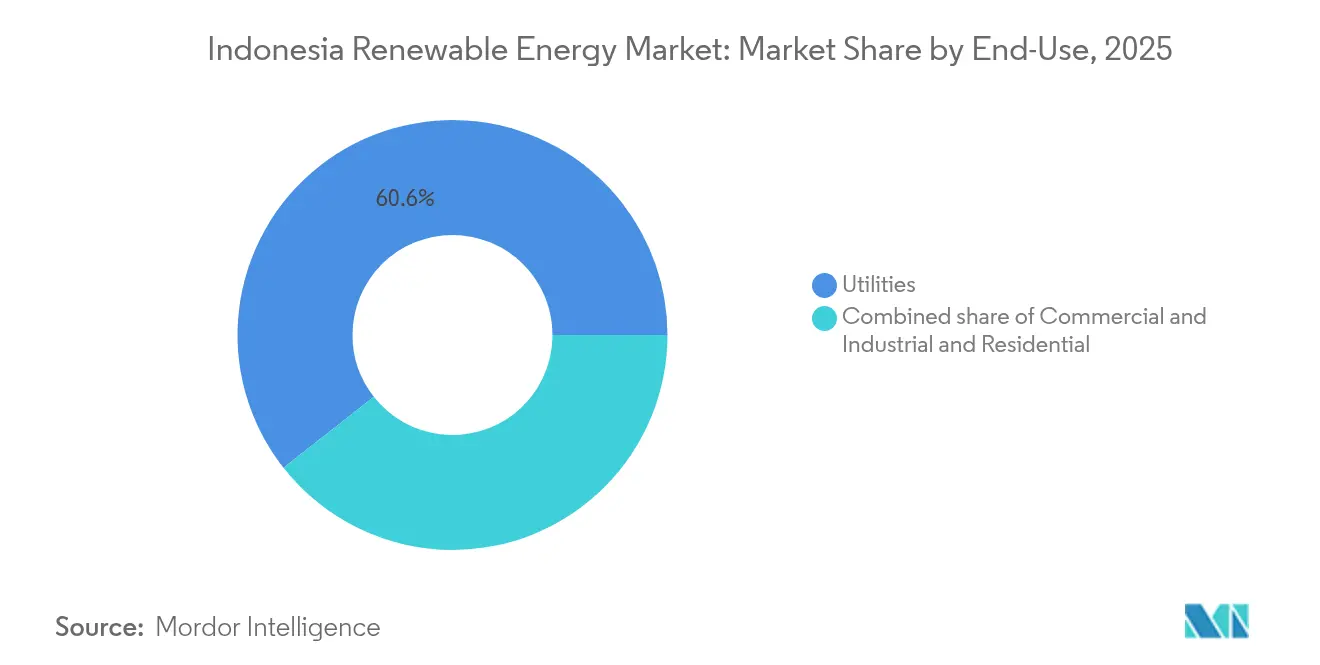
- By end-user, utilities accounted for a 60.60% share of the Indonesian Renewable Energy market size in 2025, while the commercial-and-industrial segment is advancing at a 21.1% CAGR through 2031.
Note: Market size and forecast figures in this report are generated using Mordor Intelligence’s proprietary estimation framework, updated with the latest available data and insights as of 2026.
Indonesia Renewable Energy Market Trends and Insights
Drivers Impact Analysis*
| Driver | (~) % Impact on CAGR Forecast | Geographic Relevance | Impact Timeline |
|---|---|---|---|
| Falling solar and wind LCOE | +3.20% | National, early gains in Java-Bali and South Sulawesi | Short term (≤ 2 years) |
| RUPTL 2025-34 pipeline of 53 GW new renewable energy | +4.80% | National, concentrated in Sumatra, Kalimantan, Sulawesi | Medium term (2-4 years) |
| JETP and multilateral climate-finance inflows | +2.90% | National, prioritizing coal-transition provinces | Medium term (2-4 years) |
| Mandatory B40/B50 biofuel blending push | +1.10% | National, strongest in palm-oil regions | Short term (≤ 2 years) |
| Data-center and corporate PPA boom | +2.60% | Java-Bali corridor, Batam, Surabaya | Short term (≤ 2 years) |
| Off-grid microgrids for last-mile electrification | +0.90% | Eastern Indonesia | Long term (≥ 4 years) |
| Source: Mordor Intelligence | |||


Falling solar & wind LCOE
Global average solar costs fell to USD 0.044/kWh in 2024 and onshore wind to USD 0.033/kWh, undercutting coal’s USD 0.065/kWh benchmark.[2]International Renewable Energy Agency, “Renewable Power Generation Costs in 2024,” irena.org Indonesia’s August 2024 relaxation of local-content rules lets developers import cheaper modules while keeping assembly onshore, accelerating project pipelines. These economics sharpen PLN’s focus on curbing generation costs, especially as avoided fuel outlays and carbon-pricing risks tilt new-build economics toward renewables. The result is a steady pivot in the Indonesian renewable energy market toward solar and wind for green-field capacity additions. Ongoing financing reforms further magnify this cost parity by narrowing the premium that developers once faced.
RUPTL 2025-34 Pipeline of 53 GW New Renewable Capacity
Indonesia’s power-supply plan calls for 69.5 GW of new capacity by 2034, 76% of which is renewable or storage, requiring IDR 2,967 trillion (USD 182.5 billion) in investment.[3]Argus Media Correspondent, “Indonesia RUPTL 2025-34 Targets 53 GW of Renewables,” argusmedia.com Private partnerships are expected to fund 73% of this pipeline, shifting the Indonesian renewable energy market toward deeper technology diversification. The roadmap earmarks 17.1 GW solar, 7.2 GW wind, and 5.2 GW geothermal, moving beyond hydropower’s historic dominance and enabling a more flexible grid. Two planned 250 MW nuclear units underscore a longer-term quest for baseload low-carbon supply, while the 41% renewable target for 2040 offers clearer visibility for investors.
JETP & Multilateral Climate-Finance Inflows
The USD 20 billion Just Energy Transition Partnership couples concessional debt with policy support to accelerate coal retirement and renewable rollout. Norway’s USD 25 million and the United Kingdom’s USD 5 million investments in solar developer Xurya marked the first equity disbursements in 2024, validating investor confidence. France and the EU reinforced momentum by launching the EUR 14.7 million Indonesia Energy Transition Facility in February 2025. These inflows unlock lower-cost capital, cut project risk premiums, and widen participation in the Indonesian renewable energy market, particularly in provinces grappling with coal-plant phase-outs.
Mandatory B40/B50 Biofuel Blending Push
Indonesia rolled out a B40 biodiesel mandate in January 2025, allocating 15.6 million kiloliters for the year and targeting IDR 147.5 trillion (USD 9.1 billion) import savings. The policy reduces transport-sector emissions by 41.46 million tons of CO₂ and stimulates palm-oil demand, which requires renewable electricity for processing facilities. The scheduled B50 shift by 2026 will deepen this linkage, embedding fresh offtake opportunities in the Indonesian renewable energy market for biomass, biogas, and supporting solar or wind assets powering supply chains.
Restraints Impact Analysis*
| Restraint | (~) % Impact on CAGR Forecast | Geographic Relevance | Impact Timeline |
|---|---|---|---|
| Coal overcapacity and must-run PPAs | -2.80% | National, Java-Bali grid most acute | Medium term (2-4 years) |
| High cost of capital versus ASEAN peers | -1.90% | National, foreign-financed projects | Short term (≤ 2 years) |
| PLN single-buyer monopoly limits competition | -1.40% | National, independent developers | Medium term (2-4 years) |
| Land-acquisition conflicts in wind and hydro sites | -1.20% | Sulawesi, Sumatra, Papua | Long term (≥ 4 years) |
| Source: Mordor Intelligence | |||
Coal Over-Capacity & Must-Run PPAs
Legacy coal PPAs obligate PLN to pay capacity charges even when plants are idle, costing the utility more than USD 8 billion annually.[4]IEEFA Analysts, “Coal Over-Capacity and Must-Run Clauses,” ieefa.org These must-run clauses crowd out procurement of cheaper renewables, limiting short-term additions despite favorable economics. Coal’s structural lock-in is set to ease only as early-retirement schemes under the Energy Transition Mechanism secure funding and renegotiate contracts, but the timetable remains uncertain and continues to temper growth in the Indonesian renewable energy market.
High Cost of Capital versus ASEAN Peers
Developers cite higher risk premiums linked to currency volatility and regulatory uncertainty, pushing up the weighted-average cost of capital compared with regional peers. Regulation 5/2025 provides sovereign guarantees on PLN payment defaults, yet deeper capital-market reforms are still needed. Green bonds and blended-finance vehicles are slowly closing the gap, but near-term project economics remain sensitive to interest-rate swings, dampening some investment decisions in the Indonesian renewable energy industry.
*Our forecasts treat driver/restraint impacts as directional, not additive. The impact forecasts reflect baseline growth, mix effects, and variable interactions.
Segment Analysis
By Technology: Wind Surges as Hydropower Plateaus
Hydropower held 47.70% of Indonesia's Renewable Energy market share in 2025, owing to legacy dams commissioned before 2020. Conversely, wind capacity is forecast to post a 55.95% CAGR from 2026 to 2031, fueled by offshore zones in Sulawesi and robust onshore sites in South Sulawesi. The Indonesian Renewable Energy market size for hydropower will grow slowly as future additions skew to small run-of-river projects that skirt resettlement controversies. Solar installations are accelerating in Java, Bali, and on floating reservoirs, benefiting from 4-hour battery add-ons that qualify for capacity payments.
Wind's rapid rise rests on higher capacity factors and joint-venture finance from ACWA Power and Masdar, although subsea-cable links and marine-use zoning remain underdeveloped. Geothermal projects add a steady 200-300 MW annually, constrained by drilling risk and high upfront cost, yet provide dispatchable baseload that anchors PLN's system planning. Bioenergy growth follows B40 and B50 blending mandates that stabilize biomass feedstock demand in palm-oil provinces. Ocean energy stays at pilot scale pending tariff clarity. The evolving mix will pivot the Indonesian Renewable Energy market toward variable renewables plus storage by the late decade.


By End-User: Corporate Buyers Outpace Utility Procurement
Utilities secured 60.60% of new renewable capacity in 2025, reflecting PLN’s single-buyer weight. The commercial-and-industrial segment, however, is set to expand at 21.1% CAGR through 2031 as exporters and data-center operators lock in direct PPAs. The Indonesian Renewable Energy market size attributable to utilities will grow, yet their share will shrink as captive plants proliferate in industrial estates. Corporate buyers favor 15-year fixed tariffs that hedge electricity cost volatility, cutting lender risk premiums by up to 150 basis points.
The C&I boom fragments the Indonesian Renewable Energy market because small developers can reach creditworthy offtakers without PLN’s queue. Rooftop solar growth is brisk in Bekasi, Karawang, and Surabaya, aided by Regulation 26/2021 that permits wheeling arrangements above 5 MW. Residential uptake remains modest due to limited financing and eight-year payback times, even with net-metering pilots in Bali and Jakarta. Broader home adoption awaits cheaper modules and consumer credit lines. Until then, C&I installations will anchor demand outside PLN procurements.
Geography Analysis
Java-Bali holds the largest installed base because it accounts for most national load and hosts robust transmission assets. Corporate rooftop programs, data-center clusters, and stringent sustainability mandates spur the fastest incremental growth. Sumatra’s legacy of geothermal reservoirs and palm-oil mills underpins steady capacity additions, assisted by a USD 500 million Asian Infrastructure Investment Bank scheme to reinforce its distribution backbone.
Kalimantan is a greenfield showcase where the 50 MW PLTS IKN supplies the nascent capital city, setting benchmarks for green-building standards and zero-emission transport corridors. The province targets a 12.39% renewable share by 2025 and 28.72% by 2050, signaling intent despite simultaneous coal extraction. Eastern island groups, notably Maluku and Papua, rely on microgrids and mini-hydro, aligning with donor-funded rural electrification programs. These regional advances bolster inclusivity within the Indonesian renewable energy market and diversify resource risks away from any single island grid.
Regulatory Landscape
Indonesia's renewable energy market operates under a central planning and procurement framework led by the Ministry of Energy and Mineral Resources (MEMR/ESDM) and the state utility PT PLN (Persero). A key recent change is MEMR Regulation No. 5 of 2025 (4 March 2025), which updates guidelines for power purchase agreements (PPAs) from renewable energy plants, reshaping the contracting baseline for new and amended renewable PPAs and reinforcing bankability requirements around PLN as the offtaker.
System planning and transition policy are anchored by RUKN 2025 (National Electricity General Plan) established via Kepmen ESDM No. 85.K/TL.01/MEM.L/2025, alongside the MEMR Strategic Plan (Renstra KESDM) 2025-2029, which prioritizes a higher renewable mix while maintaining domestic component level (TKDN) objectives. Government Regulation No. 40 of 2025 sets the National Energy Policy direction toward net-zero emissions by 2060 and formalizes energy mix targets, while MEMR Regulation No. 19 of 2025 (19 December 2025) adds a specific compliance framework for hybrid power plants in small-scale grids, including configurations that pair renewables with battery storage and other sources, relevant for islanded and isolated systems.
Competitive Landscape
The market remains moderately consolidated. PLN wields statutory single-buyer clout, yet private firms widen their presence through niche technologies and cross-border plays. Star Energy Geothermal, for example, budgets USD 346 million for 102.6 MW of upgrades and taps SLB for subsurface analytics, aiming to cut drilling risk. Pertamina New & Renewable Energy’s USD 115 million acquisition of a 20% stake in Citicore Renewable Energy Corporation in the Philippines shows state-linked players crossing borders to expand scale and learning curves.
Strategic differentiation is shifting from pure kilowatt-hour bids to vertically integrated solutions such as hybrid projects, hydrogen pilots, and energy-storage add-ons. PLN’s rollout of 21 green-hydrogen plants totaling 199 tons annual output underscores first-mover ambition and hedges against future ammonia and steel decarbonization needs. Start-ups concentrate on rooftop engineering, demand-response software, and renewable-certificate trading, seeding new profit pools in the Indonesian renewable energy market. Consolidation is expected as small developers seek capital depth and regulatory certainty, suggesting a gradual tilt toward fewer, better-capitalized entities.
Indonesia Renewable Energy Industry Leaders
PLN Renewables
Pertamina Geothermal Energy
Star Energy Geothermal
Medco Power Indonesia
Canadian Solar
- *Disclaimer: Major Players sorted in no particular order

Market Opportunities and Future Outlook
The 2025-2034 RUPTL, enacted through Kepmen ESDM No. 188.K/TL.03/MEM.L/2025 (May 2025), provides a concrete pipeline where 69.5 GW of generation additions are planned by 2034 and 76% of additions are designated for renewables and storage, supporting multi-technology development beyond legacy hydropower. In the plan's early-period buildout (2025-2029), 12.2 GW of renewable additions and 3 GW of storage are earmarked, which expands opportunities for solar-plus-storage, hybridized supply for smaller grids, and dispatchable geothermal as PLN and developers work within the updated PPA framework (MEMR 5/2025) and hybrid-plant rules (MEMR 19/2025).
Utility-scale solar is taking clearer shape through the government's large solar development program targeting 100.7 GWp coupled with 145.8 GWh of BESS, with the Ministry of Energy and Mineral Resources and PT PLN mapping around 24,000 hectares in Java for an initial 17 GW phase. This combination of land identification, grid-linked solar scale, and the storage requirement shifts opportunity toward EPC, module supply, BESS integration, and grid-connection services, while Government Regulation No. 40 of 2025 sets national NRE mix targets (19%-23% by 2030 and 36%-40% by 2040) that underpin ongoing procurement and system integration. Separately, PLN's stated renewable realization progress as of May 2026 offers a datapoint that programs are moving into execution, highlighting demand for transmission, substations, and hybrid solutions to connect resources to load centers.
Recent Industry Developments
- June 2026: Pertamina Geothermal Energy (PGE) announced that three geothermal projects secured up to USD 477.87 million in international funding, linked to the inclusion of projects such as Lumut Balai Units 3-4 and Lahendong Units 7-8 in Bappenas' 2026 Green Book. The financing strengthens the near-term development pathway for dispatchable geothermal capacity, a key complement to variable renewables in PLN's system planning.
- June 2025: Pertamina New & Renewable Energy (Pertamina NRE) acquired a 20% stake in Citicore Renewable Energy Corp (CREC) for about USD 115 million (PHP 6.7 billion). The cross-border move broadens Pertamina's renewables platform and can transfer project development and financing experience back into Indonesia's renewable buildout.
- January 2024: Star Energy Geothermal budgeted around USD 346 million for 102.6 MW of upgrades and engaged SLB for subsurface analytics to reduce drilling and reservoir risk across its portfolio. The program underlines continued reinvestment in existing geothermal assets and highlights service-provider partnerships as a lever to improve project performance and expand geothermal output.


Research Methodology Framework and Report Scope
Market Definition and Coverage
For this study, the Indonesia renewable energy market is defined as the installed renewable power capacity operating in the country, measured in gigawatts (GW) and tracked by technology and end-use connection.
Scope exclusions: We exclude spending values such as project CAPEX, equipment revenue, and O&M service revenue unless they directly translate into installed capacity additions.
Segmentation Overview
- By Technology
- Solar Energy (PV and CSP)
- Wind Energy (Onshore and Offshore)
- Hydropower (Small, Large, PSH)
- Bioenergy
- Geothermal
- Ocean Energy (Tidal and Wave)
- By End-User
- Utilities
- Commercial and Industrial
- Residential
Data Sources, Market Sizing, and Validation
Desk Research
Desk work started with public energy statistics that can be checked by any reader, then it was narrowed down to renewable capacity and additions. Sources used include Indonesia's MEMR statistics and RUPTL planning documents, PLN releases on generation and grid connection, IEA and IRENA country tables, and World Bank energy indicators.
To avoid building the model on one single dataset, capacity additions were also cross-checked with sources such as project tender notices, permitting announcements, reputable press coverage, and company filings and investor presentations for operators and developers. When needed, a paid subscription focused on company financials and another covering patent and technology activity were used only to validate timelines, ownership changes, and build-out signals, not to replace public capacity data. These desk research sources are illustrative only, and many other references were used for clarification, back-checks, and final validation.
Primary Interviews and Surveys
Primary interviews and surveys were used to confirm how capacity is counted once projects move from announcement to commissioning, and to test assumptions on utilization, grid readiness, and typical delays. We spoke with a mix of developers, EPC contractors, utilities and grid stakeholders, regulators, and large commercial buyers, with coverage across major islands so the view was not Java-only.
Distribution of primary research fieldwork respondents
| Company type | Respondent position |
|---|---|
| Top tier: 27% | CXOs: 14% |
| Mid tier: 51% | Functional/Unit leaders: 33% |
| Smaller Players: 22% | Managers: 53% |
Market-Sizing & Forecasting
Sizing is built mainly from a top-down reconstruction of the national renewable capacity stack, where official capacity totals and planned additions are translated into year-by-year installed GW by technology. After the total was formed, it was corroborated through selective bottom-up approximations, such as sampling announced projects, applying realistic commissioning slippage, and using volume checks on typical plant sizes and connection milestones.
Key inputs used in the model include stated targets in national power planning, annual renewable capacity additions, project pipeline status (awarded, under construction, commissioned), grid connection readiness, and technology-specific commissioning lead times. For forecast shaping, scenario analysis was applied, where the base case is anchored to planned additions and policy direction, and the upside and downside are adjusted using primary feedback on permitting speed, financing availability, and grid constraints. Where project-level detail is incomplete, conservative gap-handling was used by allocating additions based on historical shares and the near-term pipeline mix, and then revisiting the split during validation.
Data Validation & Update Cycle
Outputs are validated through triangulation across independent signals, including official capacity totals, publicly communicated project milestones, and technology roll-ups that should reconcile back to the national installed base. Outliers are reviewed in a step-by-step analyst check, and when a large variance shows up, follow-up calls are triggered to confirm whether it is a timing issue, a unit conversion issue, or a scope mismatch.
Reports are refreshed annually, with interim updates when a material event changes the build-out path, such as a major policy revision, tariff change, or grid plan revision. Before delivery, a fresh pass is completed so the final numbers reflect the latest publicly available updates and the most recent primary feedback.
Mordor Intelligence's Indonesia Renewable Energy Market Size Versus Other Published Estimates
Published market sizes for Indonesia renewable energy often do not match each other because they are not always measuring the same thing, even when the titles look similar. The biggest differences usually come from the unit of measurement (capacity versus revenue), what gets counted as part of the market, and the year timing used for currency and commissioning.
Some sources present the market as USD revenue, which can mix equipment sales, development spending, and ongoing services into one total. In Mordor Intelligence's sizing, the market is counted strictly as installed renewable power capacity in GW for the stated year, and it is reconciled to commissioning and grid connection status rather than investment value.
Benchmark comparison
| Source | Market Size | Gaps in Research Methodology |
|---|---|---|
| Mordor Intelligence | USD 18.4 B (2026) | |
| Industry Research House A | USD 16.5 B (2025) | Reported in USD revenue terms, which can fold in project spending and equipment sales that do not translate one-to-one into installed capacity, and the base year is different from the capacity-based year used here. |
| Market Publisher B | USD 9.14 B (2026) | Uses a narrower revenue view that can undercount utility-scale build-outs when projects are delayed in billing or booked outside the year, and it may apply different assumptions on what qualifies as renewable investment across grid-connected and off-grid systems. |
The spread in the table is mainly explained by unit choice and scope. Once the market is tied to installed GW and checked against commissioning status, the estimate becomes easier to audit year over year, and buyers can link movements to drivers like additions, delays, and technology mix.


Key Questions Answered in the Report
How large is the Indonesia Renewable Energy market in 2026?
Installed capacity stands at 18.4 GW and is on track for 15.20% CAGR through 2031.
Which technology is growing fastest in Indonesia?
Wind capacity is forecast to rise at 55.95% CAGR from 2026 to 2031, driven by projects in South Sulawesi and offshore zones.
Why do corporate PPAs matter for Indonesia’s energy transition?
Data-center and manufacturing buyers sign 15-year contracts that speed project financing and now drive the fastest-growing demand segment at 21.1% CAGR.
What limits renewable dispatch despite falling costs?
Must-run coal PPAs covering more than 40 GW of capacity force PLN to prioritize coal generation, curtailing solar and wind output.
How will JETP funds influence project economics?
USD 20 billion in concessional finance is lowering the cost of capital by up to 200 basis points for qualifying renewable projects.
Which regions present the next frontier for renewables?
Eastern provinces such as Papua and Nusa Tenggara offer off-grid microgrid potential, while offshore wind prospects lie in the Makassar Strait.
Page last updated on:




