Indonesia Plastic Food Tray Market Size and Share
Market Overview
| Study Period | 2020 - 2031 |
|---|---|
| Forecast Data Period | 2026 - 2031 |
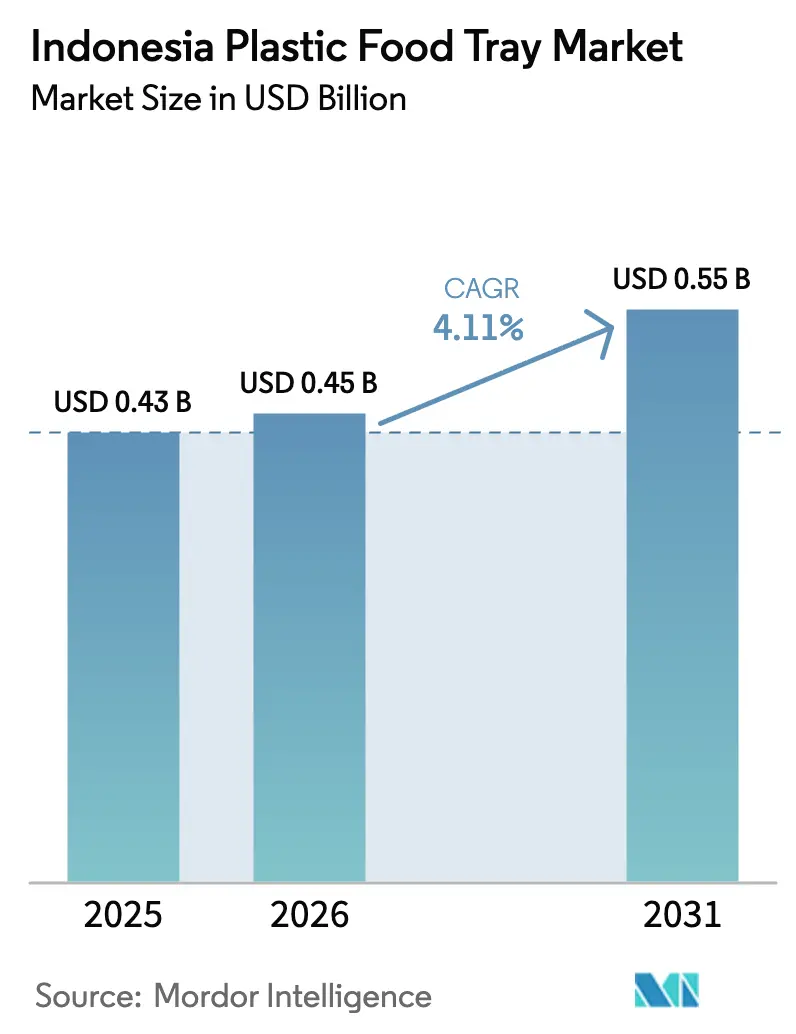
| Base Year Market Size (2025) | USD 0.43 Billion |
| Market Size (2026) | USD 0.45 Billion |
| Market Size (2031) | USD 0.55 Billion |
| Growth Rate (2026 - 2031) | 4.11% CAGR |
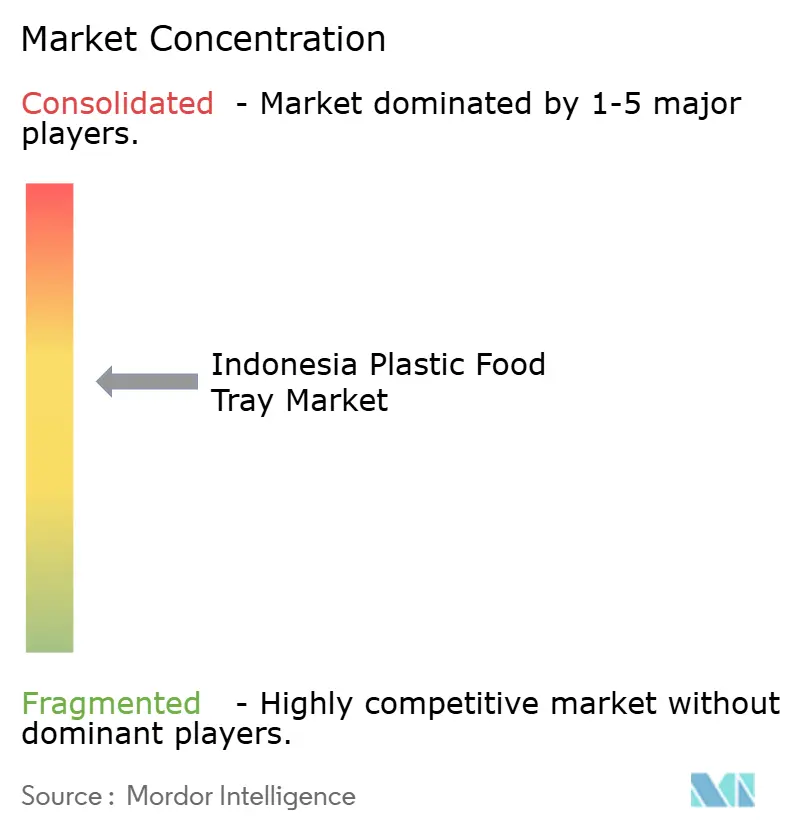
| Market Concentration | Medium |
Major Players *Disclaimer: Major Players sorted in no particular order Image © Mordor Intelligence. Reuse requires attribution under CC BY 4.0. | |
Indonesia Plastic Food Tray Market Analysis by Mordor Intelligence
The Indonesia plastic food tray market size is expected to increase from USD 0.43 billion in 2025 to USD 0.45 billion in 2026 and reach USD 0.55 billion by 2031, growing at a CAGR of 4.11% over 2026-2031. Surging online meal delivery, a nationwide convenience-store boom, and the government’s free nutritious meals program are expanding use cases for single-compartment take-away formats and chilled lidded trays. Domestic recycled PET (rPET) capacity of 286,000 tonnes per year hedges converters against rupiah swings, while SNI 8424:2023 gives legal certainty for food-contact recycled content. Automation subsidies under Making Indonesia 4.0 help small and mid-size thermoformers cut cycle time and material waste, shrinking the cost gap with listed incumbents. At the same time, municipal bans on polystyrene and pilot reusable schemes in Jakarta and Bali push brand owners toward clearer, high-barrier, and increasingly compostable solutions.
Key Report Takeaways
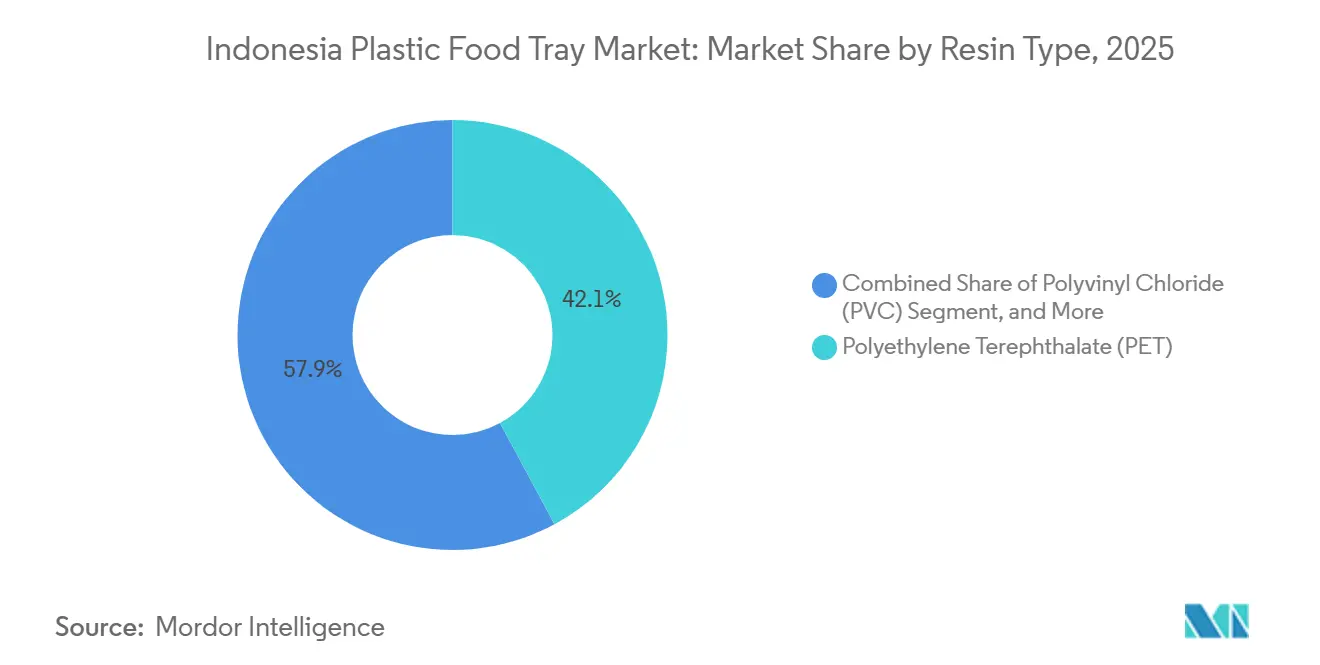
- By resin type, polyethylene terephthalate led with 42.13% of the Indonesia plastic food tray market share in 2025.
- By tray configuration, single-compartment formats accounted for 46.33% share of the Indonesia plastic food tray market size in 2025, while lidded /MAP-compatible trays are advancing at a 4.89% CAGR through 2031.
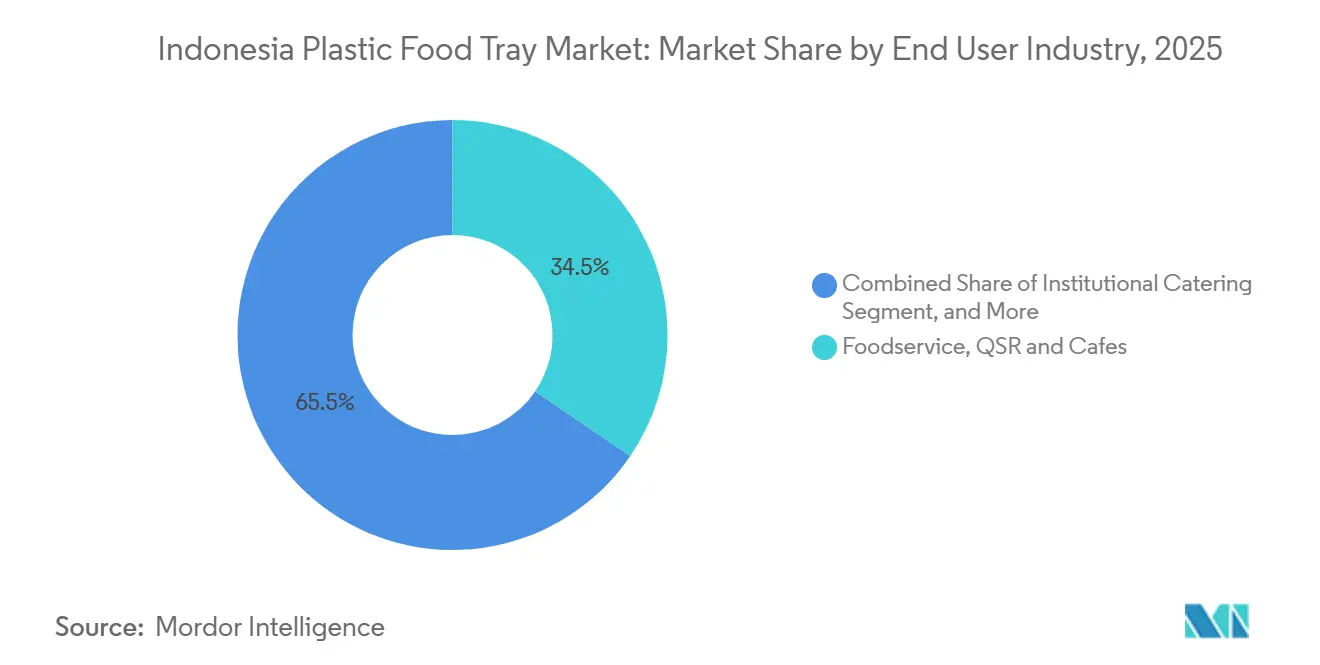
- By end user, foodservice, quick-service restaurants, and cafés held 34.52% share in 2025; modern retail ready meals are projected to expand at a 4.91% CAGR between 2026-2031.
- By application, ready-to-eat and take-away meals captured 41.87% of volume in 2025; meat and seafood formats are forecast to grow at a 4.83% CAGR to 2031.
Note: Market size and forecast figures in this report are generated using Mordor Intelligence’s proprietary estimation framework, updated with the latest available data and insights as of 2026.
Indonesia Plastic Food Tray Market Trends and Insights
Drivers Impact Analysis*
| Driver | (~) % Impact on CAGR Forecast | Geographic Relevance | Impact Timeline |
|---|---|---|---|
| Expanding Ready-to-Eat and Online Food Delivery Ecosystem | +1.2% | National, concentrated in Greater Jakarta, Surabaya, Bandung, Medan, Bali | Short term (≤ 2 years) |
| Rapid Growth of Modern Convenience Retail Formats | +0.9% | National, accelerating in Semarang, Makassar, Palembang, Balikpapan | Medium term (2-4 years) |
| Surge in Domestic rPET Capacity Enabling Food-Contact Recycled Trays | +0.7% | Java-centric, emerging in Sumatra and Kalimantan | Medium term (2-4 years) |
| Government Push for Industry 4.0 Adoption in Food and Beverage Packaging Lines | +0.5% | National, SEZ-based converters and exporters | Long term (≥ 4 years) |
| AI-Driven Thermoforming Optimization Reducing Unit Costs for SMEs | +0.4% | Bekasi, Tangerang, Sidoarjo clusters | Medium term (2-4 years) |
| Election-Year and Mega-Event Catering Demand Spikes | +0.3% | Jakarta, Bali, host cities for ASEAN summits | Short term (≤ 2 years) |
| Source: Mordor Intelligence | |||
Expanding Ready-to-Eat and Online Food Delivery Ecosystem
Gross merchandise value for online food delivery reached USD 6.4 billion in 2025, an 18% jump that heightened the need for sturdy, leak-proof trays able to survive 45-minute rides. Ghost kitchens multiplied in Greater Jakarta and Surabaya, standardizing tray footprints to minimize SKU complexity and pallet space. The model locks in high repeat volumes, allowing converters to run longer cycles and lower change-over waste. Reusable pilot programs in top-tier cities have yet to scale because reverse-logistics costs overshadow sustainability benefits.[1]Reuters Staff, “Indonesia QSR Chains Test Reusable Packaging,” Reuters, reuters.com Parallel demand from the national free-meal scheme ensures baseline volumes even if per-capita delivery growth flattens. Together these channels support steady tonnage growth for the Indonesia plastic food tray market.
Rapid Growth of Modern Convenience Retail Formats
Convenience-store count hit 48,158 outlets in late 2024, giving PET and PP trays wider chilled shelf exposure.[2] Chains now devote up to 20% of refrigerated cases to grab-and-go meals, lifting demand for lidded MAP-compatible formats with oxygen and moisture barriers below 5 cm³/m²·day and 2 g/m²·day respectively. Hypermarkets add traceability barcodes and time-temperature labels that fetch 10% premiums from health-conscious shoppers. Small thermoformers that can fast-tool multi-compartment molds win speed-to-shelf contracts. The retail shift from ambient to chilled zones therefore channels incremental revenue into high-value trays that lift the overall Indonesia plastic food tray market size.
Surge in Domestic rPET Capacity Enabling Food-Contact Recycled Trays
Local recyclers lifted rPET nameplate capacity to 286,000 tpy in 2025, and SNI 8424:2023 allows up to 100% post-consumer content once migration tests are cleared.[3]Sustainability Team, “Sustainability and Circular Economy in Plastic Packaging: A Review,” Sustainability, mdpi.com rPET prices run 5-8% below virgin PET in rupiah terms, providing a cushion during episodes of currency weakness. Brand owners signing offtake agreements lock in traceable volumes, while converters with on-site decontamination lines enjoy margin upside when Brent-linked virgin pricing spikes. Legislative signals point to a mandatory producer-responsibility decree in 2026, promising even richer feedstock streams. These interacting factors reduce feedstock risk and spur investment, reinforcing the upward trajectory of the Indonesia plastic food tray market.
Government Push for Industry 4.0 Adoption in Food and Beverage Packaging Lines
The Ministry of Industry earmarked IDR 500 billion (USD 31.4 million) in 2025 for automation grants, covering cavity-pressure sensors and predictive-maintenance software. Early adopters report 8-12% shorter cycle times and material scrap savings near 15%. Export-oriented converters install vision inspection at 300 trays-per-minute to meet Japanese zero-defect codes. Tax holidays and accelerated depreciation improve payback periods, encouraging mid-tier firms outside Jakarta to modernize. As more lines digitize, unit costs fall and consistent quality broadens tray penetration in chilled ready-meal aisles, strengthening long-run growth for the Indonesia plastic food tray industry.
Restraints Impact Analysis*
| Restraint | (~) % Impact on CAGR Forecast | Geographic Relevance | Impact Timeline |
|---|---|---|---|
| Volatility in Imported Resin Prices Due to Rupiah Swings | -0.8% | National, acute for firms without hedging or captive compounding | Short term (≤ 2 years) |
| Intensifying Regulatory Scrutiny on Food-Contact Chemicals | -0.6% | Jakarta, Bali, export-oriented facilities | Medium term (2-4 years) |
| Fragmented Cold-Chain Limiting High-Value Chilled Tray Uptake | -0.5% | Eastern Indonesia, tier-3 cities outside Java and Sumatra | Long term (≥ 4 years) |
| Consumer Campaigns Against Single-Use Plastics in Tier-1 Cities | -0.4% | Jakarta, Bali, Surabaya, Bandung | Short term (≤ 2 years) |
| Source: Mordor Intelligence | |||
Volatility in Imported Resin Prices Due to Rupiah Swings
Indonesia meets roughly half of its PET need through imports priced in USD, so a 2-4% quarterly rupiah swing compresses margins for converters without forward covers. rPET offers a native currency hedge, yet color drift and residual odor limit substitution for clear premium trays. PP and PS show milder price swings because they rely on Pertamina naphtha, but their barrier metrics fall short for MAP uses. Mid-size converters struggle with working-capital strain when pre-buying resin to lock in costs. Larger firms like PT Indopoly carry 45-60 days of inventory, helping them ride out turbulence.
Intensifying Regulatory Scrutiny on Food-Contact Chemicals
BPOM aligned phthalate and BPA limits with EU 10/2011 at 0.05 mg/kg in 2024, requiring batch-level compliance files that weigh heavily on SME budgets. Presidential Regulation 73/2023 also adds an excise that lifts virgin PET landing cost by roughly 4%. Export-minded converters must pass both domestic rules and Japan or Korea migration tests, delaying product launches. A mandatory producer-responsibility law expected in 2026 will layer additional levies on brand owners, likely flowing downstream via tighter price negotiations. The combined burden tempers short-run profitability of the Indonesia plastic food tray market.
*Our forecasts treat driver/restraint impacts as directional, not additive. The impact forecasts reflect baseline growth, mix effects, and variable interactions.
Segment Analysis
By Resin Type: Bioplastics Edge Up Amid Circularity Push
Polyethylene terephthalate accounted for 42.13% share in 2025, giving the Indonesia plastic food tray market size a clear-packaging anchor for sushi, fresh fruit, and chilled entrées. PET’s oxygen transmission rate below 5 cm³/m²·day safeguards color and texture in seven-day MAP displays. Polypropylene wins microwave meals thanks to a 110 °C heat-deflection ceiling, while polystyrene lingers in budget QSR take-away where clarity is less valued. Polyvinyl chloride continues to retreat as plasticizer migration comes under closer BPOM review.
Bioplastics, chiefly PLA and PBS, are projected to advance at a 5.09% CAGR to 2031, the fastest among resins. Jakarta and Bali bans are nudging retailers toward ISO 14855-compliant compostables. Seaweed-based PLA-rPET hybrids under pilot testing promise improved drop resistance without losing compostability. Price remains a hurdle, with PLA at a 50% premium to virgin PET, yet flagship SKUs from Unilever Indonesia and Nestlé show early consumer acceptance. As producer-responsibility fees and carbon pledges firm up, the visibility of biopolymers grows, adding diversity to the Indonesia plastic food tray market.


By Tray Configuration: MAP-Compatible Formats Capture Chilled Growth
Single-compartment trays dominated 46.33% of 2025 volume, riding QSR and ghost-kitchen uniformity that simplifies stock management. Clamshells thrive in burger chains where hinged lids save assembly labor, although their bulk inflates delivery fees. Multi-compartment bento designs appeal to calorie-controlled office lunches yet require longer cycle times, limiting SME adoption.
Lidded or MAP-ready trays are forecast to post a 4.89% CAGR through 2031, benefiting from cold-chain capacity that now reaches most tier-2 Java cities. These formats maintain oxygen below 1% and CO₂ above 20%, stretching red-meat shelf life to ten days. Retail pilots add QR codes and time-temperature tags that attract health-conscious shoppers at a 10% markup. Converters investing in in-line heat-sealers secure retailer contracts early, cementing a profitable niche within the wider Indonesia plastic food tray market.
By End User Industry: Modern Retail Outpaces Foodservice
Foodservice, including QSRs and cafés, delivered 34.52% of 2025 demand, reinforced by 18% digital-order growth. Ghost kitchens specify single tray footprints, enabling long thermoforming runs and repeatable quality. Institutional catering gains momentum as the free-meal program scales, awarding large, multi-year bids to ISO 22000 plants.
Modern retail, covering ready meals and fresh produce, is on track for a 4.91% CAGR to 2031, a pace that will boost its share of the Indonesia plastic food tray market. Indomaret and Alfamart expansion into tier-3 towns exposes chilled trays to new shopper cohorts. Delivery-platform commission pressure, however, restrains foodservice operators from paying large green-material premiums, while institutional buyers prize compliance and punctuality over material innovation.
By Application: Meat and Seafood Packaging Accelerates
Ready-to-eat and take-away meals held 41.87% volume in 2025, leaning on single-compartment PET and PS clamshells fitted with tamper-evident closures for ride-share safety. Bakery and confectionery rely on lightweight PP inserts that stop product scuffing yet face substitution by windowed paperboard in cities with stricter bans.
Meat and seafood applications are forecast to climb at a 4.83% CAGR as per-capita protein intake rises and supermarkets shift from wet-market bulk to resealable MAP trays. These packs cut shrink, enable central butchering, and dovetail with emerging cold-chain corridors into Sumatra and Kalimantan. Fresh-cut produce trays grow modestly, constrained by gaps in reefers east of Java. Yet the segment keeps precision-tooled PET demand alive and encourages converters to co-develop respiration-rate micro-perforations, reinforcing depth in the Indonesia plastic food tray industry.
Geography Analysis
Java accounted for roughly 68% of 2025 sales, underpinned by dense urban clusters and 6.4 billion USD in online food delivery receipts. Greater Jakarta, Surabaya, and Bandung anchor chilled retail footprints and host most automated thermoforming lines. Sumatra produced 16% of volume, with Medan and Palembang acting as logistics bridges to Aceh and Riau; still, limited reefer penetration caps MAP tray uptake. Kalimantan, Sulawesi, and eastern provinces jointly supplied 14% of demand, suffering higher landed costs caused by double handling at Surabaya ports.
Bali and Nusa Tenggara show the fastest percentage growth, fueled by returning tourists and strict single-use bans that stimulate compostable PLA tray pilots. Local hospitality groups tolerate 50% cost premiums to align with provincial waste rules, lifting the region’s share of the Indonesia plastic food tray market. Papua and Maluku lag because only 40% of cold-chain assets meet ISO performance thresholds, steering grocers toward ambient-stable sachets.
To shorten lead times, converters lease depots in Makassar, Balikpapan, and Manado, sacrificing some working capital to capture underserved retail. Policy makers are debating an extension of SEZ tax holidays to eastern Indonesia in 2026, a move that could tilt new line investments away from Java. If realized, regional balance would broaden tray manufacturing resilience and dilute concentration risk across the Indonesia plastic food tray market size.
Competitive Landscape
The top five suppliers controlled about 38% of the Indonesia plastic food tray market in 2025, a level that signals moderate fragmentation. PT Indopoly, PT Berlina, and PT Argha Karya Prima leverage integrated film extrusion and nationwide sales branches to win high-volume bids. PT Berlina lifted Q1 2025 operating profit to IDR 31 billion (USD 1.95 million) after pivoting toward premium lidded variants for Unilever Indonesia. Amcor’s merger with Berry Global added scale but only USD 58 million Asia-Pacific rigid turnover, so direct Indonesian exposure remains light.
SME thermoformers respond by adopting cavity-pressure controls and scrap analytics, cutting unit cost up to 12% and challenging listed incumbents on local tenders. Vision-inspection retrofits exceeding 300 trays per minute help PT Thermopak and PT Vacpack chase Japanese export contracts that carry zero-defect clauses. Start-ups linked to IPB University are prototyping seaweed-PLA blends with 30% rPET reinforcement, though commercialization sits two to three years out. As automation diffuses, performance gaps narrow, creating a more level playing field across the Indonesia plastic food tray industry.
Emerging white space lies in intelligent packaging that embeds time-temperature indicators or pH-sensitive inks, fetching premiums in premium meat aisles. The approaching mandatory producer-responsibility framework may nudge multinational food processors to consolidate suppliers around converters who can certify recycled input traceability. Midsize firms that combine rPET access, automation, and compliance labs stand best placed to lift share in the growing Indonesia plastic food tray market.
Indonesia Plastic Food Tray Industry Leaders
Amcor PLC
Sonoco Products Company
PT Thermopak Karya Indonesia
PT Vacpack Indonesia
PT Gosyen Pacific Sukses Makmur
- *Disclaimer: Major Players sorted in no particular order

Recent Industry Developments
- April 2025: Amcor completed its merger with Berry Global, adding USD 1.6 billion in global rigid revenue and signaling future Southeast Asian investment potential.
- March 2025: PT Berlina reported Q1 net sales of IDR 276.1 billion (USD 17.4 million) and a year-on-year operating profit jump to IDR 31 billion (USD 1.95 million).
- February 2025: The Ministry of Industry set aside IDR 500 billion (USD 31.4 million) to subsidize packaging-line automation within special economic zones.
- January 2025: PT Indopoly Swakarsa posted nine-month 2025 revenue of USD 178.84 million, up 14.6% versus prior year.


Indonesia Plastic Food Tray Market Report Scope
A plastic food tray is a rigid or semi-rigid container made from food-grade plastic designed to hold, store, transport, display, or serve food items. These trays are widely used in food packaging, catering, supermarkets, ready-meal products, and takeaway services.
The Indonesia Plastic Food Tray Market Report is Segmented by Resin Type (Polyethylene Terephthalate, Polypropylene, Polystyrene, Polyvinyl Chloride, Bioplastics), Tray Configuration (Single-Compartment, Multi-Compartment, Clamshell, Lidded/MAP-Compatible), End User Industry (Foodservice QSR and Cafes, Institutional Catering, Food Processing Manufacturers, Modern Retail Ready Meals and Fresh Produce), Application (Ready-to-Eat/Take-Away Meals, Meat and Seafood, Bakery and Confectionery, Fresh-Cut Fruit and Vegetables). The Market Forecasts are Provided in Terms of Value (USD).
| Polyethylene Terephthalate (PET) |
| Polypropylene (PP) |
| Polystyrene (PS) |
| Polyvinyl Chloride (PVC) |
| Bioplastics (Polylactic Acid, Polybutylene Succinate) |
| Single-Compartment |
| Multi-Compartment |
| Clamshell |
| Lidded/MAP-Compatible |
| Foodservice, QSR and Cafes |
| Institutional Catering |
| Food Processing Manufacturers |
| Modern Retail, Ready Meals and Fresh Produce |
| Ready-to-Eat/Take-Away Meals |
| Meat and Seafood |
| Bakery and Confectionery |
| Fresh-Cut Fruit and Vegetables |
| By Resin Type | Polyethylene Terephthalate (PET) |
| Polypropylene (PP) | |
| Polystyrene (PS) | |
| Polyvinyl Chloride (PVC) | |
| Bioplastics (Polylactic Acid, Polybutylene Succinate) | |
| By Tray Configuration | Single-Compartment |
| Multi-Compartment | |
| Clamshell | |
| Lidded/MAP-Compatible | |
| By End User Industry | Foodservice, QSR and Cafes |
| Institutional Catering | |
| Food Processing Manufacturers | |
| Modern Retail, Ready Meals and Fresh Produce | |
| By Application | Ready-to-Eat/Take-Away Meals |
| Meat and Seafood | |
| Bakery and Confectionery | |
| Fresh-Cut Fruit and Vegetables |


Key Questions Answered in the Report
What is the forecast value for Indonesia plastic food tray demand by 2031?
The market is projected to reach USD 0.55 billion by 2031, growing at a 4.11% CAGR from 2026.
Which resin currently leads Indonesian tray consumption?
Polyethylene terephthalate holds 42.13% share thanks to its clarity and barrier properties.
Why are lidded /MAP-compatible trays gaining popularity?
Cold-chain expansion and retailer preference for extended shelf life drive a 4.89% CAGR for this format.
How does domestic rPET capacity benefit converters?
Local supply at a 5-8% discount to virgin PET shields margins during rupiah volatility and meets SNI 8424:2023 rules.
Who are the major listed players in the sector?
PT Indopoly, PT Berlina, and PT Argha Karya Prima together hold around 35-40% revenue share.
What is the main regulatory headwind facing the sector?
Tighter BPOM migration limits for phthalates and BPA increase testing costs for every batch.
Page last updated on:


