Smart Container Market Size and Share
Market Overview
| Study Period | 2020 - 2031 |
|---|---|
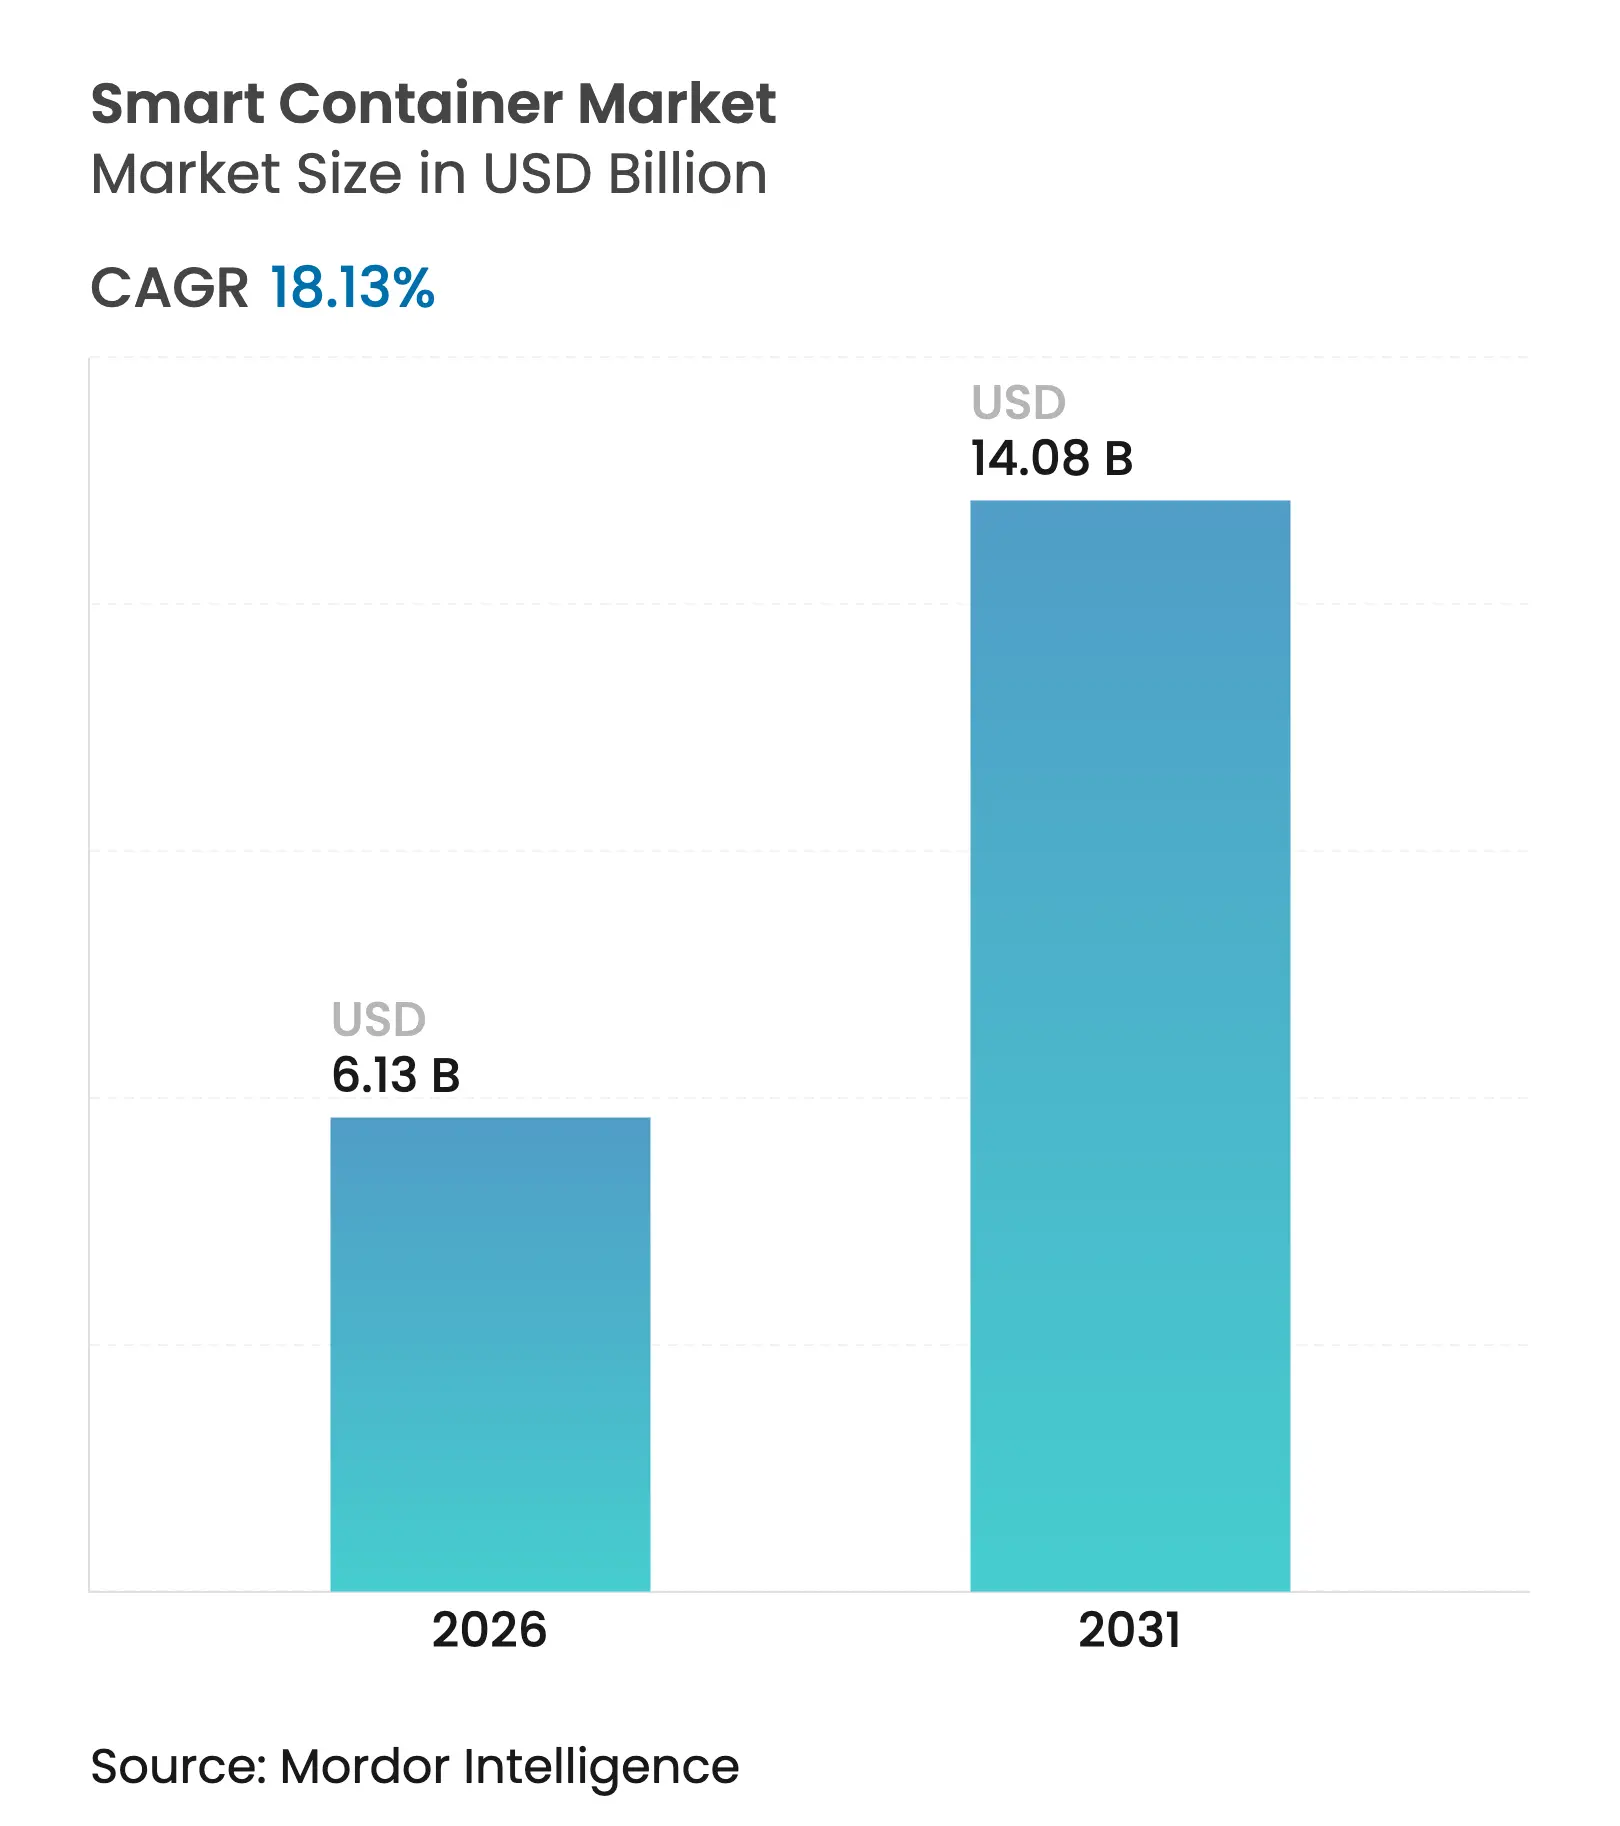
| Market Size (2026) | USD 6.13 Billion |
| Market Size (2031) | USD 14.08 Billion |
| Growth Rate (2026 - 2031) | 18.13 % CAGR |
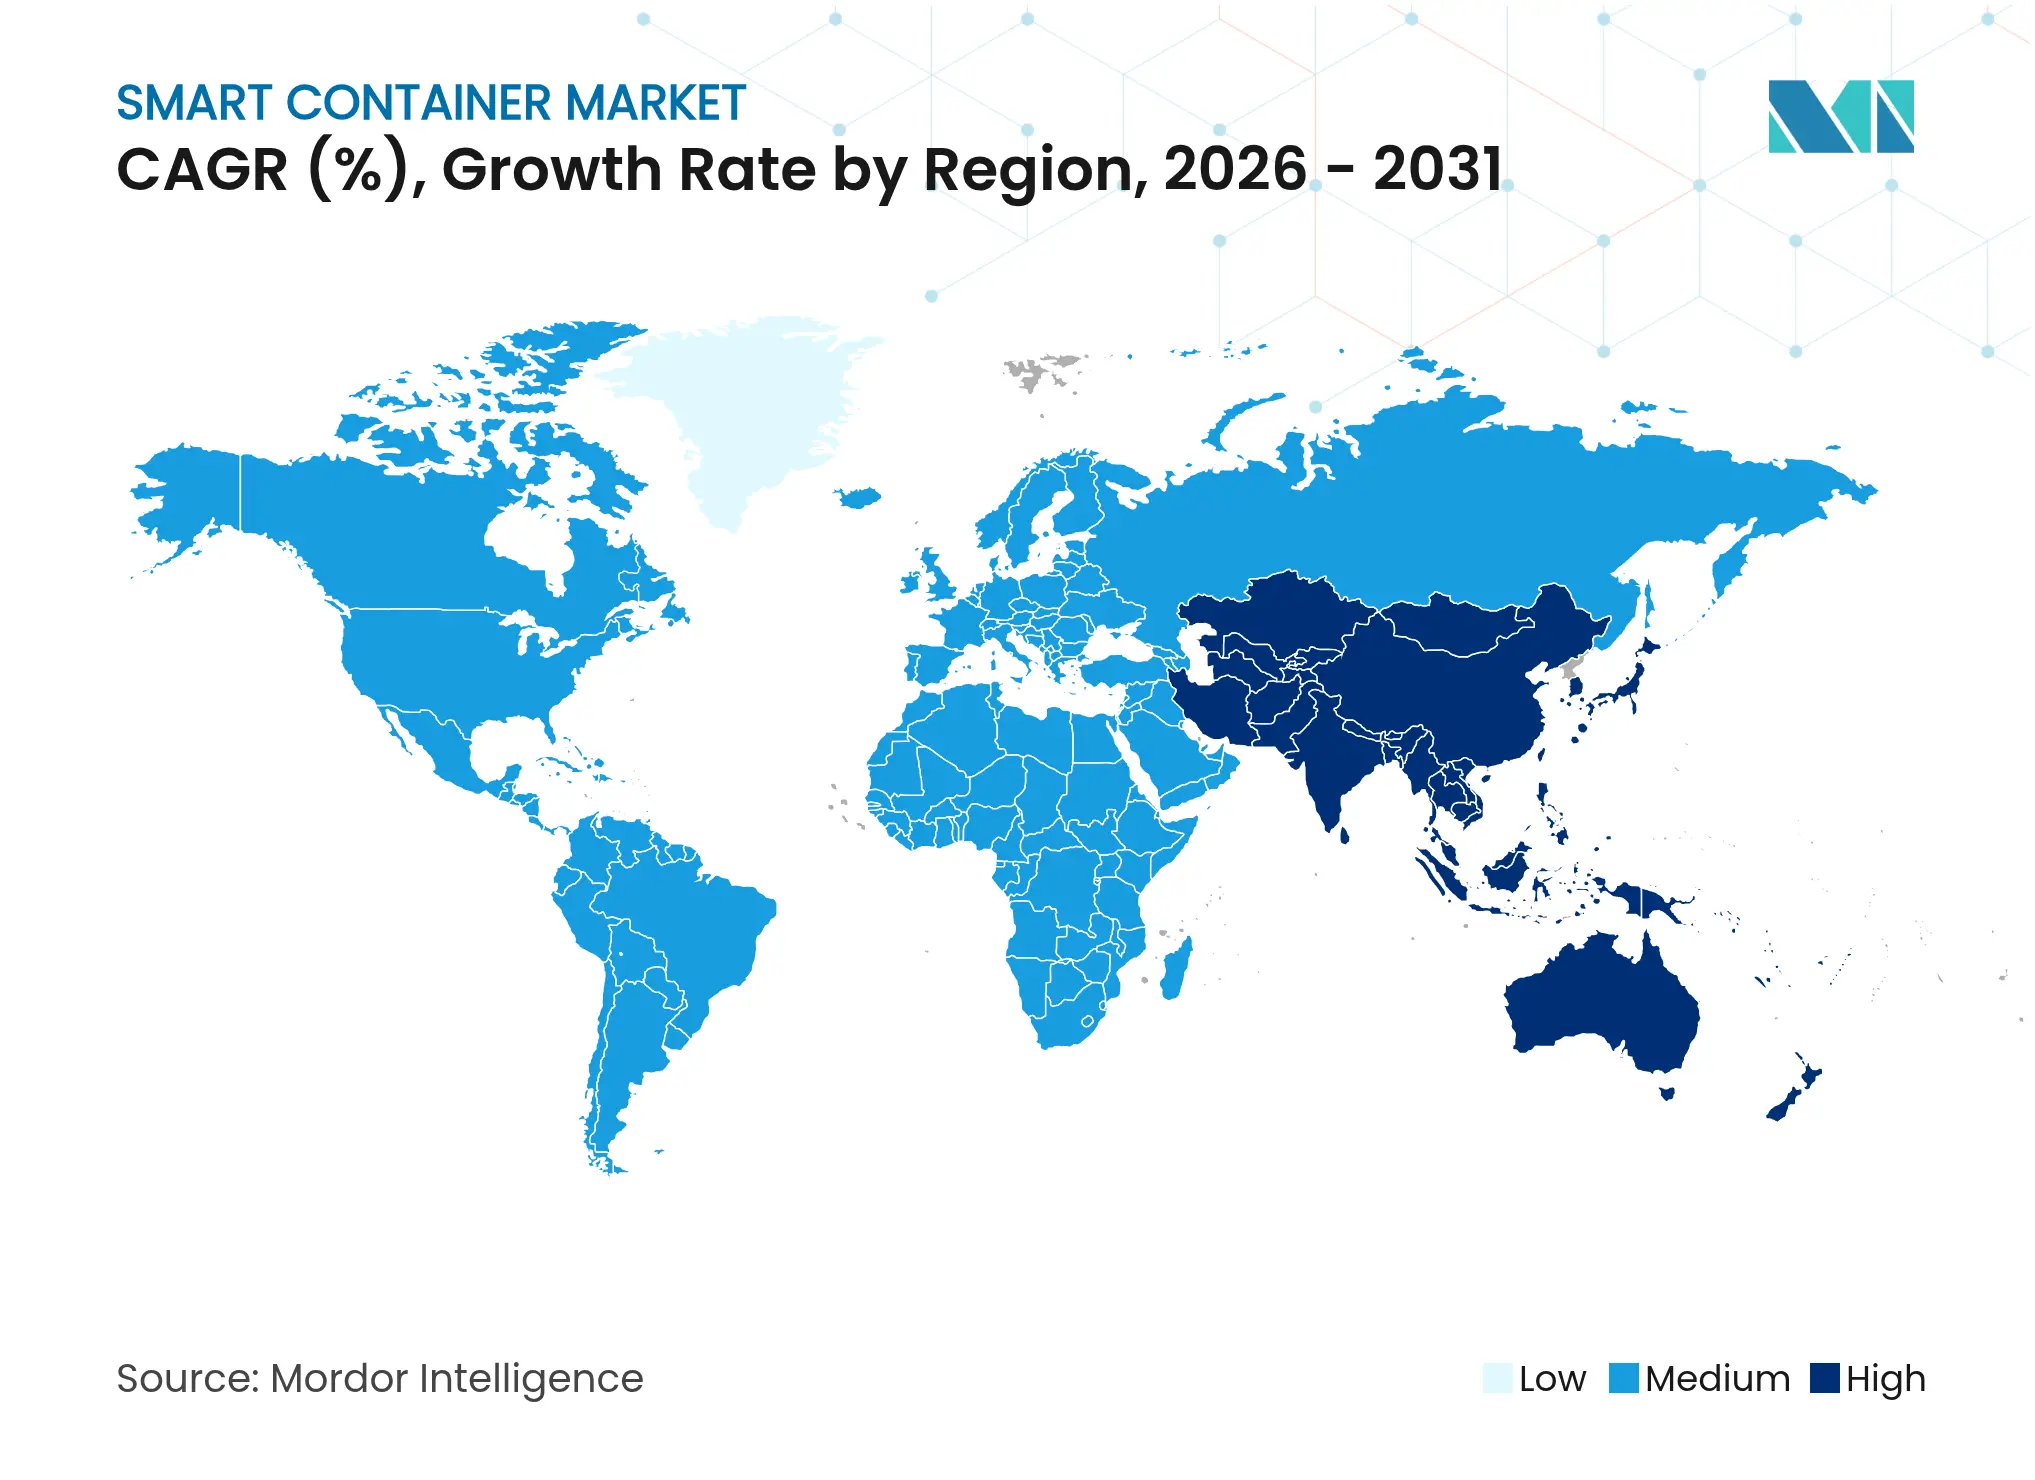
| Fastest Growing Market | Asia Pacific |
| Largest Market | North America |
| Market Concentration | Medium |
Major Players*Disclaimer: Major Players sorted in no particular order. Image © Mordor Intelligence. Reuse requires attribution under CC BY 4.0. |
Smart Container Market Analysis by Mordor Intelligence
The smart container market size is expected to grow from USD 5.19 billion in 2025 to USD 6.13 billion in 2026 and is forecast to reach USD 14.08 billion by 2031 at 18.13% CAGR over 2026-2031. Momentum stems from the maritime sector’s push to digitize after recent supply-chain shocks highlighted costly visibility gaps. Lower IoT hardware prices, wider satellite coverage, and stricter traceability rules are prompting operators to retrofit fleets. Refrigerated cargoes, pharmaceuticals, and temperature-sensitive foods continue to anchor deployments, while falling sensor costs and energy-harvesting modules are opening the door for dry-box adoption. Regional leadership remains with North America as firms comply with Food and Drug Administration traceability timelines, yet Asia-Pacific shows the quickest acceleration due to infrastructure spending tied to trans-Asian trade routes and new manufacturing hubs.
Key Report Takeaways
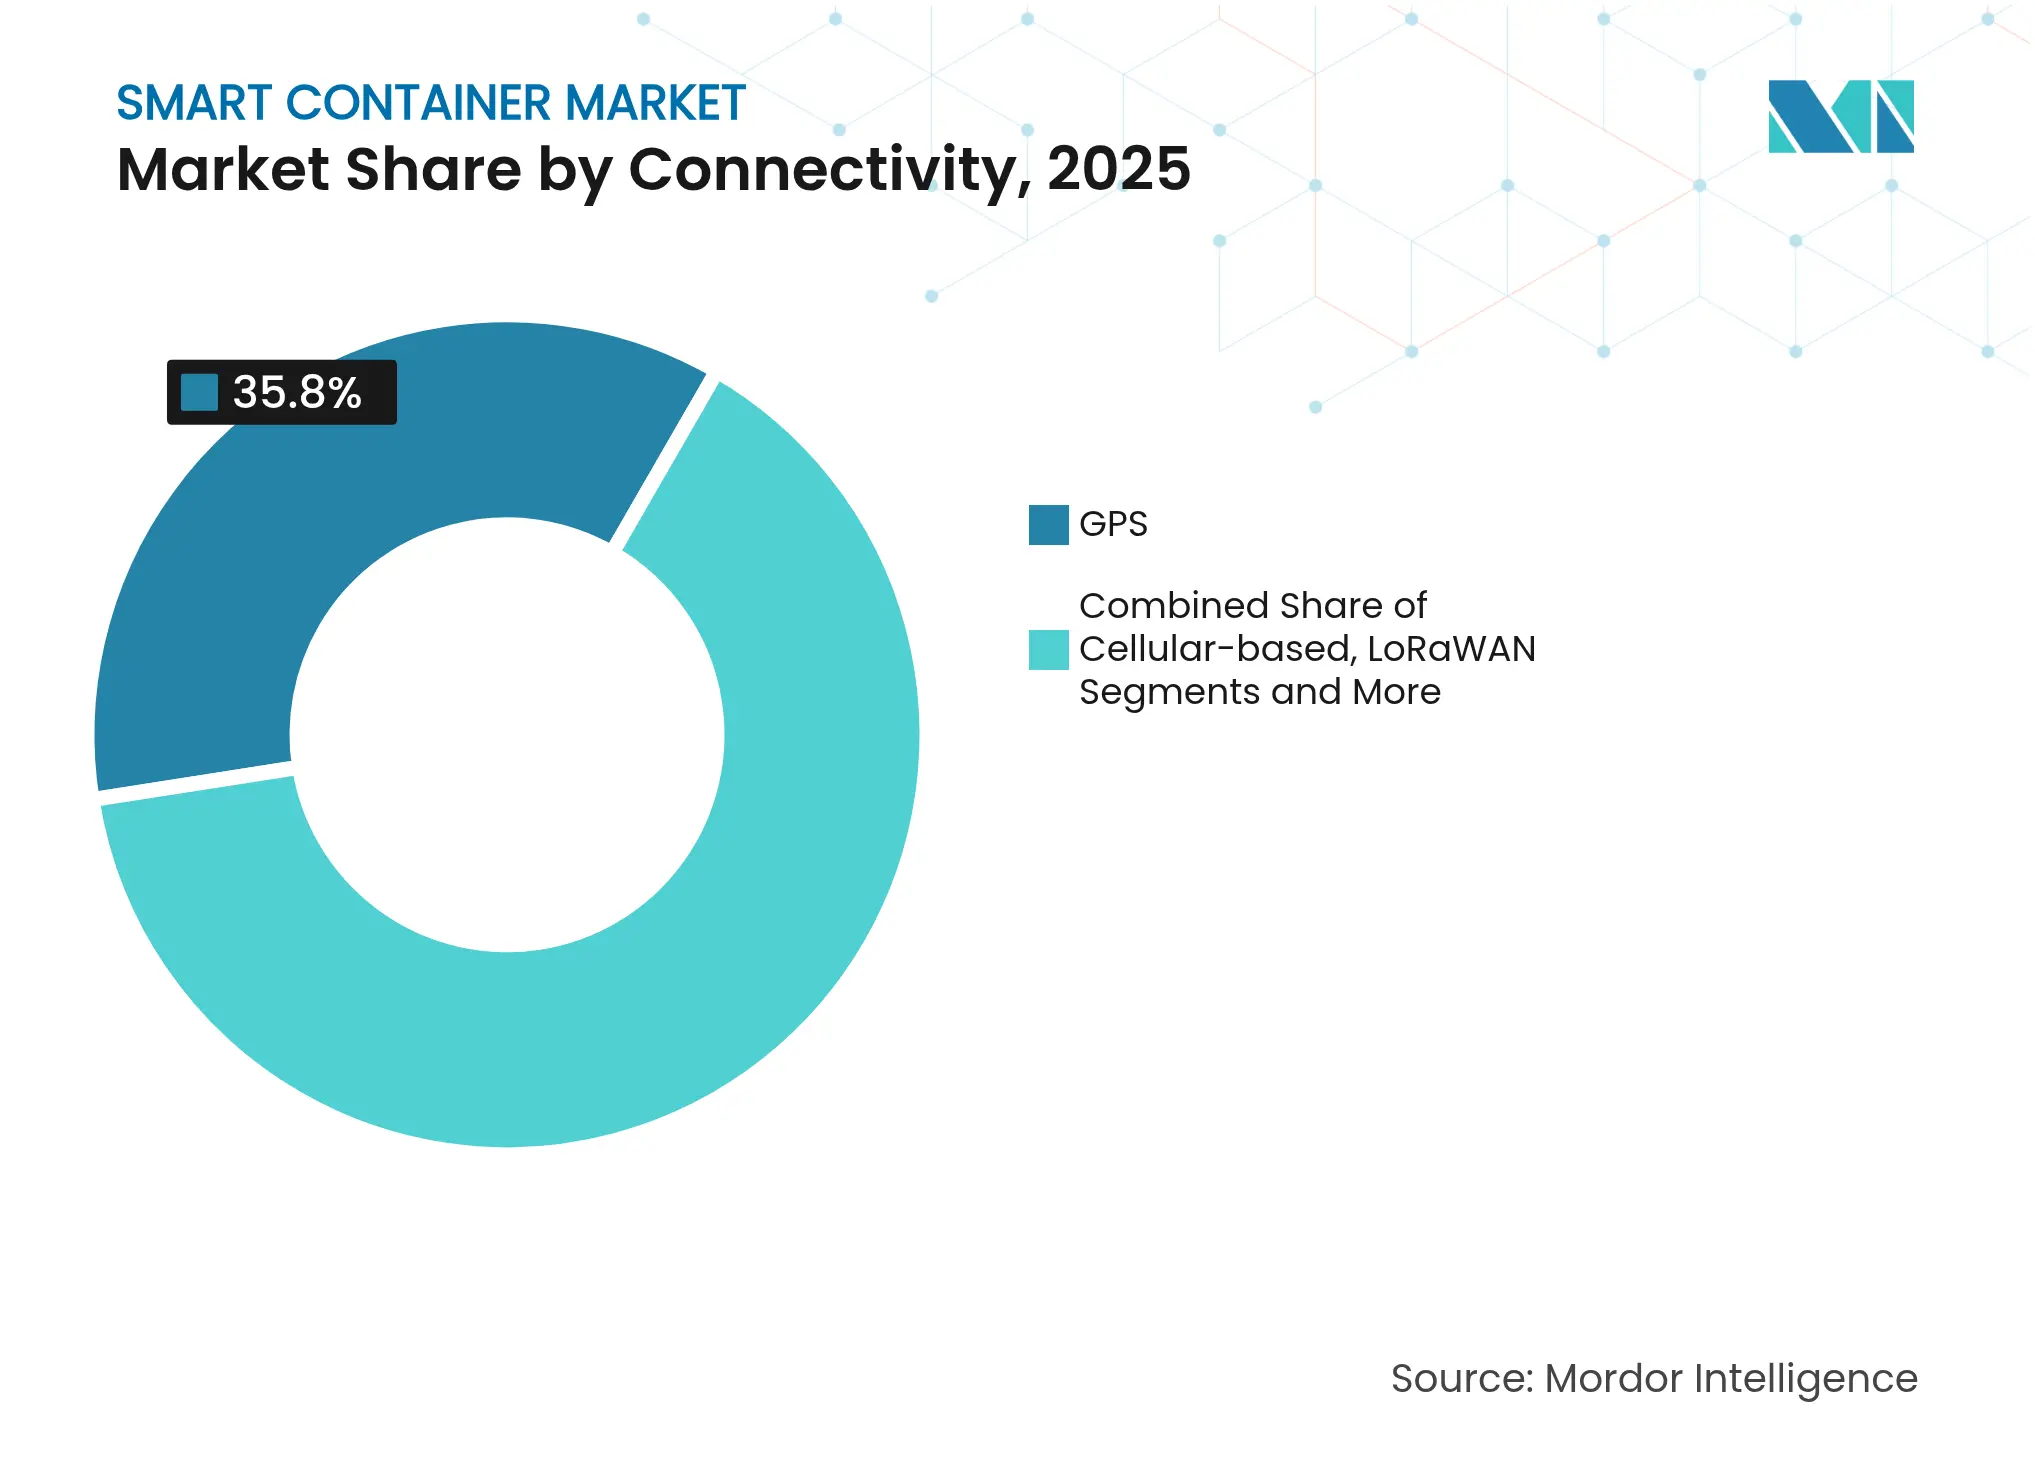
- By connectivity, GPS captured 35.80% of smart container market share in 2025, whereas LoRaWAN is forecast to expand at a 18.52% CAGR through 2031.
- By component, hardware accounted for 58.60% share of the smart container market size in 2025; software is projected to grow at a 19.6% CAGR to 2031.
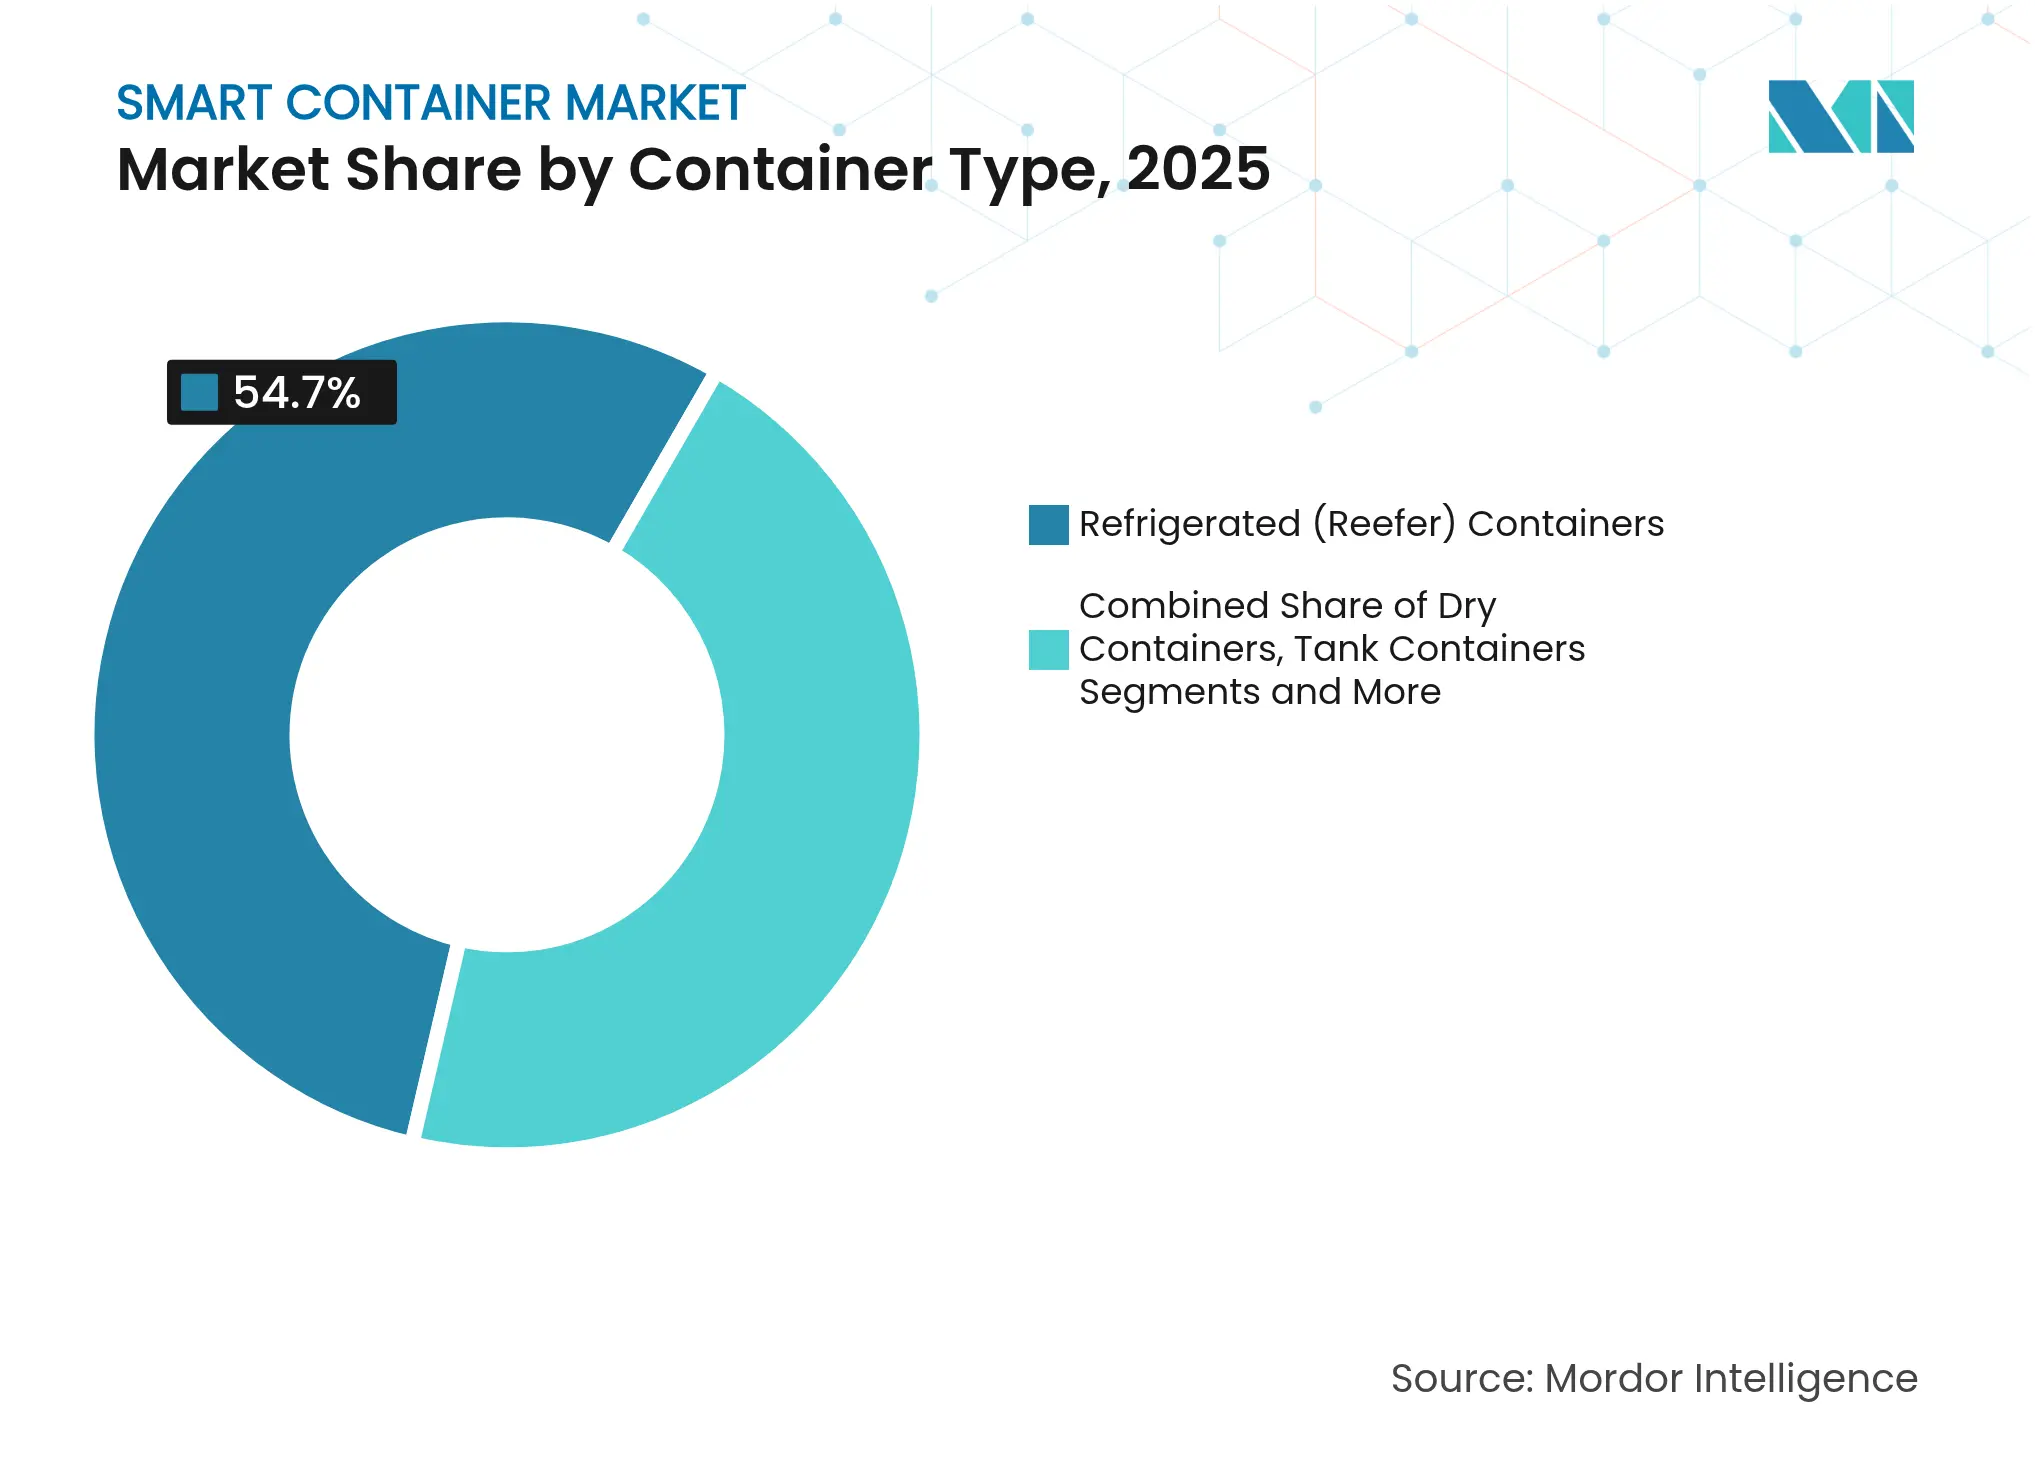
- By container type, refrigerated units commanded 54.70% share of the smart container market size in 2025, while dry containers are set to advance at a 19.05% CAGR through 2031.
- By end-use vertical, food and beverages led with 31.85% revenue share in 2025; pharmaceuticals and healthcare will post the fastest 18.38% CAGR to 2031.
- By geography, North America held 39.70% of the smart container market size in 2025; Asia-Pacific is on track for a 19.05% CAGR through 2031.
Note: Market size and forecast figures in this report are generated using Mordor Intelligence's proprietary estimation framework, updated with the latest available data and insights as of 2026.
Global Smart Container Market Trends and Insights
Drivers Impact Analysis
| Driver | (~) % Impact on CAGR Forecast | Geographic Relevance | Impact Timeline | |||
|---|---|---|---|---|---|---|
Rapid need for real-time supply-chain visibility Rapid need for real-time supply-chain visibility | +4.2% | Global, with concentration in North America and EU | Short term (≤ 2 years) | (~) % Impact on CAGR Forecast:+4.2% | Geographic Relevance:Global, with concentration in North America and EU | Impact Timeline:Short term (≤ 2 years) |
Expansion of global cold-chain logistics Expansion of global cold-chain logistics | +3.8% | Global, strongest in APAC and North America | Medium term (2-4 years) | |||
Declining IoT hardware and satellite connectivity costs Declining IoT hardware and satellite connectivity costs | +3.1% | Global, accelerated adoption in emerging markets | Medium term (2-4 years) | |||
Regulatory mandates for cargo traceability and food safety Regulatory mandates for cargo traceability and food safety | +2.9% | North America and EU primary, expanding to APAC | Long term (≥ 4 years) | |||
Blockchain-based carbon-reporting incentives Blockchain-based carbon-reporting incentives | +2.1% | EU leading, North America following | Long term (≥ 4 years) | |||
Insurance-premium discounts tied to telematics data Insurance-premium discounts tied to telematics data | +1.8% | North America and EU mature markets | Short term (≤ 2 years) | |||
| Source: Mordor Intelligence | ||||||
Rapid Need for Real-Time Supply-Chain Visibility
Global port congestion and vessel delays revealed how opaque container flows undermine both cost control and customer service. Major carriers have begun embedding multifunction sensors that stream location, temperature, humidity, and shock data from ship to shore. Continuous telemetry enables predictive maintenance of refrigeration units and earlier intervention when route deviations threaten on-time delivery. For shippers, this transparency elevates service levels and supports automated proof-of-delivery workflows. Financial stakeholders also benefit as verified movement histories shorten cargo-insurance adjudication cycles. The feedback loop positions real-time intelligence as a standard expectation rather than an optional upgrade.
Expansion of Global Cold-Chain Logistics
Precision logistics for biologics, mRNA vaccines, and high-value produce is intensifying the need to maintain cargo at tightly controlled temperatures. SkyCell’s 1500X Hybrid container, which offers 270-hour autonomous runtime, illustrates how engineering advances are extending lane flexibility while maintaining quality assurance. Fleet operators now incorporate edge analytics that predict refrigeration faults before the set point drifts, protecting cargo integrity and reducing spoilage claims. Chemical shippers mirror this trend, equipping isocyanate tank fleets with telematics that capture pressure and temperature to meet strict safety codes. The upshot is stronger demand for sensor-rich containers able to document compliance from origin to destination.
Declining IoT Hardware and Satellite Connectivity Costs
Sensor modules, antennas, and on-device processors now ship at a fraction of last decade’s price, cutting per-container retrofit budgets. Iridium’s solar-powered GPS trackers extend battery life up to 10 years while maintaining pole-to-pole coverage, removing earlier maintenance hurdles. Battery suppliers such as Ellenex estimate that nearly 80 million IoT batteries could be discarded daily by 2025, prompting adoption of lithium thionyl chloride chemistries with higher density. Maritime equipment makers therefore pair long-lived cells with thermoelectric energy harvesters that capture waste heat, as documented in peer-reviewed trials on commercial vessels. Lower lifetime costs and greener power options together improve the business case for fleet-wide installations.
Regulatory Mandates for Cargo Traceability and Food Safety
The U.S. Food and Drug Administration’s FSMA 204 rule requires high-risk food shippers to supply end-to-end traceability data within 24 hours starting January 2026[1]Food and Drug Administration, “FSMA 204 Traceability Rule,” fda.gov. Compliant operators must capture each critical tracking event—harvest, cooling, packing, and shipping—using digital systems rather than manual logs. European authorities are adding similar record-keeping obligations for allergens and shelf-life verification. Exporters into these markets therefore view smart containers as the quickest route to automated, auditable documentation. Blockchain pilots that pair encrypted sensor feeds with carbon-reporting modules are also gaining traction as firms seek proof of sustainability credentials for scope-3 emissions audits.
Restraints Impact Analysis
| Restraint | (~) % Impact on CAGR Forecast | Geographic Relevance | Impact Timeline | |||
|---|---|---|---|---|---|---|
High retrofitting costs and battery maintenance
High retrofitting costs and battery maintenance
| -2.8% | Global, more pronounced in emerging markets | Short term (≤ 2 years) | (~) % Impact on CAGR Forecast:
-2.8%
| Geographic Relevance:
Global, more pronounced in emerging markets
| Impact Timeline:
Short term (≤ 2 years)
|
Lack of global interoperability / standards
Lack of global interoperability / standards
| -2.1% | Global, fragmented by regional standards | Medium term (2-4 years) | |||
Rising cyber-risk and ransomware incidents in shipping
Rising cyber-risk and ransomware incidents in shipping
| -1.9% | Global, concentrated in major port hubs | Short term (≤ 2 years) | |||
Eco-regulations banning non-recyclable sensor housings
Eco-regulations banning non-recyclable sensor housings
| -1.4% | EU leading, expanding to North America and APAC | Long term (≥ 4 years) | |||
| Source: Mordor Intelligence | ||||||
High Retrofitting Costs and Battery Maintenance
Smart-enabling a conventional container costs USD 1,500–3,000 per unit, driven by ruggedized sensor packs and time in depots for installation. With a global fleet estimated at 47 million TEU, the total capital outlay can strain operators that run on slim margins. Battery upkeep remains a pain point because salt spray, vibration, and temperature swings accelerate degradation. High-density LiSOCl₂ cells extend service life yet raise procurement costs. Smaller leasing firms lack purchasing scale and face longer payback periods, delaying adoption. Energy-harvesting modules partially solve the issue, but their upfront premium still deters widespread use on low-value trade lanes.
Lack of Global Interoperability / Standards
Fragmented data schemas and proprietary communication stacks slow multi-carrier deployments. The Digital Container Shipping Association has issued track-and-trace guidelines, yet voluntary uptake varies by line. International Organization for Standardization committees continue refining hardware and messaging rules, but the pace trails market needs. Without common application programming interfaces, shippers juggle several portals to see fleet status end-to-end. Integration overhead reduces return on investment and can lock owners into single-vendor ecosystems, elevating switching costs.
Segment Analysis
By Connectivity: GPS Strength Faces LoRaWAN Momentum
GPS devices held 35.80% of the smart container market in 2025, reflecting deep maritime familiarity and reliable global positioning. Lower-cost chipsets ensure continued presence, yet their energy draw and limited in-box sensing constrain future expansion. LoRaWAN is set to grow at a 18.52% CAGR as its sub-GHz signals penetrate steel walls, enabling ambient-condition monitoring and door tamper alerts without constant satellite uplinks. Cellular links remain essential near shore but lose coverage mid-ocean, while hybrid modules that auto-switch to satellite maintain secure data pipelines on long voyages. The resulting hierarchy allows operators to match sensor density and airtime costs to cargo value.
Edge innovations are further tilting choices. LoRaWAN gateways integrated into vessel power and shipboard Wi-Fi backhaul aggregate thousands of container nodes, trimming airtime fees. Satellite providers meanwhile extend narrow-band 5G overlays that deliver small payloads at competitive tariffs. As interoperability improves, fleet managers favor mixed-mode architectures that leverage GPS for macro-tracking and LoRaWAN for condition sensing. Continued software-defined radio advances are expected to blur boundaries, ensuring flexible connectivity bundles remain a central purchase criterion in the smart container market.
Note: Segment shares of all individual segments available upon report purchase
By Component: Hardware Foundation, Software Upside
Hardware captured 58.60% of smart container market share in 2025 because sensors, antennas, and power packs remain prerequisite assets. Vendors now ship plug-and-play retrofit kits that finish installation within a single depot shift, lowering downtime and labor costs. Component commoditization is tipping bargaining power toward fleet owners, driving price compression and encouraging broader rollout to dry boxes. Even so, software revenues are climbing at a 19.6% CAGR as analytics platforms turn raw sensor data into route-level insights, carbon dashboards, and predictive maintenance alerts.
Edge processing performs initial event filtration, while cloud engines handle machine-learning models that flag anomaly clusters across thousands of voyages. Integrators sell subscription dashboards bundling geofencing, emissions calculators, and automatic compliance reporting with FSMA XML exports. Services such as training, certification, and KPI benchmarking are emerging as high-margin additions. As more units stream data, platform stickiness rises, granting software vendors recurring revenue streams and creating competitive moats inside the smart container market.
By Container Type: Reefer Leadership Gives Way to Dry-Box Uptake
Refrigerated equipment commanded 54.70% share in 2025, anchored by stringent temperature records needed for vaccines, oncology drugs, and perishable foods. Sensors now extend beyond temperature into humidity, air-flow, and even ethylene gas detection for produce ripeness, strengthening the use case. Tank containers for chemicals add pressure and liquid-level probes to comply with safety codes. Regulatory scrutiny and high cargo values ensure fast technology refresh cycles in these specialised pools.
The dry-box segment is forecast to grow at a 19.05% CAGR through 2031 as per-unit retrofit costs fall and battery lifespans improve. Globe Tracker’s Dry360, featuring a 10-year maintenance-free battery and door-tamper detection, signals where the economics are heading. Bulk shippers are beginning to pilot vibration sensors that deter theft by alerting when cutters breach side panels. As interoperability standards mature, the same platform can serve both reefer and dry fleets, allowing operators to spread fixed software costs across larger asset bases inside the smart container market.
Note: Segment shares of all individual segments available upon report purchase
By Industry Vertical: Food Compliance Spurs Pharma Gains
Food and beverage shippers held 31.85% of revenue in 2025 as supermarkets, processors, and exporters raced to meet 24-hour traceability mandates. Sensors prove cold-chain integrity from farm gate to retail distribution center, reducing waste and protecting brand reputation when recalls occur. Blockchain pilots in specialty coffee and premium seafood show strong consumer engagement when QR codes reveal verified journey histories.
Pharmaceutical and healthcare shipments are projected to climb at an 18.38% CAGR as biologics, gene therapies, and cell-culture reagents require narrow temperature ranges and shock avoidance. NX Group recently partnered with Tive to roll out multi-sensor trackers that log temperature, humidity, and G-force for semiconductor and life-science customers. Regulatory frameworks such as EU Good Distribution Practice require documented lane validation, making smart containers an operational necessity. In emerging verticals like automotive and high-value electronics, cargo-condition monitoring serves anti-theft functions and underpins just-in-time inventory strategies, broadening addressable demand.
Geography Analysis
North America led the smart container market in 2025 with 39.70% share, bolstered by Food and Drug Administration traceability mandates and insurance programs that reward telematics data with lower premiums. Rail intermodal corridors linking U.S. inland ports to Mexico and Canada rely on sensor-verified chain-of-custody logs to expedite customs clearance. Government grants for port digitization further accelerate adoption across cold-storage clusters near Los Angeles, Savannah, and Halifax.
Asia-Pacific is on track for the fastest 19.05% CAGR through 2031. China’s Belt and Road corridors are embedding IoT gateways at new deep-sea terminals while Japanese manufacturers specify container visibility as a tender requirement for high-precision parts. India’s pharmaceutical exporters adopt reefer telemetry to safeguard vaccine exports, and Southeast Asian produce cooperatives follow suit to penetrate premium consumer markets. Advanced manufacturing zones in South Korea and Singapore push early adoption of satellite-enabled dry-box tracking on long oceangoing legs.
Europe maintains steady expansion, driven by stringent environmental reporting and data-privacy standards that shape global vendor roadmaps. Germany’s automotive sector uses sensor data to optimise multimodal flows from inland factories to North Sea ports, while France mandates shock sensors for fine-wine shipments. Southern gateways such as Valencia and Piraeus deploy 5G edge networks that relay container diagnostics in near real time, supporting EU-wide emissions accounting initiatives. Collectively, regional policies and industry leadership ensure Europe remains a benchmark for standard-based operations in the smart container market.

Competitive Landscape
Market Concentration
The smart container market exhibits moderate concentration as technology vendors, leasing companies, and liner operators jostle to control data, devices, and service bundles. ORBCOMM supplies integrated telematics to carrier fleets and recently secured a global rollout with Hapag-Lloyd that links dry-box positioning, reefer performance, and fuel analytics in one interface[3]ORBCOMM, “Hapag-Lloyd Deploys ORBCOMM Smart Container Solutions,” orbcomm.com. Sensor innovators such as Nexxiot and Traxens design modular hardware that screws into existing vent holes, easing retrofits while feeding cloud platforms that predict maintenance needs.
Strategic partnerships dominate go-to-market activity. ZIM added Hoopo’s fleet-intelligence trackers to its dry-van pool, demonstrating how liners hedge technology risk by buying from specialist startups rather than building in-house. Container manufacturers now embed smart modules at the factory to shorten delivery cycles and lock buyers into associated analytics subscriptions. Leasing firms differentiate by offering usage-based sensor fees instead of up-front hardware charges, making adoption easier for small forwarders.
Service scope is widening as suppliers bundle carbon-reporting dashboards, cargo-insurance integration, and regulatory compliance templates. Thermo King’s TracKing Smart Trailer system extends condition visibility beyond the ship, synchronising with drayage and warehouse scheduling to ensure continuous monitoring from quay to customer dock. DS Smith adds fibre-based TailorTemp packaging that pairs with telematics beacons, capturing lane¬-specific temperature profiles to validate performance in sustainable packaging trials. Competitors able to orchestrate hardware, connectivity, and analytics into a unified offer are thus best placed to capture premium margins.
Smart Container Industry Leaders

*Disclaimer: Major Players sorted in no particular order
Recent Industry Developments
- February 2025: Thermo King launched TracKing Smart Trailer telematics, providing real-time insights on tire pressure, brake health, and refrigeration performance.
- January 2025: DS Smith introduced TailorTemp fibre-based temperature-controlled packaging with up to 36-hour cooling capability and lower CO₂ footprint.
- December 2024: NX Group partnered with Tive to deliver real-time monitoring for semiconductor and life-science cargo.
- November 2024: Globe Tracker rolled out Dry360, an unpowered asset tracker offering 10-year battery life and tamper-proof door sensing.
Table of Contents for Smart Container Industry Report
1. INTRODUCTION
- 1.1Study Assumptions and Market Definition
- 1.2Scope of the Study
2. RESEARCH METHODOLOGY
3. EXECUTIVE SUMMARY
4. MARKET LANDSCAPE
- 4.1Market Overview
- 4.2Market Drivers
- 4.2.1Rapid need for real-time supply-chain visibility
- 4.2.2Expansion of global cold-chain logistics
- 4.2.3Declining IoT hardware and satellite connectivity costs
- 4.2.4Regulatory mandates for cargo traceability and food safety
- 4.2.5Blockchain-based carbon-reporting incentives
- 4.2.6Insurance-premium discounts tied to telematics data
- 4.3Market Restraints
- 4.3.1High retrofitting costs and battery maintenance
- 4.3.2Lack of global interoperability / standards
- 4.3.3Rising cyber-risk and ransomware incidents in shipping
- 4.3.4Eco-regulations banning non-recyclable sensor housings
- 4.4Value Chain Analysis
- 4.5Regulatory Landscape
- 4.6Technological Outlook
- 4.7Porter's Five Forces Analysis
- 4.7.1Bargaining Power of Suppliers
- 4.7.2Bargaining Power of Buyers
- 4.7.3Threat of New Entrants
- 4.7.4Threat of Substitutes
- 4.7.5Intensity of Competitive Rivalry
- 4.8Assessment of the Impact of Macroeconomic Trends on the Market
5. MARKET SIZE AND GROWTH FORECASTS (VALUE)
- 5.1By Connectivity
- 5.1.1GPS
- 5.1.2Cellular-based
- 5.1.3Bluetooth Low Energy (BLE)
- 5.1.4LoRaWAN
- 5.1.5Satellite IoT
- 5.1.6Others
- 5.2By Component
- 5.2.1Hardware
- 5.2.2Software
- 5.2.3Services
- 5.3By Container Type
- 5.3.1Dry Containers
- 5.3.2Refrigerated (Reefer) Containers
- 5.3.3Tank Containers
- 5.3.4Special-Purpose
- 5.4By Industry Vertical
- 5.4.1Logistics and Transportation
- 5.4.2Food and Beverages
- 5.4.3Pharmaceuticals and Healthcare
- 5.4.4Retail and E-commerce
- 5.4.5Chemicals
- 5.4.6Manufacturing and Industrial
- 5.4.7Other Verticals
- 5.5By Geography
- 5.5.1North America
- 5.5.1.1United States
- 5.5.1.2Canada
- 5.5.1.3Mexico
- 5.5.2Europe
- 5.5.2.1Germany
- 5.5.2.2United Kingdom
- 5.5.2.3France
- 5.5.2.4Italy
- 5.5.2.5Spain
- 5.5.2.6Rest of Europe
- 5.5.3Asia-Pacific
- 5.5.3.1China
- 5.5.3.2Japan
- 5.5.3.3India
- 5.5.3.4South Korea
- 5.5.3.5Australia
- 5.5.3.6Rest of Asia-Pacific
- 5.5.4South America
- 5.5.4.1Brazil
- 5.5.4.2Argentina
- 5.5.4.3Rest of South America
- 5.5.5Middle East and Africa
- 5.5.5.1Middle East
- 5.5.5.1.1Saudi Arabia
- 5.5.5.1.2United Arab Emirates
- 5.5.5.1.3Turkey
- 5.5.5.1.4Rest of Middle East
- 5.5.5.2Africa
- 5.5.5.2.1South Africa
- 5.5.5.2.2Egypt
- 5.5.5.2.3Nigeria
- 5.5.5.2.4Rest of Africa
6. COMPETITIVE LANDSCAPE
- 6.1Market Concentration
- 6.2Strategic Moves
- 6.3Market Share Analysis
- 6.4Company Profiles (includes Global level Overview, Market level overview, Core Segments, Financials as available, Strategic Information, Market Rank/Share for key companies, Products and Services, and Recent Developments)
- 6.4.1ORBCOMM Inc.
- 6.4.2Traxens SA
- 6.4.3Globe Tracker ApS
- 6.4.4Nexxiot AG
- 6.4.5Phillips Connect Technologies LLC
- 6.4.6Ambrosus Technologies GmbH
- 6.4.7Smart Containers Group AG
- 6.4.8ZillionSource Technologies Co., Ltd.
- 6.4.9Loginno Logistic Innovation Ltd.
- 6.4.10SensorTransport Inc.
- 6.4.11A.P. Moller-Maersk A/S
- 6.4.12Hapag-Lloyd AG
- 6.4.13CMA CGM SA
- 6.4.14SkyCell AG
- 6.4.15SeaCube Container Leasing LLC
- 6.4.16DeltaTrak Inc.
- 6.4.17Tive Inc.
- 6.4.18Sensitech Inc.
- 6.4.19Arviem AG
- 6.4.20CalAmp Corp.
- 6.4.21Containerchain Pte Ltd.
7. MARKET OPPORTUNITIES AND FUTURE OUTLOOK
- 7.1White-space and Unmet-Need Assessment
Global Smart Container Market Report Scope
The smart container market refers to the industry focused on containers equipped with advanced technologies such as IoT, GPS, and sensors for real-time monitoring and data transmission. These containers are used to track and manage cargo conditions, improving efficiency, security, and visibility in supply chains. The market includes applications across various sectors like logistics, healthcare, and food transportation.
The Smart Container Market is segmented by connectivity (GPS, cellular-based, Bluetooth low energy (BLE), LoRaWAN, and other technologies), component (hardware, software, services), industry vertical (logistics and transportation, healthcare, food and beverages, retail and e-commerce, manufacturing, and other industry verticals), and geography (North America, Europe, Asia Pacific, Latin America, Middle East, and Africa).The market sizes and forecasts are provided in terms of value (USD) for all the above segments.