
Technology, Media and Telecom
5th MayPricing Strategy for Semiconductor Components
3 Min Read
Indonesia Data Center Networking Market Report Segments the Industry Into Components (By Product, by Services), End-Users (IT & Telecommunication, BFSI, Other End-Users). Data-Center Type(Colocation, Hyperscalers/Cloud Service Providers, and More). And Bandwidth( ≤10 GbE, 25–40 GbE, and More). The Market Forecasts are Provided in Terms of Value (USD).
Market Overview
| Study Period | 2020 - 2031 |
|---|---|
| Base Year For Estimation | 2025 |
| Forecast Data Period | 2026 - 2031 |
| Market Size (2026) | USD 456.76 Million |
| Market Size (2031) | USD 961.14 Million |
| Growth Rate (2026 - 2031) | 16.07 % CAGR |
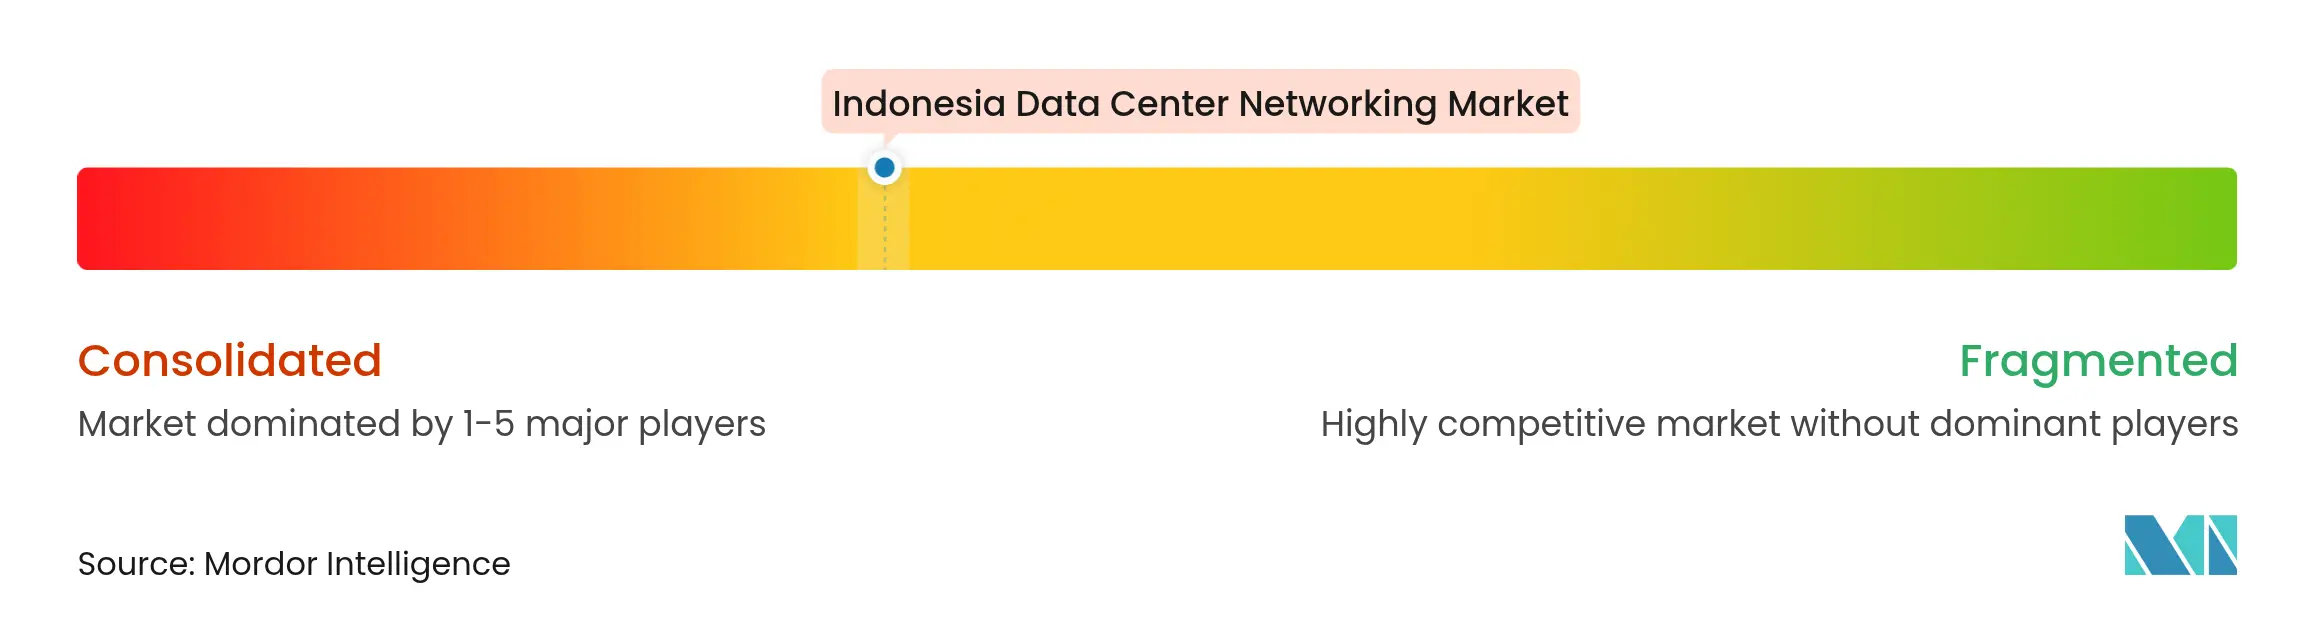
| Market Concentration | Medium |
Major Players *Disclaimer: Major Players sorted in no particular order. Image © Mordor Intelligence. Reuse requires attribution under CC BY 4.0. |
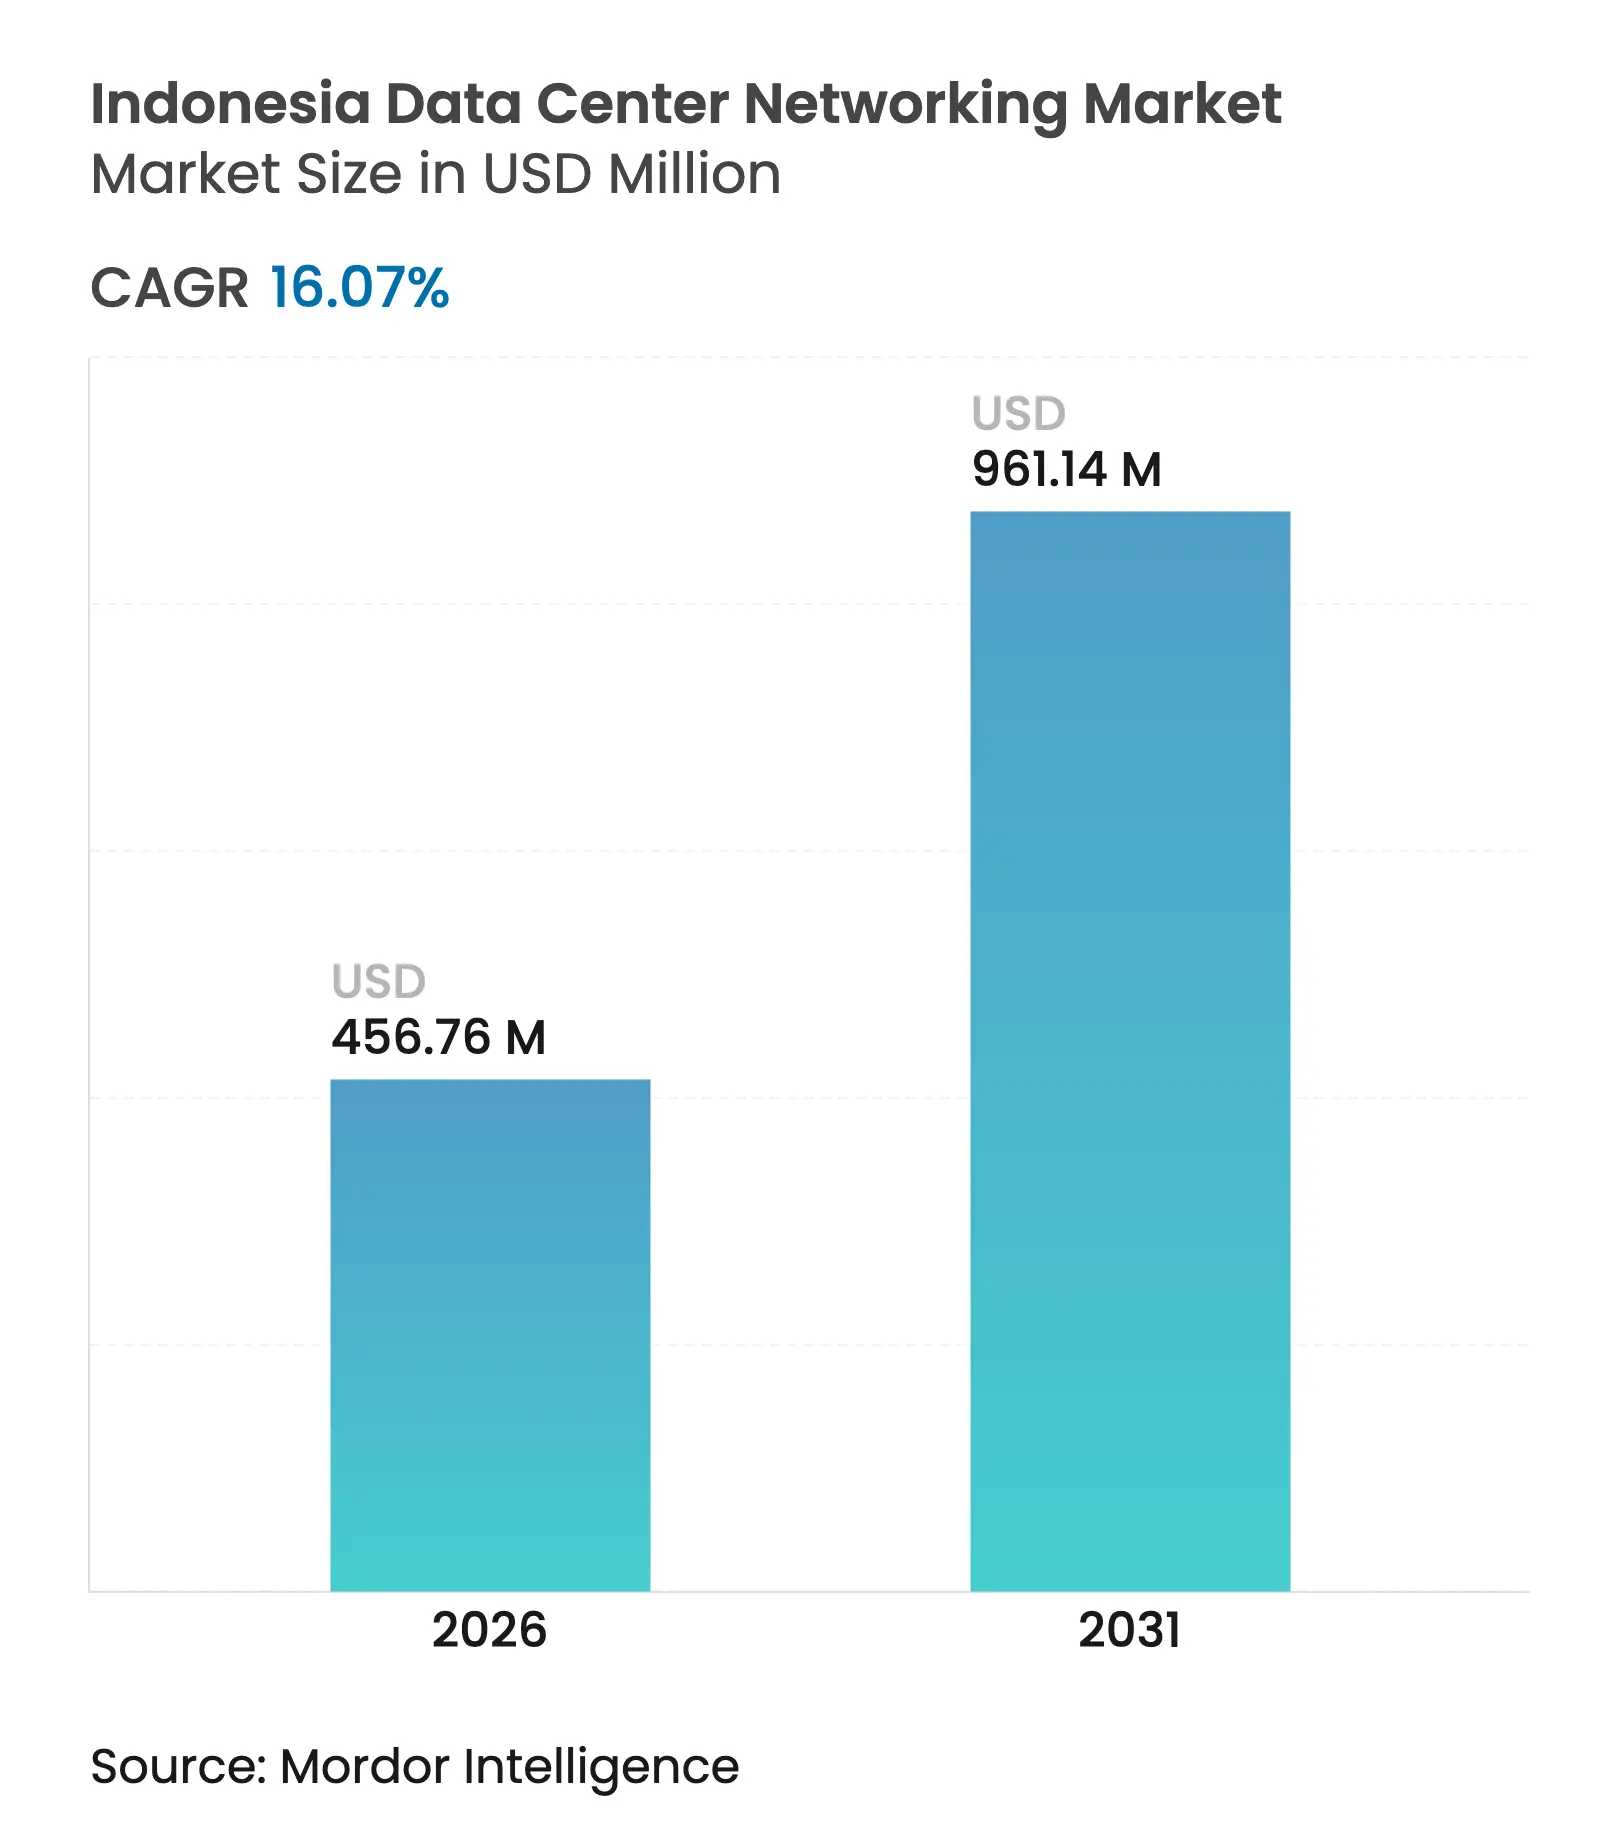
The Indonesia data center networking market size was valued at USD 393.53 million in 2025 and estimated to grow from USD 456.76 million in 2026 to reach USD 961.14 million by 2031, at a CAGR of 16.07% during the forecast period (2026-2031). Hyperscale cloud commitments, mandatory GR71 data-localization rules, and rapid traffic growth from domestic fintech and e-commerce platforms anchor this expansion. Accelerating deployment of GPU clusters for sovereign AI initiatives is shifting bandwidth demand toward >100 GbE ports, while subsea cable upgrades along the Jakarta–Batam corridor promise latency reductions that strengthen Indonesia’s regional hub ambitions. However, elevated import duties on ≥25 GbE hardware and shortages of certified design talent continue to inflate project costs and slow roll-outs.
Key Report Takeaways
Note: Market size and forecast figures in this report are generated using Mordor Intelligence's proprietary estimation framework, updated with the latest available data and insights as of 2026.
Drivers Impact Analysis
| Driver | (~) % Impact on CAGR Forecast | Geographic Relevance | Impact Timeline | |||
|---|---|---|---|---|---|---|
Rapid hyperscale builds by global cloud and OTT
players
Rapid hyperscale builds by global cloud and OTT
players
| +3.2% | Jakarta, Batam, Surabaya | Medium term (2-4 years) | (~) % Impact on CAGR Forecast:
+3.2%
|
Geographic Relevance
:
Jakarta, Batam, Surabaya
|
Impact Timeline
:
Medium term (2-4 years)
|
Domestic fintech and e-commerce traffic explosion
Domestic fintech and e-commerce traffic explosion
| +2.8% | National, concentrated in Java | Short term (≤ 2 years) | |||
Jakarta-Batam subsea cable expansions lowering
latency
Jakarta-Batam subsea cable expansions lowering
latency
| +1.9% | Jakarta-Batam corridor | Long term (≥ 4 years) | |||
Mandatory government data-localisation regulation
(GR71)
Mandatory government data-localisation regulation
(GR71)
| +2.1% | National | Medium term (2-4 years) | |||
Emergence of AI-ready GPU clusters in colocation DCs
Emergence of AI-ready GPU clusters in colocation DCs
| +2.5% | Jakarta, Surabaya | Medium term (2-4 years) | |||
Green-energy PPAs unlocking extra power quotas
Green-energy PPAs unlocking extra power quotas
| +1.7% | Java, Bali, select outer islands | Long term (≥ 4 years) | |||
| Source: Mordor Intelligence | ||||||
Rapid hyperscale builds by global cloud and OTT players
Microsoft opened its first Indonesian cloud region in May 2025, backed by a USD 1.7 billion allocation that underpins new demand for non-blocking 100 GbE fabrics, while Tencent’s USD 500 million initiative and Digital Realty’s local joint venture are reinforcing the early-mover race for land, power, and talent. These projects prompt immediate orders for modular spine–leaf architectures that scale line-rate throughput, yet their concentration in Greater Jakarta raises resilience concerns in seismic events
Domestic fintech and e-commerce traffic explosion
Real-time QR payment transactions tripled to IDR 98.5 trillion (USD 6.5 billion) in 2024, pushing fintech platforms to adopt software-defined networking that allocates bandwidth dynamically in response to unpredictable payment peaks. E-commerce leaders Tokopedia and Shopee are adding live-stream retail features, intensifying east–west traffic inside data centers and boosting uptake of intent-based networking that can maintain sub-millisecond response times.[1] International Trade Administration, “Indonesia – FinTech and Digital Economy,” trade.gov
Jakarta-Batam subsea cable expansions lowering latency
The INSICA system, due in Q4 2026 with 24 fiber pairs each rated at 20 Tbps, is set to cut round-trip delays to Singapore below 10 ms and will encourage financial-trading and gaming workloads currently hosted abroad to repatriate. Networking suppliers with timing-sensitive switch lines and data center interconnect transponders are positioned to benefit as Batam evolves into Indonesia’s de-facto international gateway
Mandatory government data-localization regulation (GR71)
GR71 obliges Electronic System Operators to retain traffic and mirror backups domestically, turning colocation providers into default partners for global SaaS entrants. The policy lifts near-term orders for in-country network fabrics, although it also requires continuous audit logging that stresses management planes and increases demand for network visibility tools.[2]Kementerian Komunikasi dan Informatika, “Peluncuran Wilayah Cloud Microsoft,” kominfo.go.id
Restraints Impact Analysis
| Restraint | (~) % Impact on CAGR Forecast | Geographic Relevance | Impact Timeline | |||
|---|---|---|---|---|---|---|
Chronic 150+ ms up-country fibre latency
Chronic 150+ ms up-country fibre latency
| -1.8% | Outer islands, rural Java | Medium term (2-4 years) | (~) % Impact on CAGR Forecast:
-1.8%
|
Geographic Relevance
:
Outer islands, rural Java
|
Impact Timeline
:
Medium term (2-4 years)
|
Import duties on ≥25 GbE switching hardware
Import duties on ≥25 GbE switching hardware
| -2.1% | National | Short term (≤ 2 years) | |||
Limited Tier-III+ power redundancy outside Java
Limited Tier-III+ power redundancy outside Java
| -1.5% | Sumatra, Kalimantan, Sulawesi | Long term (≥ 4 years) | |||
Persistent shortage of CCIE-level professionals
Persistent shortage of CCIE-level professionals
| -1.9% | National, acute in Jakarta | Medium term (2-4 years) | |||
| Source: Mordor Intelligence | ||||||
Import duties on ≥ 25 GbE switching hardware
Local-content rules set at 40% for base stations and rising to 70% for digital products inflate landed costs for high-speed ASIC-based switches that cannot yet be fabricated domestically. Operators are stockpiling gear ahead of new projects, creating artificial demand spikes that complicate capacity planning and widen Indonesia’s cost gap with neighboring hubs.[3]Telecommunications Industry Association, “Indonesia Local Content Regulations,” tiaonline.org
Persistent shortage of CCIE-level professionals
Only a small pool of engineers holds advanced data-center certifications, forcing operators to hire expatriate consultants or defer automation projects. Wage inflation combined with limited training capacity is adding operational expense and slowing the migration toward intent-based networking architectures
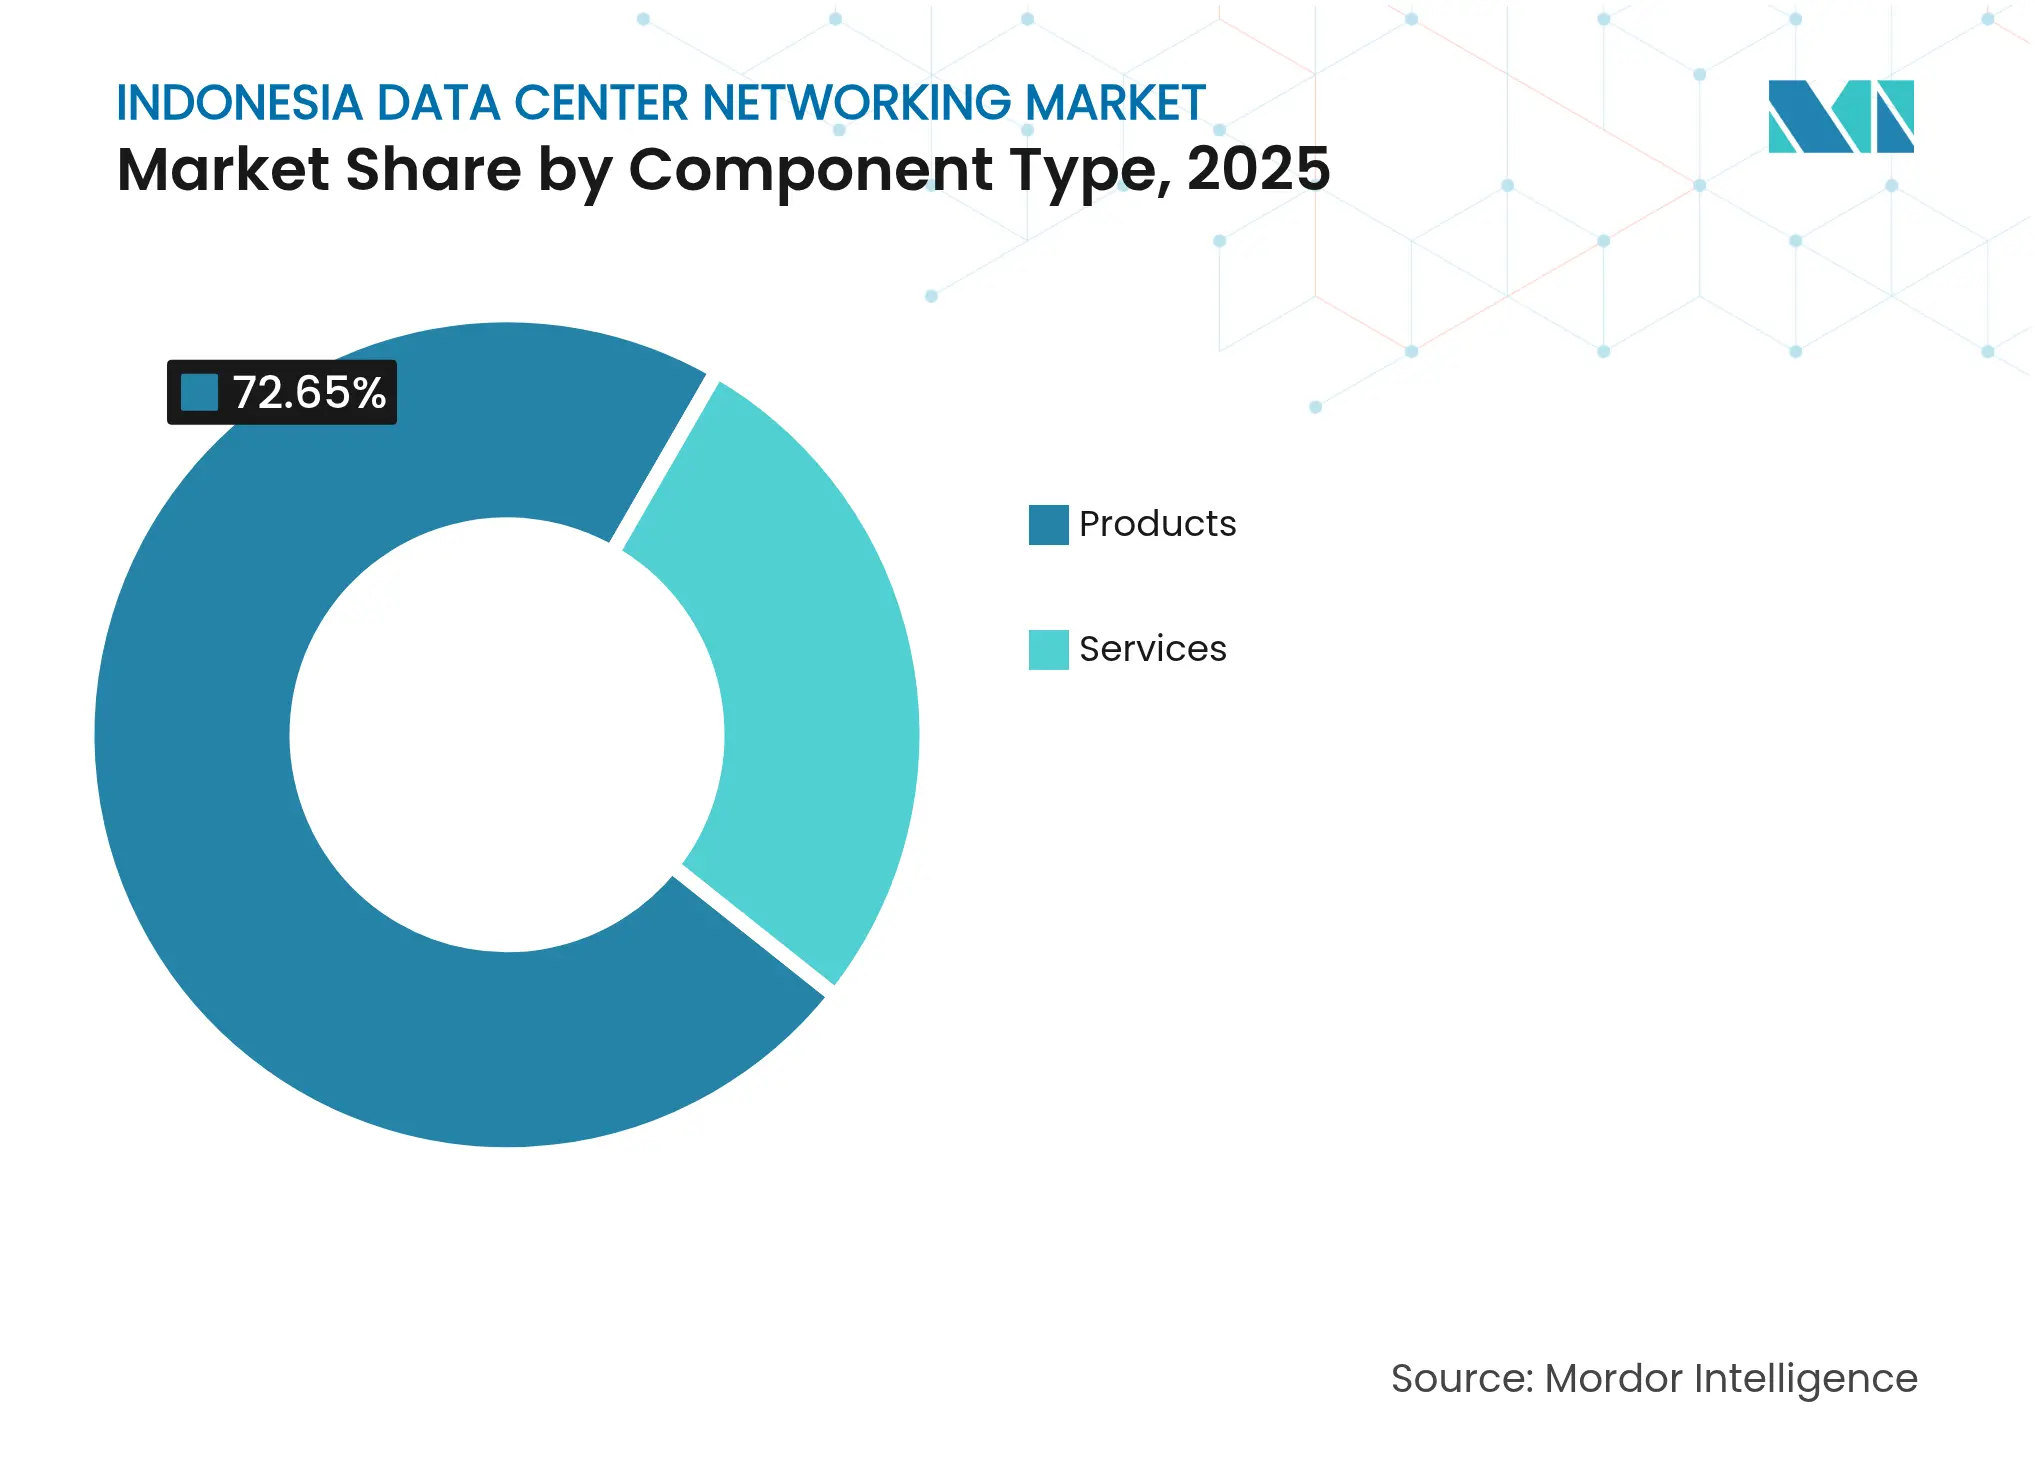
By Component: Services surge amid AI complexity
Services revenue is climbing at an 18.15% CAGR as hyperscalers and enterprises outsource design, integration, and lifecycle-management tasks that support sovereign AI clusters and stringent GR71 audits. Managed network offerings priced on consumption terms convert what was once capex into predictable opex, helping end users scale without retaining scarce CCIE talent. The Indonesia data center networking market size for Services is projected to reach USD —insert value from full report— by 2031, underscoring the structural pivot toward expertise-led contracts. Support teams are progressively embedding AI-driven fault isolation that predicts congestion hot spots minutes before packet loss occurs.
Training and consulting providers capture rising margins because RoCE-v2, InfiniBand, and CXL topologies fall outside conventional curricula. Vendors that package white-glove installation with intent-based orchestration secure renewal stickiness, while local system integrators gain leverage by bundling compliance documentation with post-deployment SLAs. Combined, these shifts reduce time-to-production for hyperscale pods and sustain the Indonesia data center networking market at double-digit velocity.
Note: Segment shares of all individual segments available upon report purchase
By End-User: Government & Defense drives fastest expansion
Government-funded digital-governance workloads are scaling at 18.95% CAGR on the back of national smart-city rollouts that require secure spine–leaf fabrics linking CCTV analytics, IoT sensors, and citizen-services portals. The Indonesia data center networking market size for public-sector projects will therefore outpace commercial segments through 2031. BFSI follows closely as zero-trust mandates boost micro-segmentation and real-time encryption demand.
Media and Entertainment players upgrade to 100 GbE links to satisfy 4K streaming and esports broadcast, while Healthcare digitization programs adopt multilayer segmentation to protect patient data. Manufacturing pilots of Industrial 4.0 elevate edge-gateway requirements that unify IP and OT traffic. A diversified customer mix shelters vendors from cyclical swings, yet it introduces heterogenous protocol stacks that intensify design complexity within the Indonesia data center networking market.
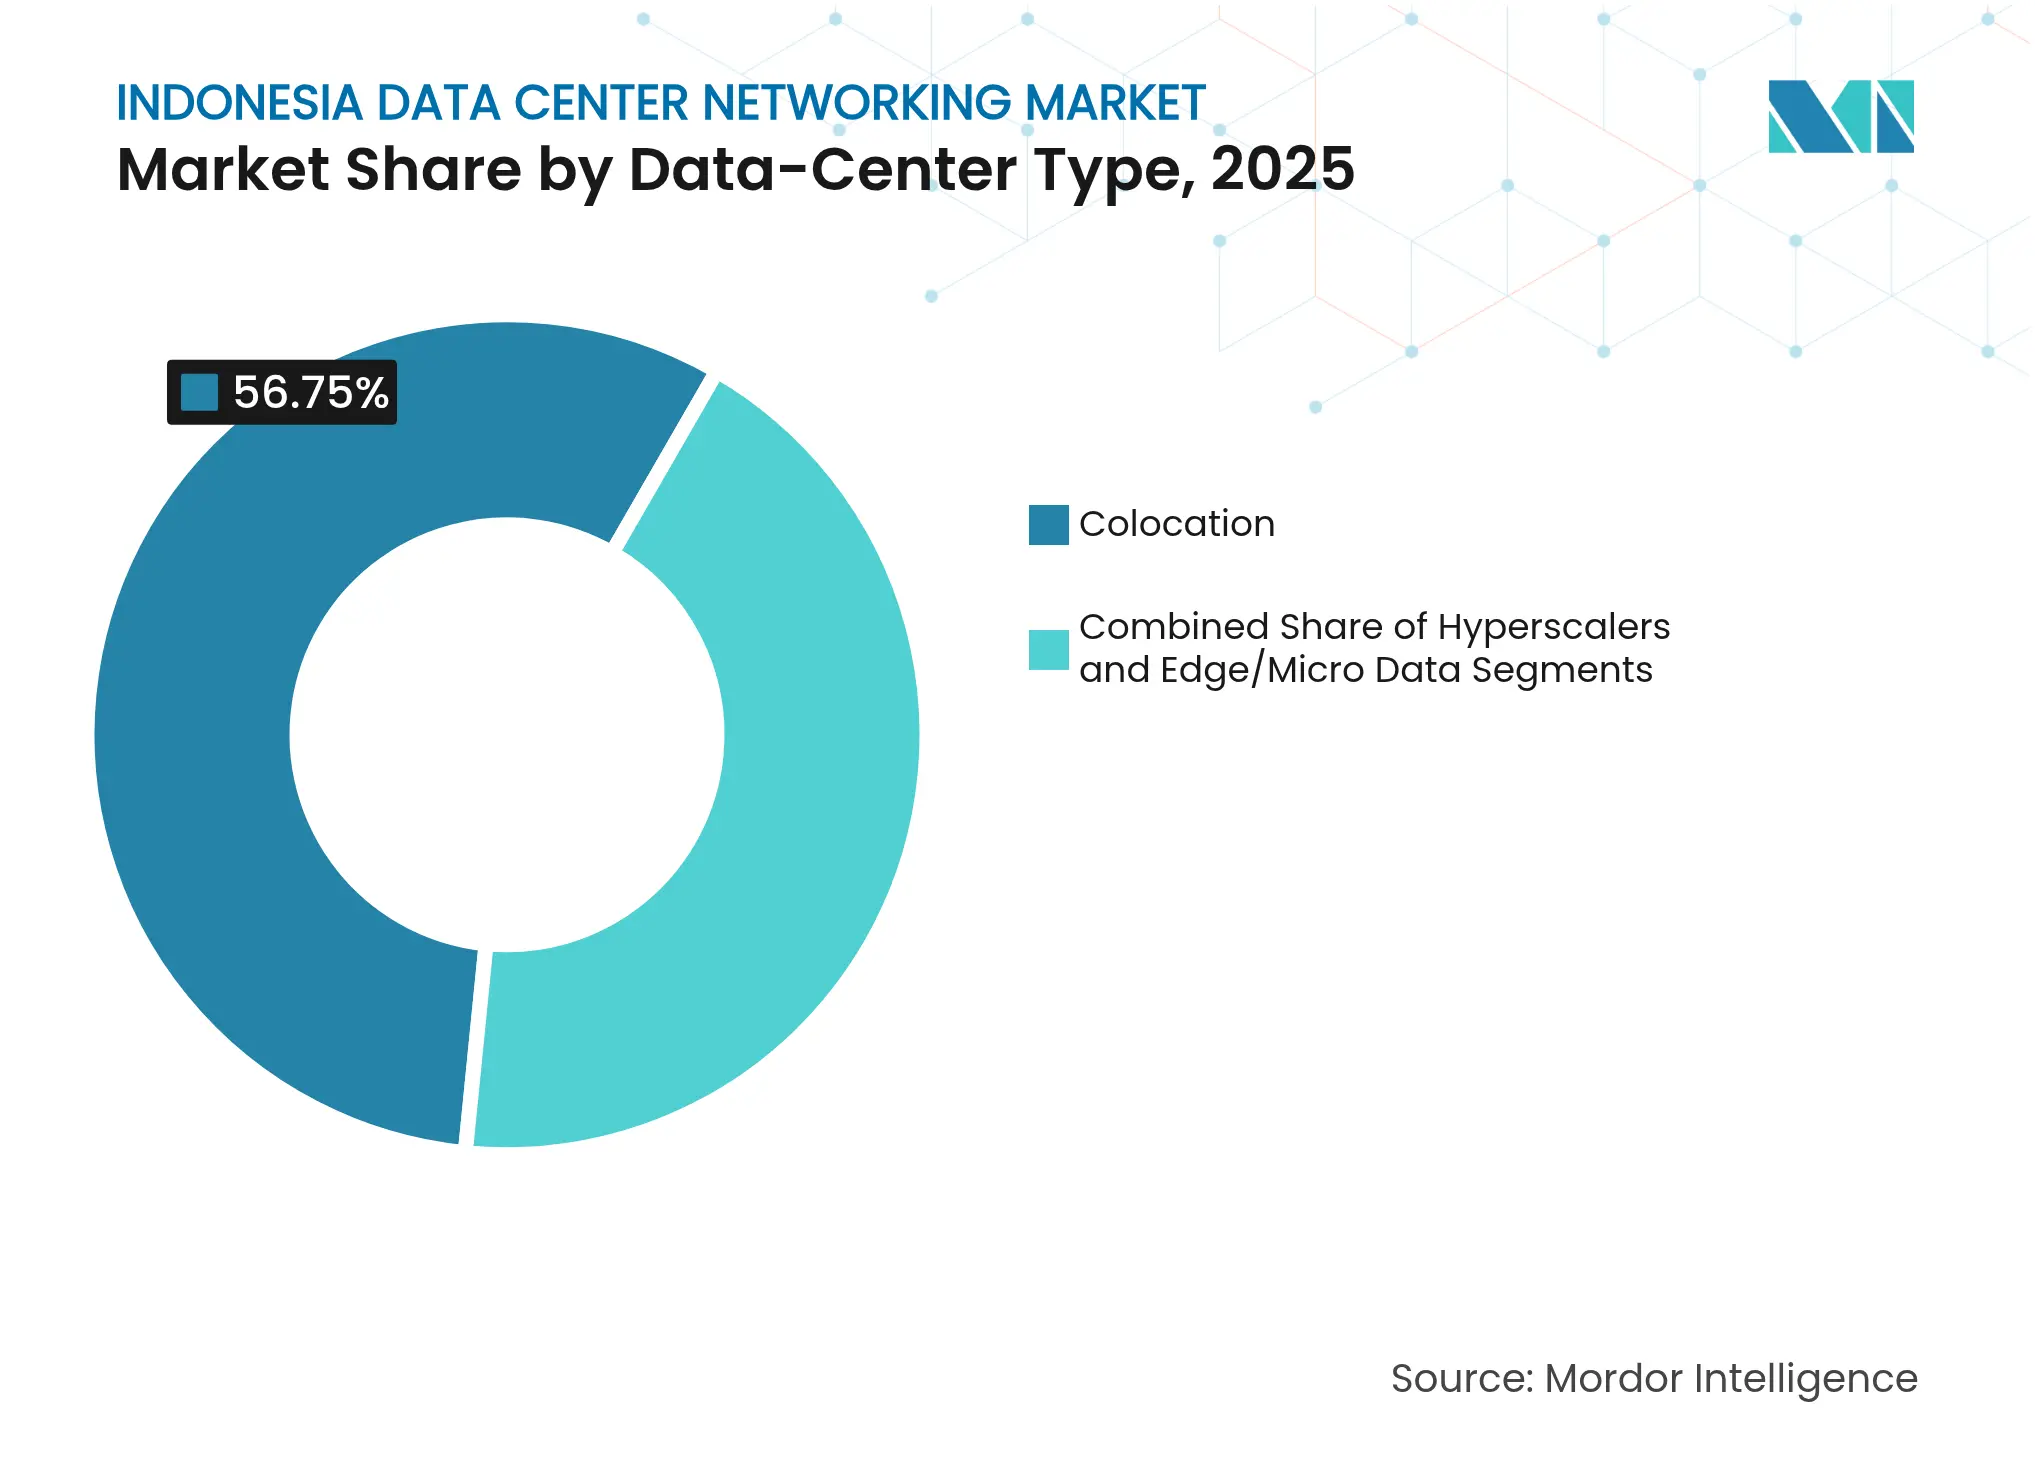
By Data-Center Type: Hyperscalers reshape infrastructure paradigms
Hyperscaler footprints will post a 20.45% CAGR, narrowing the gap with colocation leaders that held 56.75% revenue in 2025. Dedicated facilities from Microsoft, Tencent, and BDx deploy non-blocking fabrics running 400 GbE and 800 GbE optics to minimize GPU idle time during AI model training. In monetary terms, the Indonesia data center networking market size attributed to hyperscalers is forecast to more than triple between 2026 and 2031.
Colocation providers counter by pre-installing spine–leaf bundles and automated patching to offer “hyperscale-ready” halls, yet many still depend on cross-connect fees that hyperscalers prefer to avoid. Edge and micro-data-center operators install compact, high-temperature-rated switches that tolerate regional power volatility, creating niche demand for ruggedized optics across remote islands.
Note: Segment shares of all individual segments available upon report purchase
By Bandwidth: Less than or equals to 100 GbE acceleration reflects AI demands
Ports above 100 GbE will see 19.85% CAGR as sovereign AI clusters standardize on 400 GbE and 800 GbE interconnects. The Less than or equals to 10 GbE tier remains vital for telco edge and branch colocation cabins, while 25–40 GbE persists as a value option for traditional enterprise workloads. Together, greater than 100 GbE shipments will account for a rising slice of the Indonesian data center networking market size for bandwidth, spurring adoption of silicon photonics and co-packaged optics that curb power draw.
Cisco’s 1.6 Tbps DSP silicon roadmap and Broadcom’s 51 T switch-on-chip pipeline reaffirm the long-term relevance of ultra-high-speed links. Vendors additionally refine network-on-demand licensing that lets operators unlock higher port speeds via software keys, preserving capex while matching throughput to live AI training phases.
The Greater Jakarta cluster hosts the majority of hyperscale builds and already commands the largest contribution to Indonesia data center networking market revenue. Its proximity to the Indonesia–Singapore subsea cable routes, reliable utility grids, and skilled labor pools help justify Microsoft’s USD 1.7 billion cloud region and Tencent’s USD 500 million campus. Consequently, procurement of high-density switches and coherent optics concentrates around Jakarta facilities, reinforcing capital formation within Java.
Batam’s designation as a Special Economic Zone and the arrival of the INSICA cable in 2026 will elevate Batam–Bintan-Karimun into an international gateway. Investors have earmarked USD 3 billion for new halls that will need time-synchronized transport gear for sub-10 ms connectivity to Singapore. This positioning turns Batam into a complementary fail-over node for Jakarta and diversifies risk across the Indonesia data center networking market.
Secondary hubs such as Surabaya, Bandung, and Medan attract public-sector and telco-edge workloads linked to the “100 Smart Cities” roadmap. NVIDIA’s USD 200 million AI center in Surakarta shows that GPU clusters are beginning to decentralize beyond the capital. Outer islands including Sumatra, Kalimantan, and Sulawesi represent long-run potential once fiber latency drops and renewable-energy microgrids mature, but present deployments rely mostly on satellite backhaul and basic terrestrial circuits. Over time, green-energy PPAs tied to the JETP program are expected to stimulate edge-friendly equipment demand across these provinces, broadening the reach of the Indonesia data center networking market.
Market Concentration
Global incumbents such as Cisco, Huawei, and Juniper continue to split the lion’s share of switch revenue, yet import levies and local-content thresholds open space for regional integrators able to assemble or certify gear locally. Technology differentiation now pivots on AI-enabled network operations, with Cisco integrating Splunk telemetry into its Nexus fabrics and rolling out Hypershield to combine security analytics and traffic engineering. Huawei positions its CloudFabric solution with built-in telemetry and lossless fabrics for RoCE, while Juniper pushes Apstra intent-based automation to compress provisioning cycles.
Partnership strategies dominate market entry. Digital Realty joined forces with Bersama Digital Infrastructure Asia to satisfy local ownership rules, whereas Nokia collaborates with Indosat Ooredoo Hutchison to widen 4G and 5G backhaul that feeds future edge sites. BDx leverages NVIDIA reference designs to differentiate on AI-ready networking and draws renewable-energy credits to appeal to hyperscalers seeking carbon-neutral expansion.
Start-ups offering cloud-native overlays or DPU-accelerated fabrics present early-stage competition but face procurement inertia as Indonesian buyers favor vendors with 24×7 onsite spares and multilingual support desks. Consequently, the Indonesia data center networking market maintains moderate fragmentation where the top five players hold near-65% combined share, leaving room for niche specialists in optical interconnect and network-as-a-service models.

*Disclaimer: Major Players sorted in no particular order
1. INTRODUCTION
2. RESEARCH METHODOLOGY
3. EXECUTIVE SUMMARY
4. MARKET LANDSCAPE
5. MARKET SIZE and GROWTH FORECASTS (VALUE)
6. COMPETITIVE LANDSCAPE
7. MARKET OPPORTUNITIES and FUTURE OUTLOOK
Market Definitions and Key Coverage
Our study defines the Indonesian data center networking market as the yearly spending on switches, routers, optical interconnects, network-operating software, and associated integration or maintenance services deployed inside colocation, hyperscale, edge, and self-built enterprise facilities across the archipelago.
Scope exclusion: The estimate leaves out servers, storage, power and cooling gear, and external telecom backbone links, so buyers know exactly what the baseline covers.
Segmentation Overview
Detailed Research Methodology and Data Validation
Primary Research
Conversations with Jakarta and Batam colocation CTOs, network architects at cloud-region builds, distributors, and consulting engineers help us verify installation costs, port mixes, and pipeline capacity, bridging gaps that desk work alone cannot close.
Desk Research
We start by mining open data from Statistics Indonesia, Kominfo spectrum releases, the Indonesian Internet Service Provider Association traffic census, DG Customs HS-8517 import files, and submarine-cable landing permits. We then layer insights from IEEE Xplore papers and respected regional press. Company filings accessed through D&B Hoovers, along with news sweeps on Dow Jones Factiva, let us benchmark capital outlays and shipment patterns against hardware trade flows. Numerous other public sources enrich the evidence base.
Next, our analysts reconcile conflicting figures, flag anomalies, and archive every reference so results remain reproducible. This list illustrates, not exhausts, the secondary inputs consulted.
Market-Sizing & Forecasting
A top-down construct converts installed white space (MW) and ports-per-rack into hardware volumes, multiplies them with blended 10/25/40/100 GbE ASPs, and adds validated service ratios. Selective bottom-up checks using vendor shipment samples and channel checks fine-tune totals. Key variables like hyperscale capex plans, mobile data traffic, subsea bandwidth additions, 100 GbE penetration, and average rack density feed a multivariate regression that projects demand to 2030. Where bottom-up clues fall short, gaps are transparently noted and capped.
Data Validation & Update Cycle
Before sign-off, two senior reviewers run outlier tests, benchmark outputs against independent indicators such as import value trends and certified rack counts, and rerun the model if variance tops three percentage points. Mordor refreshes every dataset annually and pushes interim tweaks after material events so clients receive the latest view.
Why Mordor's Indonesia Data Center Networking Baseline Commands Reliability
Benchmark comparison
Published estimates often diverge because firms choose different hardware baskets, currency treatments, and refresh cadences, and because some rely on desktop research alone while others fold servers or storage into networking totals.
Key gap drivers here include rival studies merging network, server, and storage spend, older traffic baselines that ignore the post-pandemic cloud burst, and limited primary validation that overlooks new Jakarta-Batam capacity corridors. Some peers also roll forward historic ASP curves without checking current import duties, which inflates totals.
| Market Size | Anonymized source | Primary gap driver | ||
|---|---|---|---|---|
USD 393.53 million, 2025 | Mordor Intelligence | - | Anonymized source:Mordor Intelligence | Primary gap driver:- |
USD 1.34 billion, 2024 | Global Consultancy A | Folds storage and security appliances into networking basket | ||
USD 282.5 million, 2024 | Regional Consultancy B | Uses pre-2022 traffic baseline and no primary interviews |
Pricing Strategy for Semiconductor Components
3 Min Read
Accelerating Additive Manufacturing Adoption in India
3 Min Read
Unlocking Saudi Arabia’s Regional Tourism Growth Potential
5 Min Read
When decisions matter, industry leaders turn to our analysts. Let’s talk.