
Indium Phosphide Wafer Market Size and Share
Market Overview
| Study Period | 2020 - 2031 |
|---|---|
| Market Size (2026) | USD 221.42 Million |
| Market Size (2031) | USD 385.65 Million |
| Growth Rate (2026 - 2031) | 11.73 % |
| Fastest Growing Market | Asia-Pacific |
| Largest Market | Asia-Pacific |
| Market Concentration | Medium |
Major Players *Disclaimer: Major Players sorted in no particular order Image © Mordor Intelligence. Reuse requires attribution under CC BY 4.0. | |
Indium Phosphide Wafer Market Analysis by Mordor Intelligence
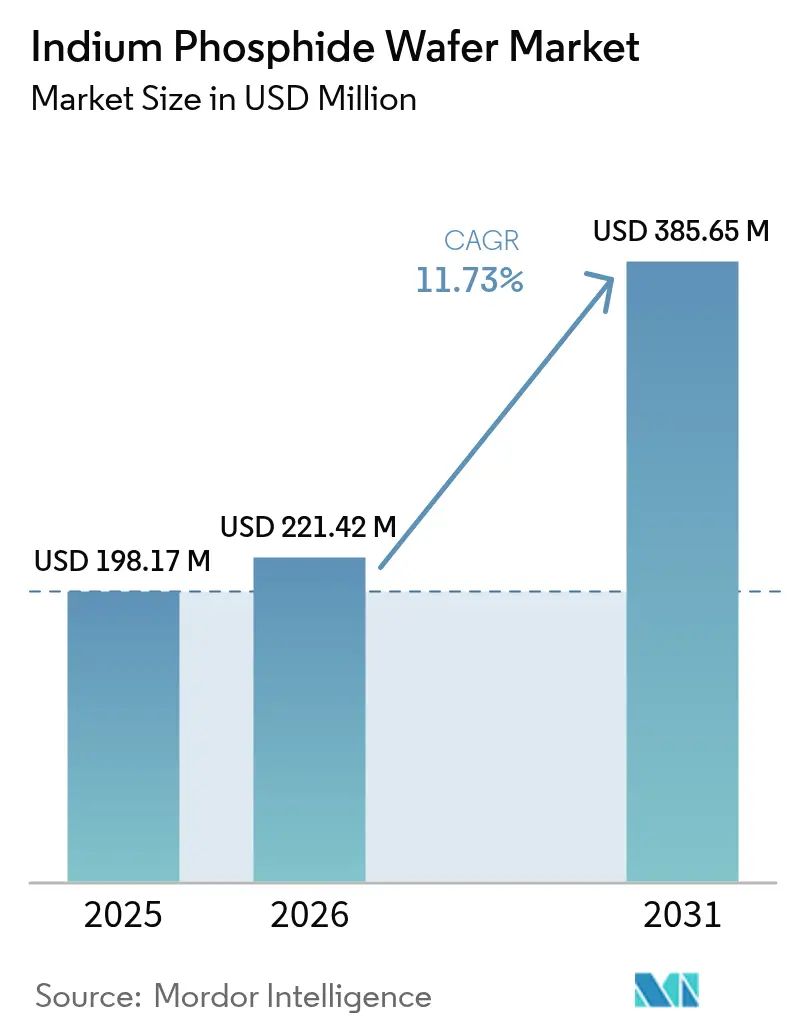
The indium phosphide wafer market size is expected to grow from USD 198.17 million in 2025 to USD 221.42 million in 2026 and is forecast to reach USD 385.65 million by 2031 at 11.73% CAGR over 2026-2031. Hyperscale data-center upgrades drive momentum to 800 G and 1.6 T optics, the global rollout of 5 G and preparation for 6 G backhaul, as well as expanding quantum-photonics funding. Larger-diameter substrates lower unit costs, while hybrid InP-on-Si platforms promise further scalability. Asia-Pacific’s integrated compound-semiconductor ecosystem anchors supply, yet Western re-shoring programs are accelerating domestic capacity. Competitive intensity stays moderate because crystal-growth know-how, long customer qualifications, and high capex deter new entrants.[1]SPIE Europe Ltd., “InP output triples as Coherent sales bounce on AI demand,” Optics.org, optics.org
Key Report Takeaways
- By diameter, 100 mm substrates captured 43.72% of the indium phosphide wafer market share in 2025; substrates measuring 150 mm and above are projected to expand at a 13.15% CAGR through 2031.
- By application, photonics and optical transceivers held 58.92% of the indium phosphide wafer market size in 2025, while quantum and specialty sensing is advancing at a 13.23% CAGR to 2031.
- By manufacturing technology, VGF-grown bulk wafers accounted for 54.98% of the indium phosphide wafer market size in 2025, whereas InP-on-Si hybrids are projected to grow at a 13.46% CAGR through 2031.
- By end-user, telecommunications and datacom led with a 52.25% indium phosphide wafer market share in 2025; consumer electronics and wearables are forecast to grow at a 12.62% CAGR through 2031.
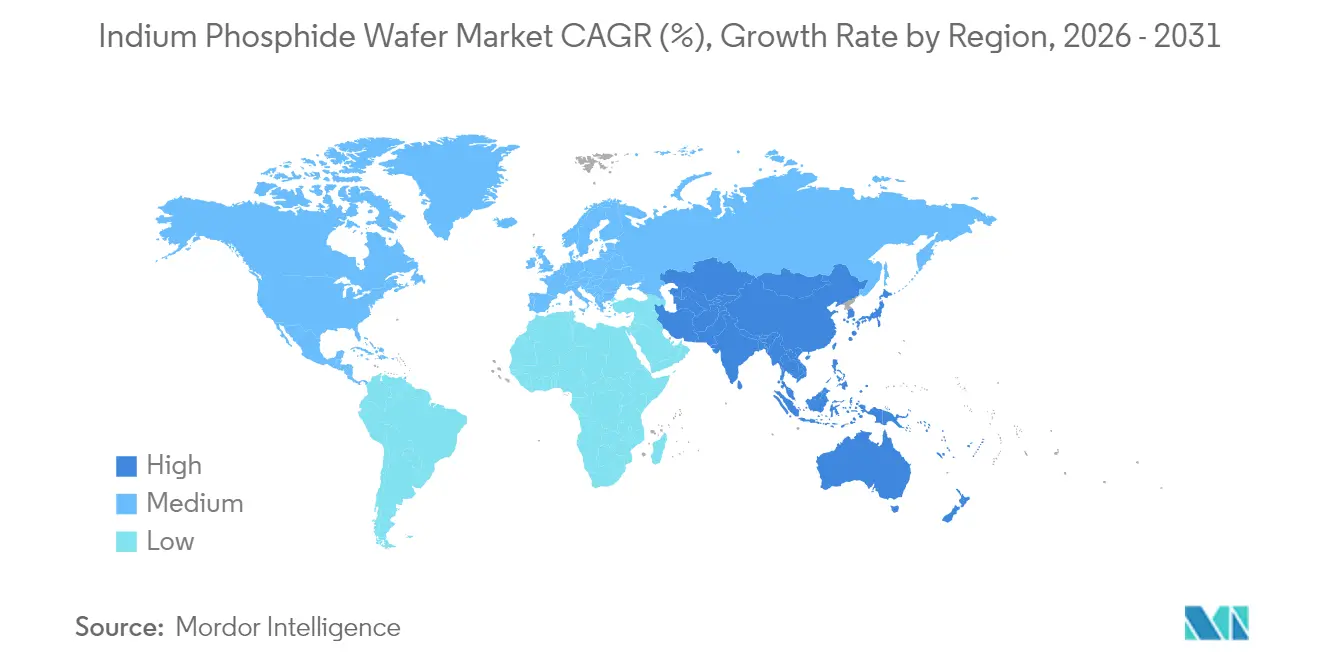
- By geography, Asia-Pacific commanded 41.55% of the indium phosphide wafer market size in 2025 and is tracking a 12.41% CAGR through 2031.
Note: Market size and forecast figures in this report are generated using Mordor Intelligence’s proprietary estimation framework, updated with the latest available data and insights as of 2026.
Market Trends and Insights
Drivers Impact Analysis of Indium Phosphide Wafer Market*
| Driver | (~) % Impact on CAGR Forecast | Geographic Relevance | Impact Timeline |
|---|---|---|---|
| High-speed optical transceiver demand (400G/800G/1.6T) | +3.2% | Global, concentrated in North America and Asia-Pacific | Medium term (2-4 years) |
| 5G and emerging 6G backhaul infrastructure rollout | +2.8% | Global, led by Asia-Pacific and North America | Long term (≥ 4 years) |
| Rising consumer SWIR sensing in smartphones and wearables | +2.1% | Global, driven by Asia-Pacific manufacturing | Medium term (2-4 years) |
| Quantum photonics R&D programs accelerating InP PIC funding | +1.9% | North America and Europe, emerging in Asia-Pacific | Long term (≥ 4 years) |
| Defense IR-imaging re-shoring mandates boosting domestic InP substrates | +1.4% | North America and Europe | Short term (≤ 2 years) |
| Migration to 6-inch InP substrates to leverage idle GaAs 6-inch lines | +1.0% | Global, led by established compound semiconductor regions | Medium term (2-4 years) |
| Source: Mordor Intelligence | |||


High-speed optical-transceiver demand accelerates InP adoption
Cloud operators moving to 800 G and 1.6 T links require edge-emitting lasers and photodiodes that only indium phosphide can provide at the required speeds. Coherent tripled its InP-device output in Q4 2024 and is now sampling 3.2 T transceivers.[2]Coherent, “Investor Presentation,” Coherent.com, coherent.com Source Photonics demonstrated a 1.6 T coherent module using InP-based components, validating the material’s indispensability for co-packaged optics. As switch ASICs advance toward 51T bandwidth, pluggable optics give way to on-board laser engines, reducing substrate volumes for the indium phosphide wafer market.
5G infrastructure rollout drives millimeter-wave demand
Commercial 5G backhaul operates above 28 GHz, where InP HBTs offer a cutoff frequency of more than 450 GHz and a breakdown voltage of more than 4.5 V.[3]Ferdinand-Braun-Institut, “Indiumphosphid-HBT-Prozess,” fbh-berlin.de, fbh-berlin.de Nokia’s USD 2.3 billion purchase of Infinera secures InP coherent expertise for transport nodes. Early 6G testbeds exploring terahertz frequencies rely on InP HEMTs, which have been validated up to 610 GHz. Consequently, substrate demand rises not only for optical front-ends but also for RF chains within the indium phosphide wafer market.[4]Heinz Arnold, “Nokia fertigt photonische ICs dank Aixtron,” Elektroniknet, elektroniknet.de
Rising consumer SWIR sensing broadens addressable base
STMicroelectronics’ quantum-dot SWIR imager targets face authentication and low-light photography, shifting volumes from telecom racks to smartphones. Apple and Samsung are prototyping SWIR-based health monitoring, creating incremental pull for 76.2 mm wafers tailored to small-form-factor die. This move diversifies revenue streams and increases value per wafer due to the complexity of epitaxial stacks, thereby expanding profitability within the indium phosphide wafer market.
Quantum-photonics R&D spurs specialty substrate demand
The EU-funded QPIC1550 project successfully achieved room-temperature operation of InP quantum-dot lasers, thereby reducing the cryogenic overhead required for quantum repeaters. U.S. CHIPS Act grants of USD 33 million to Coherent earmark 150 mm capacity for quantum computing devices. Ultra-low-defect undoped wafers command price premiums, partially insulating suppliers from cyclic telecom spending and underpinning long-term growth for the indium phosphide wafer market.
Restraints Impact Analysis of Indium Phosphide Wafer Market*
| Restraint | (~) % Impact on CAGR Forecast | Geographic Relevance | Impact Timeline |
|---|---|---|---|
| High wafer cost versus Si/GaAs alternatives | -2.1% | Global, most acute in cost-sensitive applications | Short term (≤ 2 years) |
| Supply-chain exposure to Ga-/P-export controls and price volatility | -1.8% | Global, concentrated impact on Western manufacturers | Medium term (2-4 years) |
| Mechanical fragility limiting yields beyond 6-inch wafers | -1.2% | Global, affecting scale economics | Long term (≥ 4 years) |
| Si-photonics hybrid laser platforms reducing pure InP wafer volumes | -0.9% | Global, led by silicon photonics adoption regions | Medium term (2-4 years) |
| Source: Mordor Intelligence | |||
Supply-chain vulnerabilities threaten stability
China’s 2024 expansion of export controls to indium‐bearing compounds elevated price volatility and lead-time uncertainty. Western wafer makers now qualify alternative gallium and phosphorus suppliers, yet achieving raw-material self-sufficiency cannot be done quickly. Coherent’s CHIPS Act project mitigates some risk, but near-term procurement pressure trims margins across the indium phosphide wafer market.
Cost competitiveness limits penetration
Even at 150 mm, InP substrates cost multiple times that of silicon. Smartphone OEMs evaluate SWIR sensors against low-cost CMOS, and auto-LiDAR programs hesitate to adopt InP lasers due to bill-of-materials constraints. Yield loss due to wafer fragility adds further cost, capping volume adoption in mainstream electronics and tempering the CAGR upside for the indium phosphide wafer market.
*Our forecasts treat driver/restraint impacts as directional, not additive. The impact forecasts reflect baseline growth, mix effects, and variable interactions.
Indium Phosphide Wafer Market Segment Analysis
By Diameter:
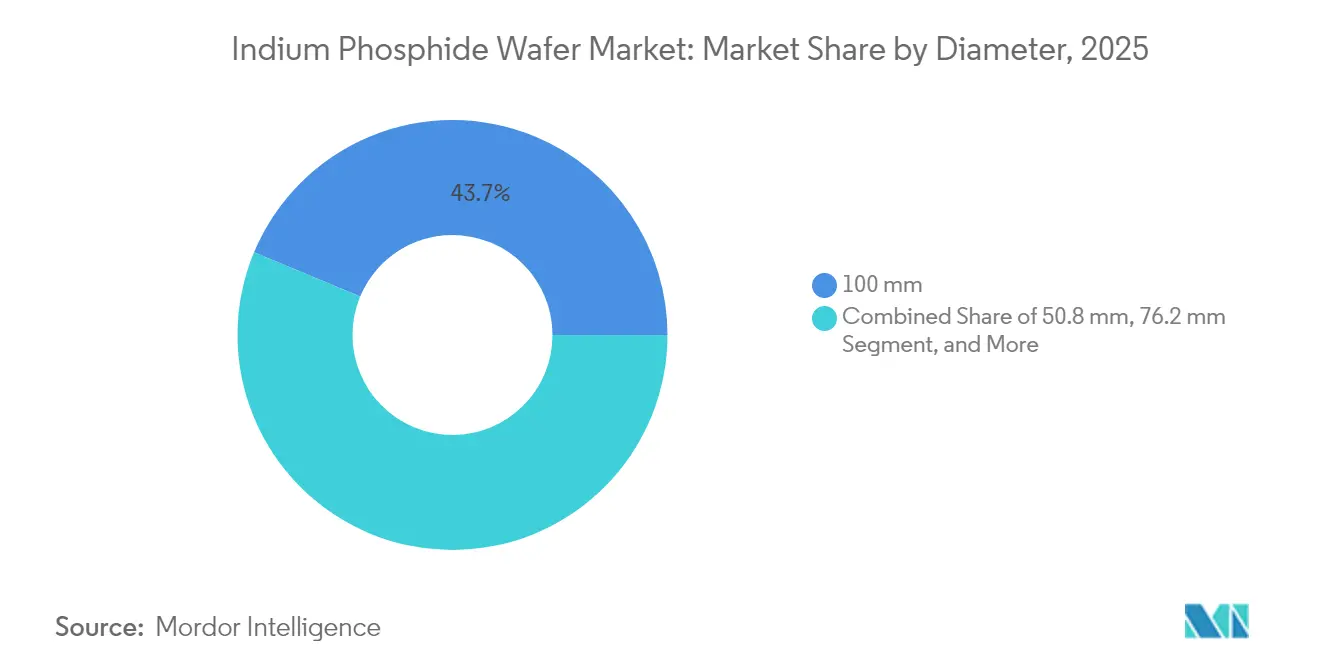
Larger formats lift throughputThe 100 mm class retained a 43.72% indium phosphide wafer market share in 2025, catering to mainstream transceiver lines that strike a balance between cost and yield. A shift toward 150 mm substrates is underway, driven by Nokia’s 6-inch pilot line utilizing AIXTRON G10-AsP reactors. The indium phosphide wafer market size for 150 mm formats is forecasted to grow at a 13.15% CAGR, narrowing the cost gap with GaAs. Yet, mechanical fragility above 6 inches restrains further scale, so 76.2 mm wafers remain relevant for specialty photonics that demand tight thickness uniformity.
Growth in large-diameter output hinges on investment in carriers and edge-grip tools designed for low-modulus crystals. Coherent’s Texas expansion adopts automated handling to reduce breakage, targeting yields of over 85% for prime wafers. Meanwhile, 50.8 mm wafers persist in university R&D, where tooling upgrades are prohibitively expensive. A diverse diameter mix therefore co-exists within the indium phosphide wafer market through 2031.


By Wafer Doping Type:
Isolation requirements spur Fe-doped demandUndoped conductive substrates led with a 36.18% share in 2025, underpinning photonic-integrated-circuit epitaxy. Semi-insulating Fe-doped wafers are projected to post a 12.93% CAGR, accelerating alongside 5G RF-power amplifiers that require substrate isolation for low noise. N-type Sn-doped and P-type Zn-doped slices target HEMT and HBT devices, but their volumes remain niche compared to Fe-doped growth in the indium phosphide wafer market size for RF front-ends.
Terahertz IC research highlights the impact of background dopant levels on gain at 300 GHz. The Ferdinand-Braun-Institut’s HBTs utilized tailored Zn compensation to achieve a frequency of operation (fT) exceeding 450 GHz, underscoring how substrate doping profiles underpin system-level advances. Demand for ultra-pure, undoped wafers rises in quantum-photonics labs, but price elasticity is limited because such wafers can cost three times as much as standard conductive grades.
By Application:
Photonics dominates while quantum sensing acceleratesPhotonics and optical transceivers retained a 58.92% share of the indium phosphide wafer market size in 2025, buoyed by hyperscale datacom upgrades. Co-packaged optics will sustain high volumes as switch OEMs embed laser engines. Quantum and specialty sensing applications, however, grow fastest at 13.23% CAGR, drawing on defense lidar and room-temperature quantum-dot lasers validated under the QPIC1550 program.
RF and millimeter-wave devices are gaining steady momentum from 5G radios, leveraging InP HEMTs that outperform GaAs at frequencies exceeding 110 GHz. Photovoltaics and power conversion remain niche, mainly in space solar arrays needing radiation tolerance. Evolving demand mix does not displace photonics leadership, but rather diversifies revenue sources within the indium phosphide wafer market.
By End-User Industry:
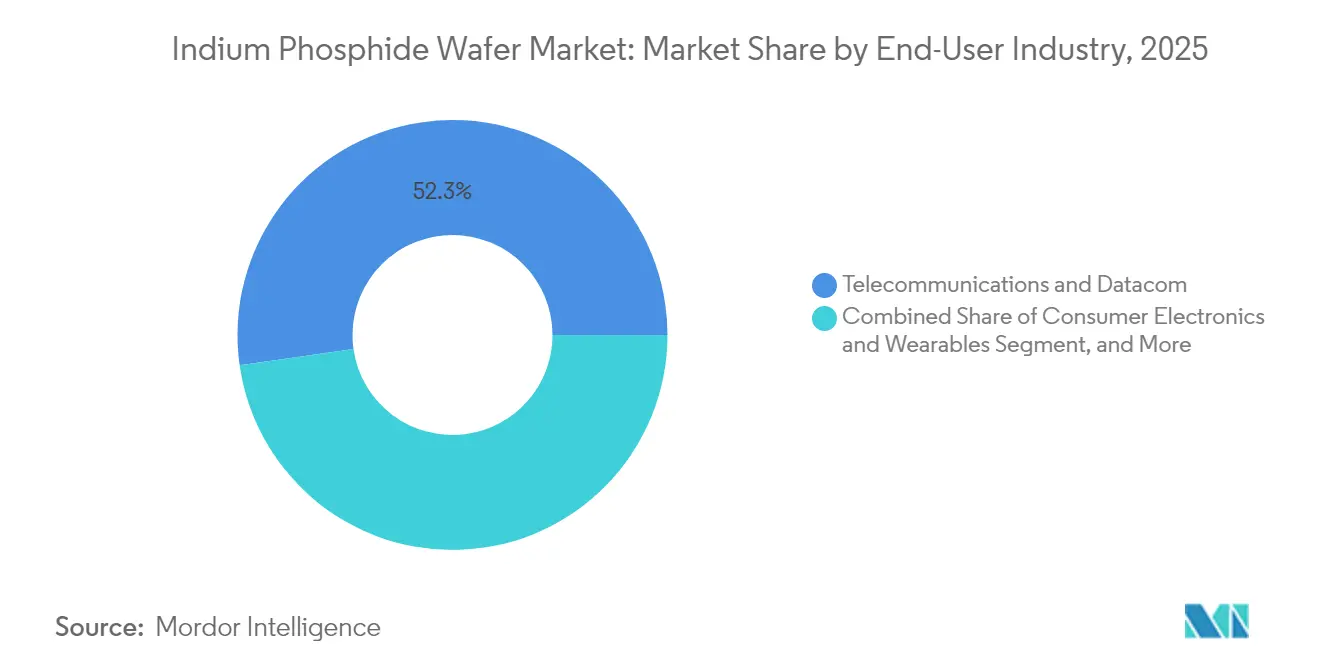
Telecom rules, consumer devices emergeTelecom and datacom carved out 52.25% indium phosphide wafer market share in 2025 as coherent optics permeate metro, long-haul, and pluggable ZR markets. Consumer electronics are expected to register the highest 12.62% CAGR, fueled by biometric SWIR cameras in flagship phones. Aerospace and defense rely on re-shored infrared sensors and quantum-secure links, sustaining mid-single-digit growth.
Automotive adoption lags because lidar cost targets remain tight, yet premium brands pilot SWIR-based cabin monitoring using InP VCSEL arrays. Medical diagnostics utilize spectroscopic imaging, where tissue contrast improves at 1,550 nm, albeit from a relatively small revenue base. Such diversified use cases cap volatility and broaden the appeal of the indium phosphide wafer market.
By Manufacturing Technology:
Bulk VGF leads, hybrids gain groundBulk VGF wafers accounted for 54.98% of revenue in 2025 due to their proven defect density control and high resistivity. InP-on-Si hybrids, though only mid-single-digit share today, are racing ahead at 13.46% CAGR. X-FAB’s micro-transfer-printing platform places InP dies onto 300 mm silicon photonics, tackling cost and scaling hurdles. LEC/tCZ methods cater to specialty orientations, while epi-ready blanks support advanced MOCVD stacks in photonics fabs.
If hybrid yields match bulk VGF within three years, demand for pure InP handles could plateau; yet bulk crystal growth will still underpin epitaxial donor wafers used in the bonding process. Thus, both routes can continue to prosper within the indium phosphide wafer market through 2031.
Geography Analysis
APAC Indium Phosphide Wafer Market
Asia-Pacific retained 41.55% of revenue in 2025 and is projected to grow at a 12.41% CAGR. Japan’s JX Nippon Mining and Metals provides a vertically integrated supply of purified indium and phosphorous feedstock, while Taiwan’s Visual Photonics Epitaxy ramps 100 mm output for datacom lasers. Korea’s advanced-materials ecosystem supplies MOCVD consumables, reinforcing regional liquidity. However, export-license complexities from China’s raw-material controls create hedging demand for Japanese and Korean producers, who can command price premiums within the indium phosphide wafer market.
North America Indium Phosphide Wafer Market
North America’s share benefits from federal incentives. Coherent’s USD 33 million CHIPS grant expands 150 mm line capacity in Texas to safeguard quantum-computing and defense supply chains. Universities such as MIT Lincoln Laboratory prototype InP-on-Si emitters for cryogenic qubit control, seeding future commercial pull. Yet domestic raw material dependence on overseas sources still challenges the cost structure.
Europe Indium Phosphide Wafer Market
Europe leverages deep photonics expertise across Germany and the Netherlands. Ferdinand-Braun-Institut collaborates with Fraunhofer IZM to co-design InP HBTs for terahertz radar, while SMART Photonics pushes foundry services for InP-based PICs. Freiberger Compound Materials supplies VGF wafers with <1e4 cm-2 dislocation density, securing design wins in quantum-communication pilots. EU research grants offset capex, but energy-price volatility narrows margins versus Asian peers, shaping competitive dynamics of the indium phosphide wafer market.

Regulatory Landscape
Indium phosphide (InP) wafers sit at the intersection of dual-use controls and critical-minerals trade policy. In the European Union, Indium Phosphide is treated as a controlled dual-use item under the EU Dual-Use Regulation (EU) 2021/821, with updates reflected through Commission Delegated Regulation (EU) 2024/2547, which keeps compliance requirements relevant for cross-border shipments of III/V compound materials and related technology.
China added tighter licensing checks covering indium-bearing materials and InP-related exports in 2025, and industry reporting in 2026 highlighted that licensing pace and approvals can act as a practical supply gate for global optics and photonics supply chains. In the United States, the Bureau of Industry and Security (BIS) administers Export Administration Regulations (EAR) that shape export compliance for semiconductor manufacturing items and advanced-computing supply chains. Broader national-security scrutiny of critical-material imports further reinforces supply-risk management for InP wafer makers and their customers.
Value Chain Analysis
The value chain starts with upstream indium and phosphorus feedstocks and purification, then moves into single-crystal growth (commonly VGF/LEC/tCZ), slicing, lapping/polishing, and conversion to epi-ready substrates. Wafer suppliers sell into epitaxy and device fabrication for lasers, photodiodes, PICs, and RF/mm-wave devices, and downstream shipments flow through optical-module, telecom/datacom equipment, sensing, and defense supply chains. Asia-Pacific remains central because of integrated materials ecosystems, with companies such as Sumitomo Electric and JX Nippon Mining and Metals present across critical steps, while Western programs, including CHIPS-linked capacity actions by Coherent, focus on supply assurance for domestic defense and quantum-photonics needs.
Key bottlenecks center on export licensing for indium-bearing materials and substrate availability during qualification-heavy ramps to 150 mm wafers. Equipment suppliers for crystal growth, wafering, metrology, and handling act as gating enablers for yield and diameter scaling, and recent large-order activity for InP-related laser manufacturing tools shows how capacity additions propagate to wafer producers and then into laser and transceiver lines. Downstream buyers increasingly rely on multi-year supply frameworks and prepayments to secure constrained substrate output, which reduces spot availability and increases the leverage of long-term agreements.
Competitive Landscape
Industry concentration is moderate: the top five suppliers, including Sumitomo Electric, AXT, Freiberger, JX Nippon Mining and Metals, and Visual Photonics Epitaxy, collectively held around 70% of the revenue in 2024. Technical barriers rest on proprietary crystal-pulling furnaces, tailored doping chemistries, and decade-long qualification cycles with transceiver OEMs. New entrants like Xiamen Powerway exploit cost advantage from local feedstock but must prove reliability to capture tier-1 customers.
M&A reinforced vertical integration. Nokia’s USD 2.3 billion takeover of Infinera internalized InP PIC know-how for coherent modules, reducing supplier risk. Coherent’s capacity build, backed by U.S. incentives, positions it as both substrate and device vendor, compressing margins for pure-play wafer houses. Strategic partnerships emerge around heterogeneous integration: X-FAB pairs with SMART Photonics to offer foundry access that bundles passive silicon with active InP dies, reshaping the indium phosphide wafer market.
Technology leadership now centers on diameter scaling, defect density control below 5e-3 cm-2, and epi-surface roughness under 0.1 nm RMS. Suppliers investing in advanced metrology and AI-driven process windows achieve yields above 80% on 150 mm, widening cost gap over laggards. Customers increasingly dual-source to mitigate geopolitical risk, fostering healthy but disciplined competition across the indium phosphide wafer market.
Indium Phosphide Wafer Industry Leaders
Sumitomo Electric Semiconductor Materials, Inc.
AXT, Inc.
Freiberger Compound Materials GmbH
Xiamen Powerway Advanced Material Co., Ltd.
IQE plc
- *Disclaimer: Major Players sorted in no particular order

Indium Phosphide Wafer Market Companies Covered in this Report
- Sumitomo Electric Semiconductor Materials, Inc.
- AXT, Inc.
- Freiberger Compound Materials GmbH
- Xiamen Powerway Advanced Material Co., Ltd.
- IQE plc
- II-VI Incorporated (Coherent Corp.)
- JX Nippon Mining & Metals Corporation
- Semiconductor Wafer, Inc.
- Visual Photonics Epitaxy Co., Ltd. (VPEC)
- IntellEPI
- VIGO Photonics S.A.
- Western Minmetals (SC) Corporation
- PAM-XIAMEN (Powerway Wafer)
- SHANGHAI FAMOUS TRADE CO., LTD (ZMKJ)
- Atecom Technology Co., Ltd.
- Ding Ten Industrial Inc.
- Logitech Ltd.
- LandMark Optoelectronics Corporation
- Epihouse Optoelectronics Co., Ltd.
- Century Goldray Semiconductor Co., Ltd.

Market Opportunities and Future Outlook
A primary opportunity lies in turning constrained 150 mm (6-inch) InP wafer supply into repeatable, high-yield capacity that supports 800G/1.6T optics, co-packaged optics development, and wider photonic IC scaling. Multiple 2026 actions provide concrete market signals: the U.S. Department of Commerce CHIPS program issued a letter of intent tied to Coherent’s InP wafer manufacturing expansion, and Japan-based JX Advanced Metals announced capital spending of up to JPY 120 billion over several years to expand InP substrate capacity by 7-10x versus fiscal 2025. Taken together, these moves strengthen the case for suppliers that can qualify 6-inch substrates with tighter defect control, improve mechanical handling to reduce breakage, and provide dependable delivery terms for long qualification cycles.
A second opportunity is in heterogeneous integration pathways that rebalance demand between bulk InP handles and donor wafers for InP-on-Si approaches, alongside new end-markets such as quantum and specialty sensing where ultra-low-defect undoped wafers command price premiums. In 2026, Europe added industrialization momentum with the reported groundbreaking of a 6-inch InP photonic chip industrial wafer fab in Eindhoven, while China’s late-May 2026 batch approvals for InP substrate exports illustrated how regulatory throughput can shift global availability. These developments increase the commercial value of dual-sourcing, localized capacity, and vertically integrated relationships across wafer makers, epitaxy/device fabs, and optical-module OEMs.
Recent Industry Developments in Indium Phosphide Wafer Market
- July 2026: Sumitomo Electric announced an approximately JPY 18 billion investment to upgrade production lines and raise indium phosphide substrate capacity to 3.1 times its fiscal 2024 level by fiscal 2028. The program directly targets substrate constraints impacting high-speed optics and strengthens the companys ability to support long qualification cycles and multi-year supply commitments.
- June 2026: AXT, Inc. entered a 3-year Master Development and Supply Agreement with Coherent Corp for the mass development and supply of 6-inch indium phosphide wafer substrates, supported by a USD 22.29 million prepayment. The structure signals tighter capacity reservation and deeper supplier-customer co-development around 150 mm process maturity and yield improvements.
- April 2026: AXT, Inc. reported actions to support indium phosphide capacity expansion and R&D as part of its broader financing and investment initiatives disclosed alongside first-quarter 2026 results. The funding-backed push aligns with the markets shift toward 6-inch substrates and reflects how suppliers are mobilizing capital to address wafer availability and qualification-driven ramps.


Indium Phosphide Wafer Market Report Scope and Research Methodology
Market Definition and Coverage
This market covers revenue earned from indium phosphide (InP) wafer products sold to customers, where wafers are used as the starting substrate for photonics, RF, and related compound semiconductor devices.
Scope exclusions: We exclude downstream device fabrication value add, packaging, module assembly, and end equipment revenues. We also exclude compound semiconductor wafers that are not InP.
Segments Covered in This Report
- By Diameter
- 50.8 mm
- 76.2 mm
- 100 mm
- 150 mm and Above
- By Wafer Doping Type
- Undoped Conductive
- N-Type (S / Sn-doped)
- P-Type (Zn-doped)
- Semi-insulating (Fe-doped)
- By Application
- Photonics and Optical Transceivers
- RF and mm-Wave Devices (HEMT, HBT)
- Photovoltaics and Power Conversion
- Quantum and Specialty Sensing
- By End-user Industry
- Telecommunications and Datacom
- Consumer Electronics and Wearables
- Aerospace and Defense
- Automotive and Transportation
- Medical and Life-sciences
- By Manufacturing Technology
- VGF-grown Bulk Wafers
- LEC/tCZ-grown Bulk Wafers
- Epitaxial InP-on-Si (Hybrid)
- MBE/MOCVD Epi-ready Substrates
- By Geography
- North America
- United States
- Canada
- Mexico
- South America
- Brazil
- Argentina
- Rest of South America
- Europe
- Germany
- United Kingdom
- France
- Italy
- Rest of Europe
- Asia-Pacific
- China
- Japan
- South Korea
- India
- Rest of Asia-Pacific
- Middle East
- Saudi Arabia
- United Arab Emirates
- Rest of Middle East
- Africa
- South Africa
- Rest of Africa
- North America
Data Sources, Market Sizing, and Validation
Desk Research
Desk research is used to set the market boundary and anchor key inputs in sources that readers can cross-check. We refer to non-paywalled sources such as the US International Trade Commission, UN Comtrade, the World Semiconductor Trade Statistics association, IEEE and other peer-reviewed journals, and patent publications from bodies such as the USPTO and WIPO to understand technology direction, trade flows, and the demand backdrop.
To tighten the story behind the numbers, we also review company filings, investor presentations, conference proceedings, association sites, and credible press coverage of capacity additions and roadmap milestones for optical and RF devices. Select paid subscriptions are used only to speed up company financials and intelligence checks and to scan patents at scale, so assumptions can be tested quickly. These desk sources are illustrative rather than exhaustive, and many other public references were also used for data collection, validation, and research clarification.
Primary Interviews and Surveys
Primary work focuses on clarifying items that desk sources do not show cleanly, such as real wafer diameter mix, qualification timelines, yield expectations, and near-term pricing behavior during capacity ramps. We speak with a mix of wafer suppliers, substrate and epi-ready specialists, and downstream engineering and procurement respondents across APAC, EMEA, and the Americas, so assumptions are stress-tested from both supply and demand viewpoints.
Distribution of primary research fieldwork respondents
| Company type | Respondent position | Region |
|---|---|---|
| Top tier: 30% | CXOs: 14% | APAC: 38% |
| Mid tier: 56% | Functional/Unit leaders: 38% | EMEA: 37% |
| Smaller Players: 14% | Managers: 48% | Americas: 25% |
Market-Sizing & Forecasting
Market sizing is first built using a top-down and bottom-up model combination. The top-down view reconstructs indium phosphide (InP) wafer demand from a defined demand pool tied to photonics and high-frequency device activity, then it is adjusted for realistic wafer-to-device conversion and qualification behavior. After that, results are corroborated through selective bottom-up approximations where disclosures exist, supplier revenue sampling, channel feedback on wafer shipments, and a simple ASP times volume build for key diameter bands, which helps correct over-counting.
Inputs that matter in this market include the diameter mix shift (2-inch, 3-inch, and 4-inch adoption), optical transceiver speed transitions and related shipment momentum, RF and mm-wave program activity, yield and scrap behavior for epi-ready substrates, and pricing changes during capacity ramps. Forecasts are prepared using scenario analysis supported by expert expectations on capacity additions, qualification cycles, and the pace of larger-diameter adoption, and then the outputs are stress-tested with conservative and aggressive cases. Where bottom-up signals are incomplete, gaps are handled with bounded ranges tied back to these demand indicators, and then narrowed through primary feedback.
Data Validation & Update Cycle
Model outputs are checked against independent signals such as trade movement direction, patent intensity shifts, and announced capacity and technology milestones, and then variances are reviewed until the drivers are clear. A second analyst review is used to challenge the largest assumptions, and follow-up outreach is triggered when an input shifts materially or when a regional trend looks inconsistent.
Reports are refreshed annually, and interim updates are made when major events occur such as pricing shocks, capacity expansions, or step-changes in optical and RF demand. Before delivery, we complete a fresh review pass so clients receive the latest updated view.
Mordor Intelligence's Indium Phosphide Wafer Market Size Compared With Other Published Estimates
Published market sizes for InP wafers can diverge even when the same general theme is being discussed, because category boundaries and base years are not always aligned. Differences also come from how diameter bands are grouped, whether epi-ready value add is counted as wafer revenue, and how currency timing is treated when suppliers report in different denominations.
By tracking diameter mix and qualification timing, and then refreshing currency conversion timing within Mordor Intelligence, the model keeps the total focused on wafer product revenue rather than mixing in downstream device value.
Benchmark comparison
| Source | Market Size | Gaps in Research Methodology |
|---|---|---|
| Mordor Intelligence | USD 221.42 M (2026) | |
| Industry Publisher A | USD 179.12 M (2024) | Uses an earlier base year and a longer runway to 2032, which can compress near-term wafer value when diameter upgrades and pricing steps are smoothed instead of being tied to qualification waves. |
| Global Publisher B | USD 204.00 M (2025) | Anchors the model on 2025 sales and may blend value and volume framing across regions, which can shift results if ASP progression and larger-diameter adoption are not separated consistently by product class. |
The spread in values is mainly explained by base-year choice and by whether wafer-only revenue is kept separate from nearby downstream value pools. When inputs are tied back to observable demand signals and rechecked before forecasting, the number stays easier to trace and repeat from one update cycle to the next.


Key Questions Answered in the Report
How fast will indium phosphide wafer demand grow through 2031?
Global revenue is projected to rise at an 11.73% CAGR from USD 198.17 million in 2025 to USD 385.65 million by 2031.
Which application category buys the most InP wafers today?
Photonics and optical transceivers held 58.92% of 2025 demand, reflecting widespread 800 G deployments.
Why are 150 mm wafers becoming important?
Migration to 6-inch formats lowers cost per square centimeter and aligns with idle GaAs tooling, supporting a 13.15% CAGR for this diameter class.
What regions dominate supply and demand?
Asia-Pacific led with 41.55% revenue in 2025, backed by integrated compound-semiconductor ecosystems and strong telecom equipment production.
How vulnerable is the supply chain to export controls?
High reliance on Chinese gallium and indium exposes Western fabs to price shocks, prompting domestic capacity expansions such as Coherents Texas line.
Which technology trend could disrupt traditional bulk-wafer demand?
InP-on-Si heterogeneous integration, growing at 13.46% CAGR, may shift some volume from pure bulk substrates to bonded die solutions.
Page last updated on:


 Your data is secure and never sold or shared.


