
Indirect Calorimeter Market Size and Share
Market Overview
| Study Period | 2020 - 2031 |
|---|---|
| Market Size (2026) | USD 0.86 Billion |
| Market Size (2031) | USD 1.09 Billion |
| Growth Rate (2026 - 2031) | 4.82 % |
| Fastest Growing Market | Asia Pacific |
| Largest Market | North America |
| Market Concentration | Medium |
Major Players
*Disclaimer: Major Players sorted in no particular order Image © Mordor Intelligence. Reuse requires attribution under CC BY 4.0. |
|
Indirect Calorimeter Market Analysis by Mordor Intelligence
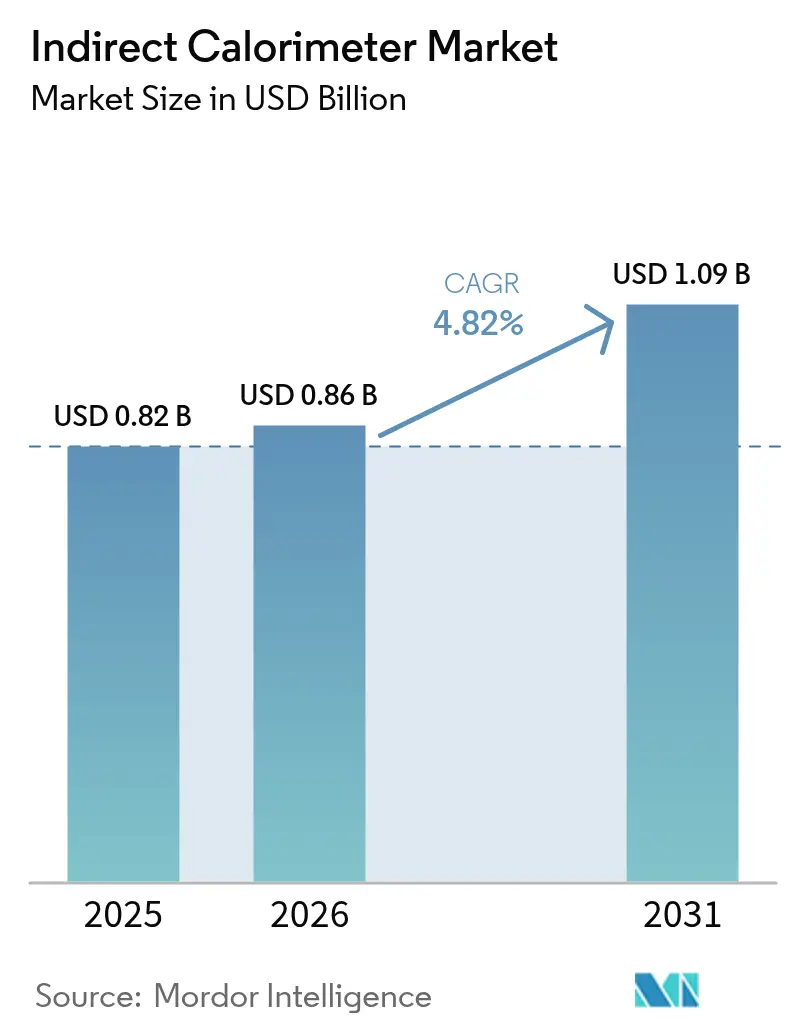
The indirect calorimeter market size was valued at USD 0.82 billion in 2025 and estimated to grow from USD 0.86 billion in 2026 to reach USD 1.09 billion by 2031, at a CAGR of 4.82% during the forecast period (2026-2031). This trajectory rests on precision-nutrition protocols in critical care, a push toward point-of-care diagnostics, and rapid miniaturization that lowers ownership costs. Portable MEMS-based sensors, shorter measurement cycles, and rising reimbursement clarity continue to widen the indirect calorimeter market footprint across hospitals, sports facilities, and home-monitoring services. Hospitals remain the primary revenue engine, yet sports performance and wellness labs now act as catalysts for incremental demand. Regionally, North America dominates the indirect calorimeter market thanks to Medicare coverage and strong clinical guidelines, whereas Asia-Pacific exhibits the fastest volume growth as obesity prevalence climbs and hospital spending accelerates. Competitive intensity is moderate: incumbent device makers are being challenged by university spin-offs that target consumer-oriented metabolic trackers.
Key Report Takeaways
- By product type, stand-alone devices held 62.70% of the indirect calorimeter market share in 2025; portable systems are projected to expand at a 5.31% CAGR through 2031.
- By applications, medical-care applications accounted for 75.90% of the indirect calorimeter market size in 2025, while sports and fitness is set to record a 5.42% CAGR to 2031.
- By end user, Hospitals captured 57.60% of the indirect calorimeter market share in 2025; sports performance labs are forecast to rise at a 5.33% CAGR over the same horizon.
- By geography, North America generated 40.70% of the indirect calorimeter market revenue in 2025; Asia-Pacific is projected to witness a 5.26% CAGR through 2031.
Note: Market size and forecast figures in this report are generated using Mordor Intelligence’s proprietary estimation framework, updated with the latest available data and insights as of 2026.
Global Indirect Calorimeter Market Trends and Insights
Drivers Impact Analysis*
| Driver | (~) % Impact on CAGR Forecast | Geographic Relevance | Impact Timeline |
|---|---|---|---|
| Technological miniaturization & sensor cost decline | +1.2% | North America, Europe, later global adoption | Medium term (2-4 years) |
| Rising global obesity & metabolic disorders | +1.0% | Global, highest in high-income economies | Long term (≥ 4 years) |
| Growing awareness of measured energy benefits | +0.8% | Developed markets | Medium term (2-4 years) |
| ICU adoption for precision nutrition therapy | +0.7% | North America, Europe, expanding in Asia-Pacific | Short term (≤ 2 years) |
| Shift to at-home metabolic testing services | +0.6% | North America, Europe | Long term (≥ 4 years) |
| Insurance coding expansion | +0.4% | United States, select EU nations | Medium term (2-4 years) |
| Source: Mordor Intelligence | |||
Technological Miniaturization & Sensor Cost Decline
MEMS-based oxygen and carbon-dioxide sensors now rival mass-spectrometry precision at a fraction of the cost, cutting measurement uncertainty to 3% and shrinking form-factors to pocket scale [1]H. Cengiz et al., “Validation of MEMS-based Gas Sensors,” MDPI Energies, mdpi.com. Field-validated systems such as the COSMED K4b2 prove that mobile calorimetry can match laboratory reference methods in outdoor sports settings. Consumer prototypes achieve >0.99 correlation with Douglas-bag measurements, signaling a shift toward always-on metabolic monitoring. Lower per-test costs and shorter calibration cycles help hospitals justify routine bedside use, while sports labs gain flexibility to test athletes in real-play environments. Academic spin-offs such as the Breezing portable tracker underscore this democratization of metabolic analytics.
Rising Global Obesity & Metabolic Disorders
Prediction equations fail to estimate resting energy expenditure accurately in over 80% of hospitalized adults aged ≥70, reinforcing the clinical need for direct measurement. As obesity-related metabolic dysfunction grows, precise calorimetry guides tailored macronutrient dosing, shortens ICU stays, and reduces complications. Governments and insurers increasingly reimburse indirect calorimetry because outcome data reveal cost offsets from fewer ventilator days. The indirect calorimeter market therefore scales with chronic-disease prevalence and policy shifts toward outcome-based care.
Growing Awareness About the Advantages
Position papers from the ICALIC study group and professional bodies highlight indirect calorimetry as a gold standard for critically ill patients, driving protocol updates at tertiary hospitals. Respiratory-quotient read-outs offer immediate insight into substrate utilization, enabling clinicians to modulate fat-versus-carbohydrate delivery on the spot. Conferences and continuing-education programs accelerate knowledge transfer, bolstering demand in both dietetics and respiratory therapy practice.
ICU Adoption for Precision Nutrition Therapy
Prospective ICU audits show measured metabolism averages 1,649 kcal ± 544 versus widely misaligned calculated estimates, proving the clinical utility of real-time measurement. New devices like Q-NRG produce results in under 10 minutes, overcoming workflow concerns. Guidelines from the European Society for Clinical Nutrition and Metabolism explicitly mandate indirect calorimetry in hemodynamically stable ICU patients, reinforcing purchase decisions. Hospitals thereby anchor the indirect calorimeter market through protocolized use [2]Mette M. Berger, "How to interpret and apply the results of indirect calorimetry studies: A case-based tutorial," Clinical Nutrition, sciencedirect.com.
Restraints Impact Analysis*
| Restraint | (~) % Impact on CAGR Forecast | Geographic Relevance | Impact Timeline |
|---|---|---|---|
| High capital & disposable costs | -0.9% | Global, acute in low-resource settings | Short term (≤ 2 years) |
| Stringent regulatory & validation demands | -0.6% | United States, European Union | Medium term (2-4 years) |
| Scarcity of trained metabolic technologists | -0.5% | Emerging markets | Long term (≥ 4 years) |
| Accuracy drift in pediatric low-flow tests | -0.3% | Specialized pediatric ICUs | Medium term (2-4 years) |
| Source: Mordor Intelligence | |||
High Capital & Disposable Costs
Stand-alone ICU-grade systems exceed USD 25,000 and require calibration gases, flow sensors, and single-use valves, adding annual ownership burdens that smaller clinics struggle to absorb [3]Manufacturer note, “Capital and Operating Costs of Q-NRG,” COSMED, cosmed.com. The indirect calorimeter market therefore favors tertiary hospitals and integrated health networks. Portable MEMS devices cut entry prices, but reimbursement schedules must widen for broader penetration.
Stringent Regulatory & Validation Requirements
The FDA classifies indirect calorimeters as Class II devices, obliging manufacturers to complete substantial-equivalence filings and multi-site accuracy trials before commercialization. CE-mark rules impose parallel clinical validation in Europe. Compliance costs slow start-up activity and elongate product cycles, tempering innovation pace within the indirect calorimeter market.
*Our forecasts treat driver/restraint impacts as directional, not additive. The impact forecasts reflect baseline growth, mix effects, and variable interactions.
Segment Analysis
By Product Type: Portable Systems Drive Innovation
Standalone calorimeters commanded 62.70% of the indirect calorimeter market share in 2025 on the strength of ICU protocols that prize absolute accuracy and deep analytic menus. Workflow-oriented designs integrate with electronic medical records, ensuring seamless data capture. The indirect calorimeter market size for portable units is projected to climb at 5.31% CAGR to 2031, reflecting their growing equivalence to laboratory benchmarks and their appeal for sports-science field work.
Portable systems now embed mini turbulence channels, micro-heaters, and advanced algorithms, matching ±5% precision thresholds once exclusive to benchtop instruments. Sports performance centers value this flexibility to test VO₂ and VCO₂ without tethering athletes to treadmills. Healthcare-at-home programs also piloted remote metabolic testing in 2025, signaling another future revenue pool within the indirect calorimeter market.




By Application: Medical Dominance With Sports Expansion
Medical care maintained 75.90% of the indirect calorimeter market size in 2025, with ICU nutrition, metabolic disorder clinics, and pre-operative work-ups as core use cases. Reimbursement at USD 63 per test in the United States underpins steady procedure volumes. Sports and fitness, however, should post a 5.42% CAGR through 2031 as professional teams, military programs, and wellness chains formalize metabolic analytics within training schedules.
The indirect calorimeter market now straddles patient care and performance optimization, blurring traditional boundaries. Universities run dual clinics that see both bariatric patients and varsity athletes, maximizing device utilization. As miniaturized hardware improves, wearable calorimeters could emerge, catalyzing further growth in recreational fitness circles.
By End User: Hospitals Lead While Sports Labs Accelerate
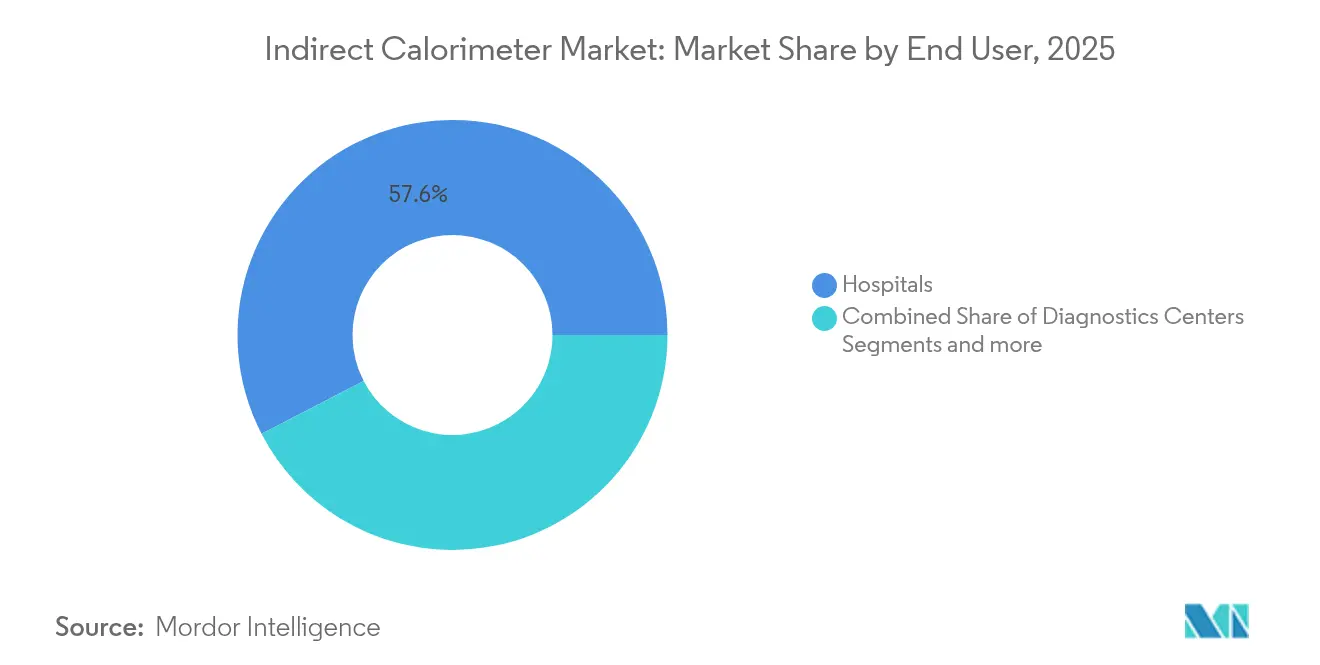
Hospitals represented 57.60% of the indirect calorimeter market share in 2025 as acute-care facilities embedded calorimetry into critical-care bundles. Automatic data transfer to nutrition-support dashboards eliminates manual charting, boosting clinical efficiency. Sports-performance laboratories, although smaller in absolute terms, are on course for a 5.33% CAGR to 2031, integrating calorimetry with motion-capture and lactate analytics for holistic athlete profiling.
Diagnostic centers and academic institutions follow as steady adopters, purchasing shared-use systems for outpatient metabolic testing. The indirect calorimeter market thus balances volume-driven hospital demand with high-margin niche testing in elite sports and research environments.
Geography Analysis
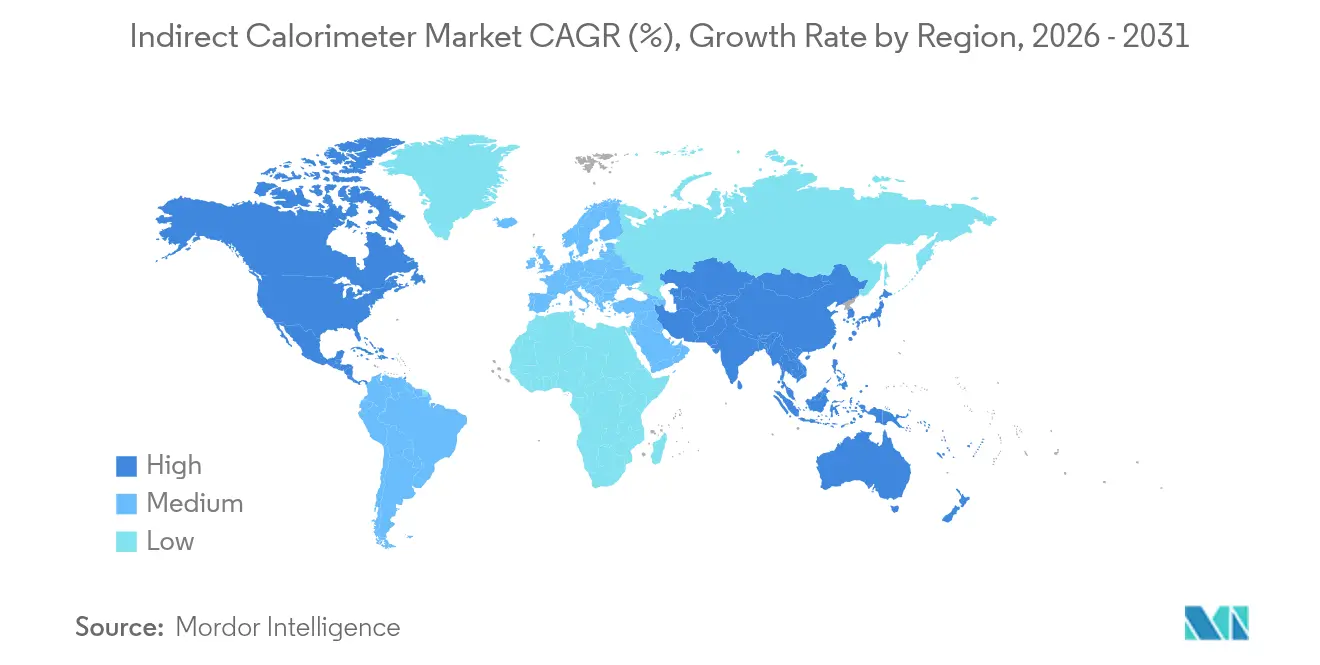
North America generated 40.70% of 2025 revenue for the indirect calorimeter market, leveraging Medicare code 94690 and strong clinical-society endorsements. Device vendors secure predictable sales funnels via group-purchasing contracts and bundled service agreements. Europe follows with entrenched ICU protocols and multicenter validation studies that maintain steady installations in Germany, France, and the Nordics.
Asia-Pacific is the fastest expanding geography at 5.26% CAGR to 2031, propelled by national obesity-control programs and rapid private-hospital growth in China and India. Local contract manufacturers are licensing Western sensor patents to produce cost-optimized units, aiding regional penetration of the indirect calorimeter market. Middle East and Africa lag in installed base but several teaching hospitals in the Gulf Cooperation Council funded Q-NRG fleets in 2025, hinting at latent demand once training hurdles ease.
South America observes moderate uptake; Brazil’s cardiopulmonary rehab clinics favor lightweight calorimeters that couple with six-minute-walk tests, while Argentina’s social-security hospitals budget for one device per ICU cluster. Collectively these dynamics diversify the regional revenue mix and insulate the indirect calorimeter market from single-region shocks.

Regulatory Landscape
Indirect calorimeters are regulated as medical devices in major markets, with the United States pathway typically running through the FDA Class II framework for oxygen-uptake computer functions (commonly associated with product code BZL) and commercialization generally relying on 510(k) substantial-equivalence submissions. Beyond clinical performance and accuracy validation, manufacturers must document core conformity elements such as electrical safety (IEC 60601-1) and electromagnetic compatibility (EN/IEC 60601-1-2) to support hospital deployment in ICU and cardiopulmonary environments.
In Europe, CE marking is governed by the EU Medical Device Regulation (Regulation (EU) 2017/745), which tightens clinical evaluation and technical documentation expectations for devices with measuring functions, while also reinforcing requirements across software validation and patient-contact risk management (including ISO 10993-1 biocompatibility where applicable). MDCG guidance (including MDCG 2023-6) shapes how manufacturers evidence equivalence and clinical data adequacy, increasing the documentation burden for new entrants and making well-designed validation studies more central to market access.
Competitive Landscape
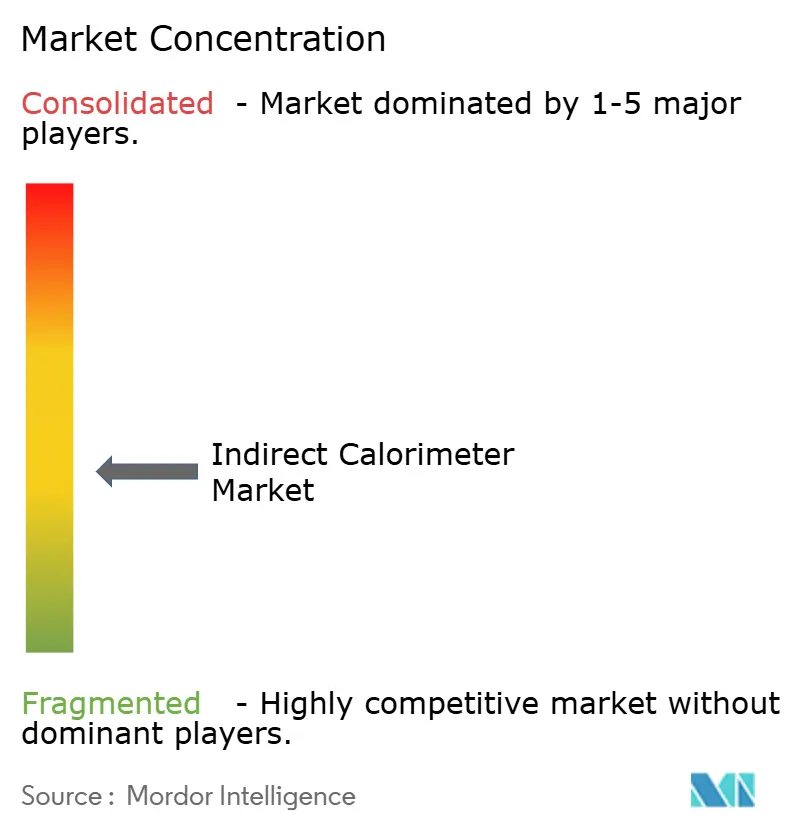
The indirect calorimeter market features mid-level fragmentation, with no vendor eclipsing 20% global revenue. COSMED, Vyaire Medical, and MGC Diagnostics anchor the stand-alone segment through long-standing ICU relationships. Each leverages integrated cardiopulmonary platforms that bundle indirect calorimetry with spirometry, raising switching costs for hospital buyers.
Start-ups and university spin-offs concentrate on handheld and consumer devices. Arizona State University’s Breezing unit reached its third-generation sensor in 2025, promising sub-10-second warm-up and smartphone-based analytics. Such entrants strategize around subscription-driven nutrition-coaching apps, creating adjacency revenue that incumbents lack. Licensing agreements emerge as a common path: in 2024 an Italian sports-tech firm sublicensed COSMED’s flow-dilution patent for bicycle-mounted metabolic carts, bridging medical precision with athletic realities.
Strategic moves revolve around regulatory approvals, clinical-evidence generation, and geographic reach. MGC Diagnostics secured FDA clearance for its Ascent cardiorespiratory software suite in 2024, enabling unified pulmonary and metabolic reporting. COSMED partnered with a French ICU consortium to validate pediatric low-flow measurements, addressing a known accuracy restraint. OEM collaborations with sensor fabs in Taiwan lowered component costs, protecting gross margins as average selling prices decline in emerging markets. The indirect calorimeter market therefore balances legacy hospital platforms with agile innovators that prioritize portability and consumer engagement.
Indirect Calorimeter Industry Leaders
-
KORR Medical Technologies
-
Parvo Medics
-
Cosmed srl
-
MGC Diagnostics
-
Vyaire Medical
- *Disclaimer: Major Players sorted in no particular order

Market Opportunities and Future Outlook
A white space remains in extending indirect calorimetry performance into challenging respiratory environments where accuracy and usability can degrade, including high inspired oxygen conditions (often cited at >60-70% FiO2) and patients supported with ECMO. Sensor and algorithm development that expands dynamic range and maintains stability under complex ventilation can broaden ICU applicability, particularly when paired with workflow improvements such as shorter test cycles, reduced calibration burden, and tighter integration into clinical decision support for enteral and parenteral nutrition.
Commercial opportunity is also tied to converting guideline-backed use into repeatable clinical workflows rather than sporadic testing. Critical care nutrition guidance from bodies such as SCCM/ASPEN and other regional ICU guidelines emphasizes targeted measurement in stable patients where predictive equations perform poorly, which creates demand for solutions that help clinicians identify suitable patients, standardize protocols, and automate reporting into hospital systems. On the non-acute side, the spread of portable and outpatient systems from vendors such as KORR Medical Technologies, Microlife, Maastricht Instruments BV, MGC Diagnostics, and ICU-oriented platforms offered through Baxter (Q-NRG) points to room for clinics, wellness programs, and sports labs to bundle metabolic measurement with nutrition coaching and longitudinal monitoring services.
Recent Industry Developments
- June 2026: COSMED signed a Share Purchase Agreement to acquire a majority stake in MADA Filters, an Italian manufacturer of filtration solutions and consumables used in respiratory and diagnostic applications, with closing referenced for July 2026. COSMED is using the deal to strengthen its control over a key consumables layer that supports respiratory measurement workflows. This can improve supply continuity and attachment potential alongside its metabolic testing portfolio.
- June 2026: COSMED held its International Sales Meeting 2026 (June 24-26) in Pomezia and Albano Laziale, Italy, aligning teams around strategic priorities and product roadmap themes, including AI-related initiatives for 2026-2027. The sales meeting underscores commercial and product alignment intended to support faster global execution across channels that sell indirect calorimetry and adjacent cardiopulmonary diagnostics.
- October 2024: COSMED released OMNIA 2.4.2 software, expanding compatibility across applicable COSMED devices and adding features including an energy balance tool and obstructive sleep apnea classification. Broader software compatibility helps standardize metabolic assessment workflows across installed bases and can increase utilization by simplifying data handling in multi-device clinical and performance settings.


Research Methodology Framework and Report Scope
Market Definition and Coverage
This market covers the revenue generated from indirect calorimeter devices used to estimate energy expenditure by measuring oxygen consumption and carbon dioxide production, across clinical and performance settings. Values are captured at the equipment level and tracked across major regions.
Scope exclusions: Consumables, service contracts, and general respiratory diagnostic devices that do not report metabolic rate are not counted.
Segmentation Overview
-
By Product Type
- Standalone
- Portable
-
By Application
- Medical Care
- Sports and Fitness
- Others
-
By End User
- Hospitals
- Diagnostic Centers
- Sports Performance Labs
- Others
-
By Geography
-
North America
- United States
- Canada
- Mexico
-
Europe
- Germany
- United Kingdom
- France
- Italy
- Spain
- Rest of Europe
-
Asia-Pacific
- China
- Japan
- India
- Australia
- South Korea
- Rest of Asia-Pacific
-
Middle East and Africa
- GCC
- South Africa
- Rest of Middle East and Africa
-
South America
- Brazil
- Argentina
- Rest of South America
-
North America
Data Sources, Market Sizing, and Validation
Desk Research
Desk research is used to set the base structure of the model and to anchor assumptions that should not depend on opinion. We referenced public sources such as the World Health Organization for nutrition and obesity indicators, the US CDC for population health statistics, the National Institutes of Health and PubMed-indexed clinical literature for evidence on indirect calorimetry use, and the US FDA device databases for product clearances and device classifications. We also reviewed publicly available materials from clinical nutrition and respiratory care associations, plus national statistical offices for healthcare capacity indicators in key countries.
To translate demand into realistic unit and value ranges, we complemented this with company annual reports, investor presentations, product brochures, import and export trade releases where available, and reputable press coverage on hospital equipment spending and new device launches. A paid subscription for company financials and intelligence was used selectively to validate revenue splits when public disclosures were limited. The sources mentioned here are illustrative, and many other public documents and datasets were also checked for data collection, validation, and clarification.
Primary Interviews and Surveys
Primary work was used to test what desk findings could not fully answer, especially on real adoption in ICUs, nutrition clinics, and sports performance labs, and on typical replacement timing. We spoke with a mix of manufacturers, distributors, biomedical procurement teams, clinicians, and lab managers across APAC, EMEA, and the Americas so that regional reimbursement, training, and utilization patterns could be reflected in the final assumptions.
Distribution of primary research fieldwork respondents
| Company type | Respondent position | Region |
|---|---|---|
| Top tier: 33% | CXOs: 12% | APAC: 42% |
| Mid tier: 53% | Functional/Unit leaders: 29% | EMEA: 35% |
| Smaller Players: 14% | Managers: 59% | Americas: 23% |
Market-Sizing & Forecasting
Our market model starts with a top-down demand pool that is reconstructed from hospital and lab infrastructure, critical care and nutrition assessment activity, and the practical penetration of indirect calorimetry in target care pathways. Once the demand pool is formed, it is translated into yearly device volumes using replacement cycles, utilization patterns, and the share of sites that use portable versus standalone systems.
To keep the values realistic, results are corroborated with selective bottom-up approximations, including sampled average selling price bands by device type, distributor channel checks, and a limited supplier revenue roll-up where disclosures allow. Inputs that mattered most in this market included ICU bed expansion and nutrition support protocols, reimbursement clarity for metabolic testing, adoption of portable carts in smaller facilities, training and workflow time per test, and regional import dependence that can shift delivered pricing. For forecasting, scenario analysis is used around adoption and pricing, and the final year-by-year path is smoothed with exponential smoothing so short-term volatility does not overstate the trend. Where the bottom-up view is thin for smaller countries, we backfill using comparable facility density and healthcare spend signals, then recheck the implied per-site device intensity with interview feedback.
Data Validation & Update Cycle
Validation is handled through repeated cross-checks, where model totals are compared with independent signals such as installed base reasonableness by facility count, observed price bands by device type, and the implied testing capacity in major care settings. If any region shows an unusual jump, the underlying drivers are re-opened and, when needed, experts are re-contacted to confirm whether it reflects a real adoption shift or a data artifact.
Before sign-off, the work is reviewed in multiple steps by an analyst and a peer reviewer so assumptions, math, and unit economics remain consistent across regions. The report is refreshed on an annual cycle, and interim updates are made when material events occur, such as policy changes, major product approvals, or large procurement swings. Right before delivery, we do a final pass to ensure the latest public releases are reflected in the numbers.
Mordor Intelligence's Indirect Calorimeter Market Size Compared With Other Published Estimates
Published market values for indirect calorimeters often do not match because each publisher draws the line differently on what gets counted and how prices and adoption are projected over time. Differences also come from the base year selected, the geographies covered, and whether the inputs are tested with interviews from the buying side.
Consumables and long-term maintenance revenue sit outside scope, and this single exclusion is a common reason some totals look higher even when device unit demand appears similar across hospitals and labs. Other gaps are usually created by how portable and wearable products are grouped, how fast ASPs are assumed to move with miniaturization, and whether currency conversion is held constant or updated each year during the forecast.
Benchmark comparison
| Source | Market Size | Gaps in Research Methodology |
|---|---|---|
| Mordor Intelligence | USD 0.86 B (2026) | |
| Global Consultancy A | USD 0.63 B (2024) | Uses an earlier base year and a narrower product set in the headline sizing, which can understate the effect of newer portable system adoption and later-year price realization. |
| Industry Publisher B | USD 0.62 B (2025) | Applies a faster growth path and includes adjacent form factors like wearables in the total, which can raise the long-range forecast even if clinical demand in hospitals is not expanding at the same pace. |
Consumables and long-term maintenance revenue sit outside Mordor Intelligence's scope for this market, which helps explain why some published totals come out larger than a device-only model for the same period. Taken together, the spread is mainly explained by scope boundaries and how quickly adoption and pricing are allowed to change in the forecast years, and the outputs remain checkable against facility counts, ASP bands, and interview validation.


Key Questions Answered in the Report
What is the current value of the indirect calorimeter market?
The indirect calorimeter market size is USD 0.86 billion in 2026 and is projected to reach USD 1.09 billion by 2031.
Which product category is growing fastest?
Portable systems are forecast to grow at 5.31% CAGR through 2031 due to sensor miniaturization and demand for field testing.
Which application drives most revenue?
Medical-care settings, especially ICU nutrition therapy, contributed 75.90% of 2025 revenue.
Which region offers the highest growth rate?
Asia-Pacific leads with a 5.26% CAGR to 2031, bolstered by rising healthcare expenditure and obesity incidence.
What are key barriers to adoption?
High capital plus disposable costs and stringent regulatory validation slow uptake, particularly in emerging markets.
Who are prominent vendors?
COSMED, Vyaire Medical, and MGC Diagnostics head the hospital segment, while newer entrants pursue handheld consumer devices.
Page last updated on:





