Market Overview
| Study Period | 2018 - 2031 |
|---|---|
| Forecast Data Period | 2026 - 2031 |
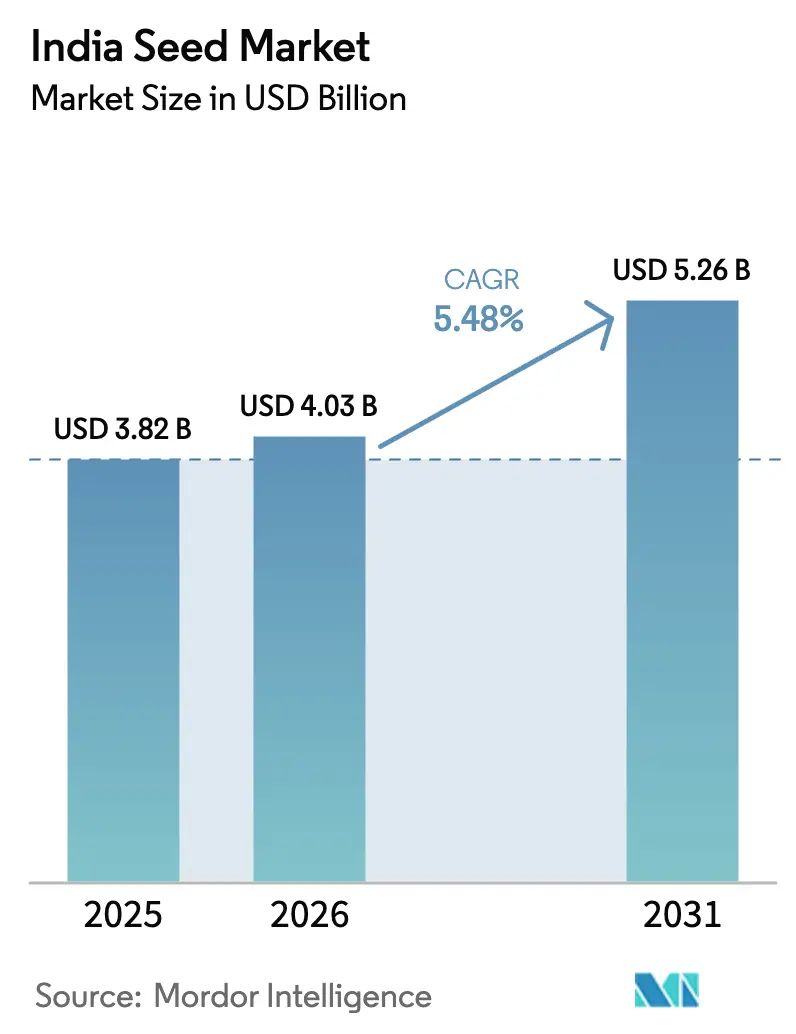
| Base Year Market Size (2025) | USD 3.82 Billion |
| Market Size (2026) | USD 4.03 Billion |
| Market Size (2031) | USD 5.26 Billion |
| Growth Rate (2026 - 2031) | 5.48% CAGR |
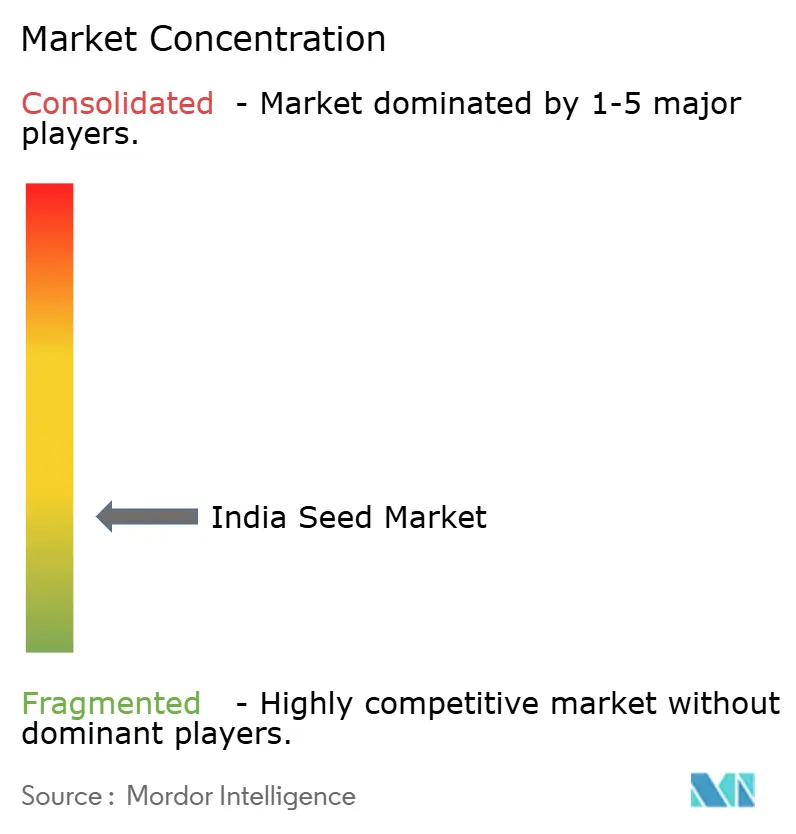
| Market Concentration | Low |
Major Players *Disclaimer: Major Players sorted in no particular order Image © Mordor Intelligence. Reuse requires attribution under CC BY 4.0. | |
India Seed Market Analysis by Mordor Intelligence
The India seed market size was valued at USD 3.82 billion in 2025 and estimated to grow from USD 4.03 billion in 2026 to reach USD 5.26 billion by 2031, at a CAGR of 5.48% during the forecast period (2026-2031). Sustained policy support, rising certified‐seed penetration, and expanding climate‐smart varieties continue to anchor industry resilience. Government programs such as the National Mission on High-Yielding Seeds and the Clean Plant Program are fast-tracking premium seed adoption by funding disease-free planting material hubs, demonstration plots, and village-level clusters. Row crops dominate revenue because cereals, oilseeds, and fiber crops align with food-security and import-substitution priorities, while hybrids retain farmer loyalty thanks to consistent yield premiums under erratic rainfall. Meanwhile, protected cultivation and digital traceability pilots are opening lucrative niches for specialized vegetable and high-value seed segments. Competitive intensity is low because multinational pipelines compete with regionally adapted portfolios, yet counterfeit trade and GM regulatory uncertainty exert margin pressure.
Key Report Takeaways
- By breeding technology, hybrids commanded 69.62% of India's seed market share in 2025, and hybrids are set to advance at a 5.60% CAGR through 2031.
- By cultivation mechanism, Open Field accounted for a 99.74% share of the India seed market size in 2025, and protected cultivation seeds are forecast to expand at an 10.90% CAGR between 2026 and 2031.
- By crop type, row crops accounted for an 79.95% share of the India seed market size in 2025 and are projected to grow at a 5.45% CAGR through 2031.
- By geography, Maharashtra holds a 13.45% share of the India seed market size in 2025, and Haryana logs a 6.58% CAGR through 2031.
Note: Market size and forecast figures in this report are generated using Mordor Intelligence’s proprietary estimation framework, updated with the latest available data and insights as of 2026.
India Seed Market Trends and Insights
Drivers Impact Analysis*
| Driver | (~) % Impact on CAGR Forecast | Geographic Relevance | Impact Timeline |
|---|---|---|---|
| Government cluster programs scaling certified seed demand | +1.2% | National, with early gains in Maharashtra, Gujarat, and Karnataka | Medium term (2-4 years) |
| Shift to climate-resilient hybrids in cereals and pulses | +0.9% | National, concentrated in the rain-fed zones of Rajasthan, Madhya Pradesh | Long term (≥ 4 years) |
| Expansion of protected cultivation boosting high-value vegetable seeds | +0.7% | Maharashtra, Karnataka, Gujarat, and Haryana | Short term (≤ 2 years) |
| Digital crop-survey data unlocking hyper-local seed targeting | +0.5% | National, with pilot deployments in Punjab, Haryana, and Uttar Pradesh | Medium term (2-4 years) |
| Export push for Indian vegetable and cotton seed | +0.4% | Gujarat, Maharashtra, Andhra Pradesh, and Telangana | Long term (≥ 4 years) |
| Venture capital inflows into seed-genomics start-ups | +0.3% | National, concentrated in Bangalore, Hyderabad, and Delhi NCR | Medium term (2-4 years) |
| Source: Mordor Intelligence | |||
Government Cluster Programs Scaling Certified Seed Demand
National seed missions are knitting together research stations, processors, and farmers. Budget 2025 earmarked significant amount to support nucleus and breeder seed production and to launch low-productivity-district pilots that showcase certified versus farm-saved seed yields[1]Source: Press Information Bureau, “Union Budget 2025 – Agriculture Sector Highlights,” pib.gov.in. Mandatory performance labeling under the forthcoming Seeds Bill 2004 will institutionalize cultivar transparency, prompting both public breeders and private firms to recalibrate supply chains toward certified output. Demonstration plots within 100 priority districts expose productivity gaps, stimulating pull demand that lets seed firms scale single-variety batches at lower unit costs. Concurrently, village seed banks are reducing last-mile logistics hurdles, enabling rapid replenishment of short-duration hybrids during mid-season replanting windows.
Shift to Climate-Resilient Hybrids in Cereals and Pulses
India’s rain-fed cropland faces heat and moisture volatility that undermines legacy varieties. Till 2024, the National Agricultural Research System released 331 cotton, 239 maize, and 92 soybean cultivars carrying stacked drought, heat, and pest-tolerance traits. Public–private consortia now deploy molecular breeding and doubled haploids to shorten hybrid-development cycles from 11 to 7 years. For pulses, the six-year Mission for Atmanirbharta channels subsidized foundation seed into Tur and Masoor clusters, encouraging seed multipliers to produce stress-adapted hybrids that align with the government’s plan to cut pulse imports to zero by 2030. Gene-edited rice lines using CRISPR, exempted from stringent GM regulations, will enter confined field trials this year. These developments expand the India seed market by widening cultivar portfolios that can withstand multi-factor stress.
Expansion of Protected Cultivation Boosting High-Value Vegetable Seeds
Government credit windows under the Agriculture Infrastructure Fund allow smallholders to finance polyhouse construction at subsidized rates, which in turn unlocks premium seed demand for bell pepper, cucumber, and indeterminate tomato. True potato seed (TPS) technology cuts planting material weight from 2,500 kg of tubers to 25 g of seed per hectare, lowering cold-chain costs and opening export avenues for TPS packets. Field trials of TPS under controlled structures in Maharashtra recorded a yield uptick compared with conventional sprouted tubers. Seed firms are retooling pelleting and priming lines to service this controlled-environment boom, reinforcing the upward pull on the India seed market.
Digital Crop-Survey Data Unlocking Hyper-Local Seed Targeting
Machine-learning dashboards fuse soil, weather, and sowing windows to generate pin-code–level variety recommendations. Participating seed companies already observe 15-20% sales gains in districts where agronomic advisories accompany QR-coded seed packs. Drone subsidies covering 75% of hardware costs accelerate variable-rate seeding, rewarding cultivars optimized for precise plant population. Digitized data trails also simplify e-vouchers and direct-benefit transfers, expanding certified seed affordability among marginal farmers.
Restraints Impact Analysis*
| Restraint | (~) % Impact on CAGR Forecast | Geographic Relevance | Impact Timeline |
|---|---|---|---|
| Counterfeit seed trade and weak last-mile traceability | -0.8% | National, concentrated in Bihar, Uttar Pradesh, and West Bengal | Short term (≤ 2 years) |
| Regulatory uncertainty around GM crop approvals | -0.6% | National, affecting all crop segments | Long term (≥ 4 years) |
| Farm-saved seed dominance in rain-fed zones | -0.4% | Rajasthan, Madhya Pradesh, Maharashtra, and Karnataka | Long term (≥ 4 years) |
| Rising seed-treatment costs are squeezing smallholders | -0.3% | National, acute in marginal farming areas | Medium term (2-4 years) |
| Source: Mordor Intelligence | |||
Counterfeit Seed Trade and Weak Last-Mile Traceability
An estimated 10-15% of seed sold in high-volume states travels outside the formal certification net. Counterfeit packets mimic legitimate brands, eroding farmer trust and depressing repeat purchases of premium hybrids. Distribution chains composed of micro-retailers lack digital inventory systems, impeding batch trace-backs when quality complaints arise. Pilot blockchain registries have demonstrated end-to-end visibility but need nationwide dealer onboarding and smartphone penetration. Until enforcement stiffens, counterfeit leakage will shave points off the India seed market growth outlook.
Regulatory Uncertainty Around GM Crop Approvals
Supreme Court litigation over biosafety assessments maintains a moratorium on new food-crop transgenics. Although Bt cotton remains legal, companies hesitate to commercialize second-generation insect-resistant events or herbicide-tolerant stacks without predictable approval cycles. This policy cloud deflects R&D investment toward traits that stop short of transgenesis, narrowing the technology menu and delaying potential yield leaps. Farmer organizations lobbying for GM mustard and brinjal approvals underscore pent-up demand, but until a clear pathway emerges, the India seed market forfeits the value that biotech traits could unlock.
*Our forecasts treat driver/restraint impacts as directional, not additive. The impact forecasts reflect baseline growth, mix effects, and variable interactions.
Segment Analysis
By Breeding Technology: Hybrid Dominance Reinforced by Climate Resilience
India seed market size for hybrids reflects the segment’s 69.62% revenue share and sets the stage for a 5.60% CAGR through 2031. Yield differentials of 15-35% over open-pollinated lines, combined with built-in pest and drought tolerances, sustain farmer willingness to pay. Non-transgenic hybrids dominate volume because they straddle regulatory clarity and consumer acceptance. Transgenic hybrids contribute under 5% of segment revenue, capped by the GM approval hiatus, yet hold latent upside once policy hurdles ease.
Innovation momentum remains strong. Marker-assisted back-crossing inserts triple-stack resistance against wilt, thrips, and sterility mosaic in pigeon pea hybrids, while doubled-haploid platforms trim generation cycles in maize. Direct-seeded rice hybrids under the RiceTec-Mahyco venture deliver shorter maturity and mechanization compatibility, dovetailing with water-conservation drives. Robust pipeline visibility keeps the India seed market aligned with mechanization and export-oriented agriculture trends.


By Cultivation Mechanism: Protected Cultivation Gains Traction
The India seed market size in open field accounted for a 99.74% share of the India seed market size in 2025, and protected cultivation seeds are forecast to expand at an 10.90% CAGR between 2026 and 2031. Break-even analysis under national subsidy schemes shows growers recouping greenhouse investment within 30 months when leveraging high-density, indeterminate tomato lines that yield 280 metric tons per hectare. Uniformity and disease resistance top trait wish-lists, prompting breeders to re-select parental lines for vertical canopy structure and synchronized fruit setting.
Seed supply chains adapt by introducing small-gram, high-unit-value packets that align with greenhouse transplant schedules. Companies deploy agronomists to steer nutrient and pruning regimes, ensuring genetic potential translates to yield. As greenhouse acreage compounds, protected cultivation’s double-digit growth rate promises a steadily expanding niche within the wider India seed market.
By Crop Type: Row Crop Priority Mirrors National Food Agenda
By crop type, row crops accounted for an 79.95% share of the India seed market size in 2025 and are projected to grow at a 5.45% CAGR through 2031. Cotton holds the largest single‐crop revenue block, buoyed by Bt hybrids and integrated pest-management packages compliant with export lint standards. Corn receives policy tailwinds via ethanol-blending mandates that anticipate a good biofuel share by 2030, intensifying demand for high-starch hybrids.
Vegetable seed revenue, while smaller, outpaces row crops in growth as urban middle-class diets diversify. Compact onion and long-shelf-life tomato hybrids claim greenhouse slots, while TPS makes inroads into both protected and open fields. Pulse hybrids, riding Atmanirbharta incentives, expand breeder-seed orders for Tur and Masoor, albeit from a modest base. These shifts maintain a balanced portfolio that defends the India seed market from commodity price swings.

Geography Analysis
Maharashtra’s 13.45% grip on the India seed market is rooted in its dense web of public institutes and private multiplication farms, and Haryana logs a 6.58% CAGR through 2031. Seed villages in Jalna and Hingoli districts supply cross-pollinated crops, whereas Nanded hosts greenhouse clusters for tomato and capsicum breeder seed.
Gujarat and Karnataka capitalize on processing clusters and special economic zones that expedite export seed shipments. Digital platforms integrate with state procurement portals, enabling real-time aggregation of seed demand and trimming distributor margins. This diffusion of infrastructure underpins the broader expansion of the India seed market.
Emerging eastern and northeastern states register steeper growth off a lower base. Bihar’s new Makhana Board champions specialty aquatic-crop seed systems, while West Bengal’s paddy clusters adopt direct-seeded rice under mechanization drives. Telangana’s agri-biotech parks support gene-editing spin-offs that feed elite lines into local seed firms. These developments broaden geographic resilience and mitigate over-reliance on Western states for seed supply.
Competitive Landscape
Market structure remains fragmented: the top five firms capture a good share of revenue, followed by dozens of regional seed houses. Multinationals such as Bayer AG and Corteva Inc., lean on deep R&D pipelines and proprietary trait stacks, whereas regional champions like Nuziveedu Seeds and Kaveri Seeds wield intimate agro-ecological knowledge and extensive dealer networks. Public institutions license pre-breeder material under liberalized terms, spawning a wave of small and medium enterprises that specialize in niche crops.
Strategic alliances multiply. PowerPollen’s collaboration with VNR Seeds brings pollen-capture technology to corn seed production, boosting hybrid vigor and seed set efficiency. Nuziveedu Seeds established a partnership with the Indian Agricultural Research Institute to develop advanced pigeon pea varieties, enhancing collaboration between public and private research institutions[3]Source: Nuziveedu Seeds, “Collaboration with IARI for Pigeon Pea Improvement,” nuziveeduseeds.com. International Seed Federation and CGIAR’s five-year memorandum streamlines regulatory harmonization, reducing time-to-market for varieties that satisfy multiple national testing regimes. Service start-ups offer drone-based pollination counts and seed-field phenotyping, complementing physical input sales with data subscriptions.
Counterfeit threats and GM policy gridlock shape competitive strategy. Firms invest in tamper-proof holograms and QR codes linked to blockchain registries to safeguard brand equity. Limited scope for trait differentiation in transgenic space intensifies price and service competition in non-GM hybrids. Yet, gene-edited lines now pass under relaxed regulation, positioning innovation-ready companies to steal a march once consumer acceptance crystallizes.
India Seed Industry Leaders
Advanta Seeds - UPL
Bayer AG
Corteva Agriscience
Kaveri Seeds
Syngenta Group
- *Disclaimer: Major Players sorted in no particular order

Recent Industry Developments
- October 2025: The PM Dhan-Dhaanya Krishi Yojana, launched in New Delhi, aims to enhance agricultural development in 100 districts with low productivity through improvements in irrigation systems, seed quality, credit accessibility, and storage infrastructure.
- September 2024: PowerPollen and VNR Seeds initiated a pollination-technology pilot in Indian corn-seed production, targeting superior hybrid yields.


India Seed Market Report Scope
Hybrids, Open Pollinated Varieties & Hybrid Derivatives are covered as segments by Breeding Technology. Open Field, Protected Cultivation are covered as segments by Cultivation Mechanism. Row Crops, Vegetables are covered as segments by Crop Type. Bihar, Gujarat, Haryana, Karnataka, Madhya Pradesh, Maharashtra, Rajasthan, Telangana, Uttar Pradesh, West Bengal are covered as segments by State.Breeding Technology
| Hybrids | Non-Transgenic Hybrids | |
| Transgenic Hybrids | Insect Resistant Hybrids | |
| Open Pollinated Varieties and Hybrid Derivatives | ||
Cultivation Mechanism
| Open Field |
| Protected Cultivation |
Crop Type
| Row Crops | Fiber Crops | Cotton |
| Other Fiber Crops | ||
| Forage Crops | Alfalfa | |
| Forage Corn | ||
| Forage Sorghum | ||
| Other Forage Crops | ||
| Grains and Cereals | Corn | |
| Rice | ||
| Sorghum | ||
| Wheat | ||
| Other Grains and Cereals | ||
| Oilseeds | Canola, Rapeseed and Mustard | |
| Soybean | ||
| Sunflower | ||
| Other Oilseeds | ||
| Pulses | ||
| Vegetables | Brassicas | Cabbage |
| Cauliflower and Broccoli | ||
| Other Brassicas | ||
| Cucurbits | Cucumber and Gherkin | |
| Pumpkin and Squash | ||
| Other Cucurbits | ||
| Roots and Bulbs | Garlic | |
| Onion | ||
| Potato | ||
| Other Roots and Bulbs | ||
| Solanaceae | Chilli | |
| Eggplant | ||
| Tomato | ||
| Other Solanaceae | ||
| Unclassified Vegetables | Asparagus | |
| Lettuce | ||
| Okra | ||
| Peas | ||
| Spinach | ||
| Other Unclassified Vegetables | ||
| Geography | Bihar | |
| Gujarat | ||
| Haryana | ||
| Karnataka | ||
| Madhya Pradesh | ||
| Maharashtra | ||
| Rajasthan | ||
| Telangana | ||
| Uttar Pradesh | ||
| West Bengal | ||
| Other States | ||
| Breeding Technology | Hybrids | Non-Transgenic Hybrids | |
| Transgenic Hybrids | Insect Resistant Hybrids | ||
| Open Pollinated Varieties and Hybrid Derivatives | |||
| Cultivation Mechanism | Open Field | ||
| Protected Cultivation | |||
| Crop Type | Row Crops | Fiber Crops | Cotton |
| Other Fiber Crops | |||
| Forage Crops | Alfalfa | ||
| Forage Corn | |||
| Forage Sorghum | |||
| Other Forage Crops | |||
| Grains and Cereals | Corn | ||
| Rice | |||
| Sorghum | |||
| Wheat | |||
| Other Grains and Cereals | |||
| Oilseeds | Canola, Rapeseed and Mustard | ||
| Soybean | |||
| Sunflower | |||
| Other Oilseeds | |||
| Pulses | |||
| Vegetables | Brassicas | Cabbage | |
| Cauliflower and Broccoli | |||
| Other Brassicas | |||
| Cucurbits | Cucumber and Gherkin | ||
| Pumpkin and Squash | |||
| Other Cucurbits | |||
| Roots and Bulbs | Garlic | ||
| Onion | |||
| Potato | |||
| Other Roots and Bulbs | |||
| Solanaceae | Chilli | ||
| Eggplant | |||
| Tomato | |||
| Other Solanaceae | |||
| Unclassified Vegetables | Asparagus | ||
| Lettuce | |||
| Okra | |||
| Peas | |||
| Spinach | |||
| Other Unclassified Vegetables | |||
| Geography | Bihar | ||
| Gujarat | |||
| Haryana | |||
| Karnataka | |||
| Madhya Pradesh | |||
| Maharashtra | |||
| Rajasthan | |||
| Telangana | |||
| Uttar Pradesh | |||
| West Bengal | |||
| Other States | |||


Market Definition
- Commercial Seed - For the purpose of this study, only commercial seeds have been included as part of the scope. Farm-saved Seeds, which are not commercially labeled are excluded from scope, even though a minor percentage of farm-saved seeds are exchanged commercially among farmers. The scope also excludes vegetatively reproduced crops and plant parts, which may be commercially sold in the market.
- Crop Acreage - While calculating the acreage under different crops, the Gross Cropped Area has been considered. Also known as Area Harvested, according to the Food & Agricultural Organization (FAO), this includes the total area cultivated under a particular crop across seasons.
- Seed Replacement Rate - Seed Replacement Rate is the percentage of area sown out of the total area of crop planted in the season by using certified/quality seeds other than the farm-saved seed.
- Protected Cultivation - The report defines protected cultivation as the process of growing crops in a controlled environment. This includes greenhouses, glasshouses, hydroponics, aeroponics, or any other cultivation system that protects the crop against any abiotic stress. However, cultivation in an open field using plastic mulch is excluded from this definition and is included under open field.
| Keyword | Definition |
|---|---|
| Row Crops | These are usually the field crops which include the different crop categories like grains & cereals, oilseeds, fiber crops like cotton, pulses, and forage crops. |
| Solanaceae | These are the family of flowering plants which includes tomato, chili, eggplants, and other crops. |
| Cucurbits | It represents a gourd family consisting of about 965 species in around 95 genera. The major crops considered for this study include Cucumber & Gherkin, Pumpkin and squash, and other crops. |
| Brassicas | It is a genus of plants in the cabbage and mustard family. It includes crops such as carrots, cabbage, cauliflower & broccoli. |
| Roots & Bulbs | The roots and bulbs segment includes onion, garlic, potato, and other crops. |
| Unclassified Vegetables | This segment in the report includes the crops which don’t belong to any of the above-mentioned categories. These include crops such as okra, asparagus, lettuce, peas, spinach, and others. |
| Hybrid Seed | It is the first generation of the seed produced by controlling cross-pollination and by combining two or more varieties, or species. |
| Transgenic Seed | It is a seed that is genetically modified to contain certain desirable input and/or output traits. |
| Non-Transgenic Seed | The seed produced through cross-pollination without any genetic modification. |
| Open-Pollinated Varieties & Hybrid Derivatives | Open-pollinated varieties produce seeds true to type as they cross-pollinate only with other plants of the same variety. |
| Other Solanaceae | The crops considered under other Solanaceae include bell peppers and other different peppers based on the locality of the respective countries. |
| Other Brassicaceae | The crops considered under other brassicas include radishes, turnips, Brussels sprouts, and kale. |
| Other Roots & Bulbs | The crops considered under other roots & bulbs include Sweet Potatoes and cassava. |
| Other Cucurbits | The crops considered under other cucurbits include gourds (bottle gourd, bitter gourd, ridge gourd, Snake gourd, and others). |
| Other Grains & Cereals | The crops considered under other grains & cereals include Barley, Buck Wheat, Canary Seed, Triticale, Oats, Millets, and Rye. |
| Other Fibre Crops | The crops considered under other fibers include Hemp, Jute, Agave fibers, Flax, Kenaf, Ramie, Abaca, Sisal, and Kapok. |
| Other Oilseeds | The crops considered under other oilseeds include Ground nut, Hempseed, Mustard seed, Castor seeds, safflower seeds, Sesame seeds, and Linseeds. |
| Other Forage Crops | The crops considered under other forages include Napier grass, Oat grass, White clover, Ryegrass, and Timothy. Other forage crops were considered based on the locality of the respective countries. |
| Pulses | Pigeon peas, Lentils, Broad and horse beans, Vetches, Chickpeas, Cowpeas, Lupins, and Bambara beans are the crops considered under pulses. |
| Other Unclassified Vegetables | The crops considered under other unclassified vegetables include Artichokes, Cassava Leaves, Leeks, Chicory, and String beans. |


Research Methodology
Mordor Intelligence follows a four-step methodology in all our reports.
- Step-1: IDENTIFY KEY VARIABLES: In order to build a robust forecasting methodology, the variables and factors identified in Step-1 are tested against available historical market numbers. Through an iterative process, the variables required for market forecast are set and the model is built on the basis of these variables.
- Step-2: Build a Market Model: Market-size estimations for the forecast years are in nominal terms. Inflation is not a part of the pricing, and the average selling price (ASP) is kept constant throughout the forecast period.
- Step-3: Validate and Finalize: In this important step, all market numbers, variables and analyst calls are validated through an extensive network of primary research experts from the market studied. The respondents are selected across levels and functions to generate a holistic picture of the market studied.
- Step-4: Research Outputs: Syndicated Reports, Custom Consulting Assignments, Databases, and Subscription Platforms


