Market Overview
| Study Period | 2021 - 2031 |
|---|---|
| Forecast Data Period | 2026 - 2031 |
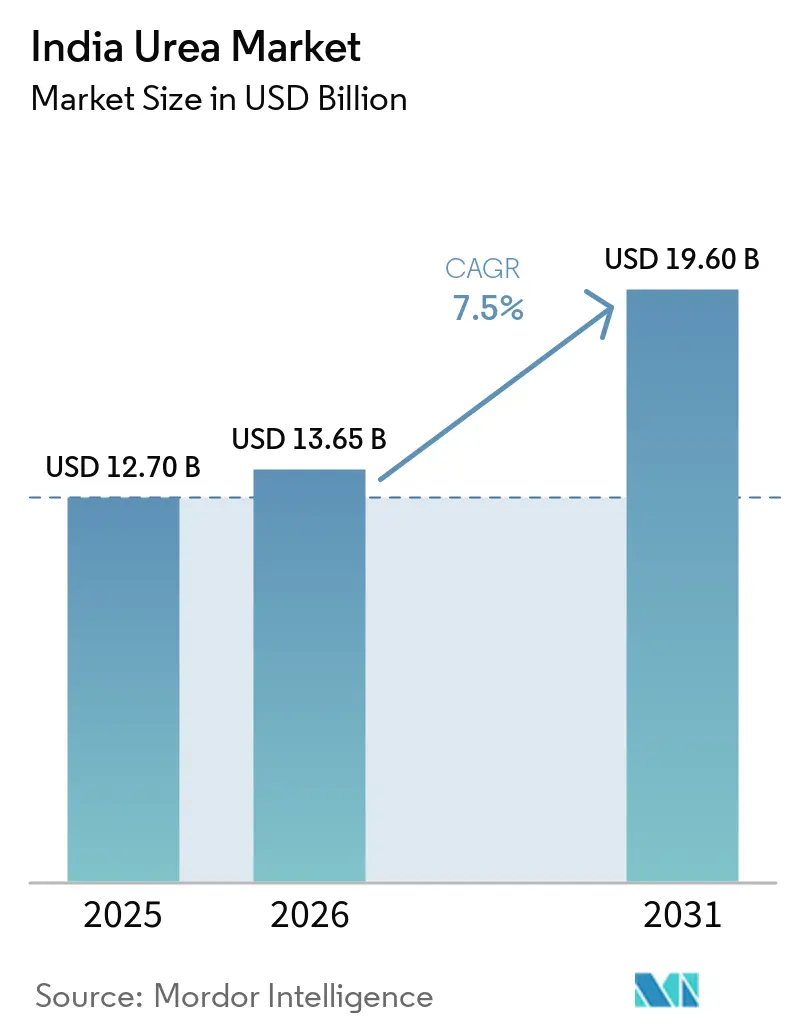
| Base Year Market Size (2025) | USD 12.70 Billion |
| Market Size (2026) | USD 13.65 Billion |
| Market Size (2031) | USD 19.60 Billion |
| Growth Rate (2026 - 2031) | 7.50% CAGR |
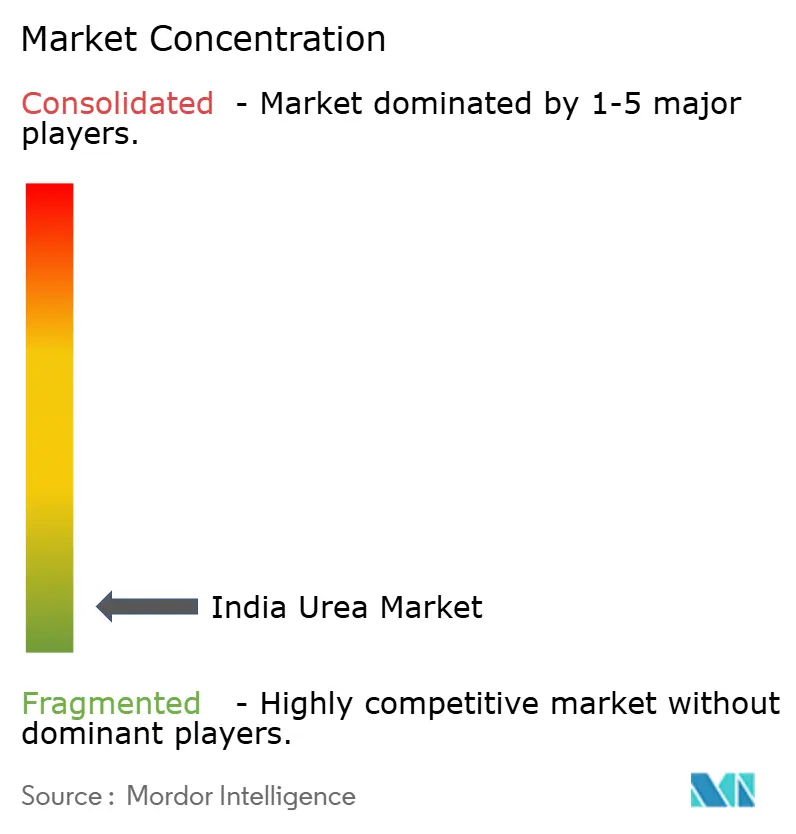
| Market Concentration | Low |
Major Players*Disclaimer: Major Players sorted in no particular order Image © Mordor Intelligence. Reuse requires attribution under CC BY 4.0. | |
India Urea Market Analysis by Mordor Intelligence
The India urea market size was valued at USD 12.70 billion in 2025 and estimated to grow from USD 13.65 billion in 2026 to reach USD 19.60 billion by 2031, at a CAGR of 7.50% during the forecast period (2026-2031). The expansion reflects a shift from bulk nutrient supply toward precisely formulated products that improve soil health and crop-specific performance. Policy continuity under the Nutrient-Based Subsidy (NBS) scheme, the rapid spread of micro-irrigation, and the widening reach of e-commerce are improving the accessibility and economics of specialty formulations. Concurrently, corporate and contract farming models favor yield-maximizing inputs, while domestic polymer investments are easing cost pressures on controlled-release fertilizers. These developments place the India urea market on a robust growth trajectory.
Key Report Takeaways
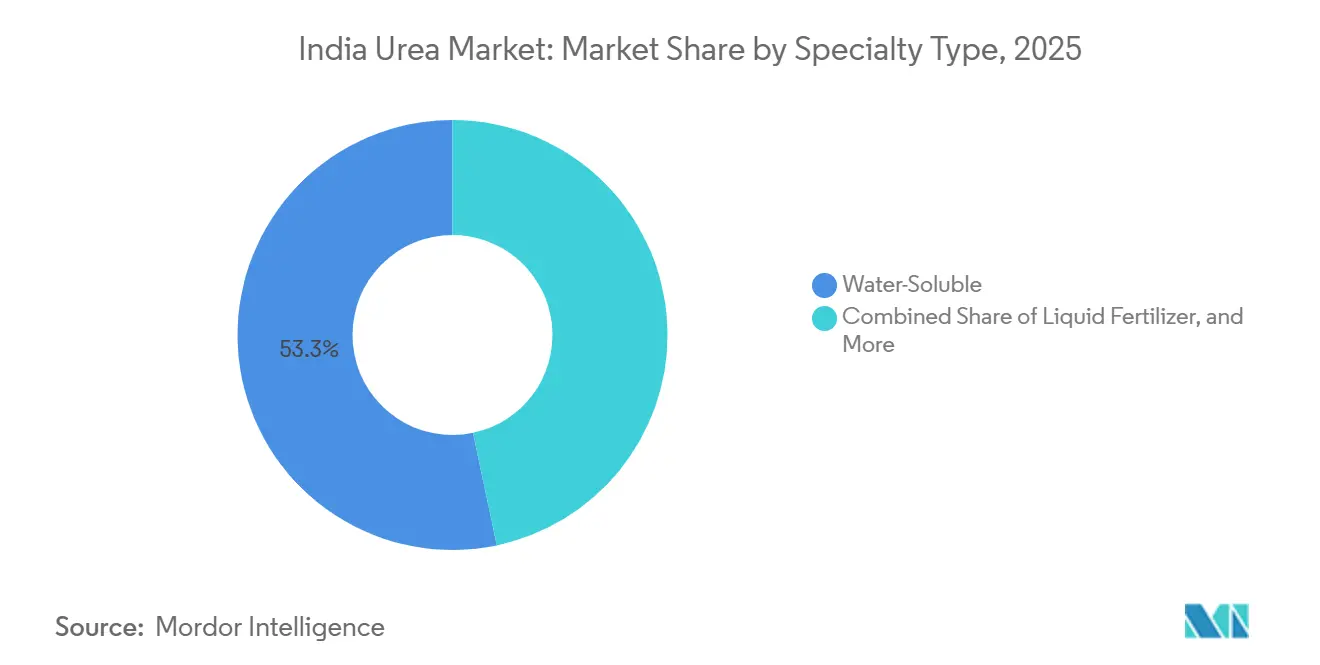
- By specialty type, water-soluble fertilizers accounted for 53.3% of the India urea market share in 2025, while controlled-release fertilizers are projected to be the fastest-growing segment, registering a CAGR of 8.6% during 2026–2031.
- By crop type, field crops accounted for 88.4% of the India urea market size in 2025, whereas horticultural crops are projected to be the fastest-growing segment, expanding at a CAGR of 8.1% during 2026–2031.
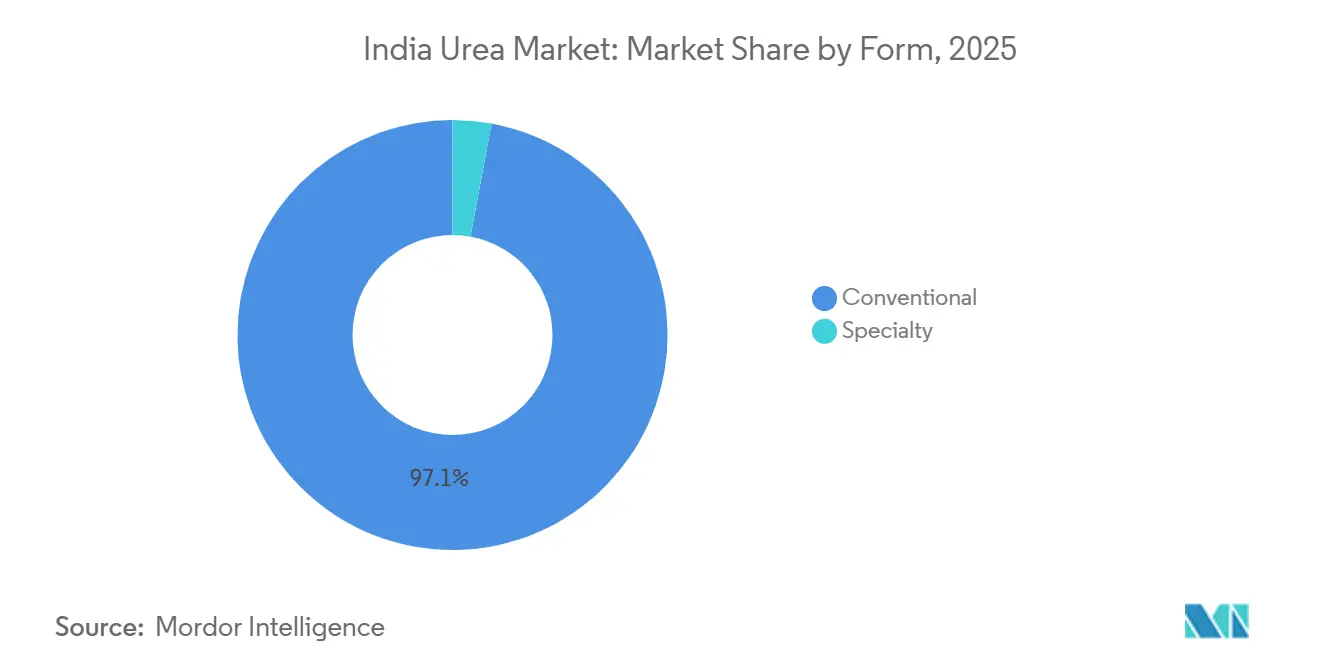
- By form, conventional urea accounted for the largest share of the market in 2025, representing 97.1%, while specialty urea is projected to be the fastest-growing segment, registering a CAGR of 8.2% during 2026–2031.
Note: Market size and forecast figures in this report are generated using Mordor Intelligence’s proprietary estimation framework, updated with the latest available data and insights as of January 2026.
India Urea Market Trends and Insights
Drivers Impact Analysis*
| Driver | (~) % Impact on CAGR Forecast | Geographic Relevance | Impact Timeline |
|---|---|---|---|
| Nitrogen stands out as the most widely used nutrient in field crop cultivation | +1.8% | National, with higher impact in northern states | Medium term (2-4 years) |
| Adoption of micro-irrigation systems boosting water-soluble demand | +1.5% | National, concentrated in Maharashtra, Gujarat, Karnataka | Long term (≥ 4 years) |
| Expansion of horticulture acreage with protected cultivation | +1.2% | National, with early gains in Punjab, Haryana, Maharashtra | Long term (≥ 4 years) |
| Growth of ag-input e-commerce platforms improving last-mile access | +0.9% | National, with higher penetration in tier-2 and tier-3 cities | Short term (≤ 2 years) |
| Corporate/contract farming models favoring yield-maximizing inputs | +0.7% | National, concentrated in Punjab, Haryana, Uttar Pradesh | Medium term (2-4 years) |
| Domestic polymer capacity additions lowering CRF production cost | +0.6% | National, with manufacturing hubs in Gujarat, Tamil Nadu | Medium term (2-4 years) |
| Source: Mordor Intelligence | |||


Nitrogen stands out as the most widely used nutrient in field crop cultivation
Nitrogen, with an average application rate of 223.5 kg/ha, stands out as the most widely utilized nutrient. As a primary nutrient, nitrogen is crucial for high-yield crops, notably rice, which dominates India's agricultural landscape. Yet, a nationwide struggle with nitrogen deficiencies is undermining rice productivity. Concerns about India's soil health are underscored in the "State of Biofertilizers and Organic Fertilizers" report. It highlights an alarming trend: a heavy dependence on chemical fertilizers, with 97.0%, 83.0%, and 71.0% of tested soils exhibiting deficiencies in nitrogen, phosphorus, and potassium, respectively. Wheat and rice, staples on both domestic and global tables, grapple with challenges stemming from multiple nutrient deficiencies. Grains and cereals, as field crops, have an insatiable demand for primary nutrients, especially nitrogen fertilizers. With these crops being extensively cultivated across India, the depletion of the soil's nutrient content is becoming increasingly pronounced.
Adoption of Micro-Irrigation Systems Boosting Water-Soluble Demand
Micro-irrigation coverage expansion under the Pradhan Mantri Krishi Sinchayee Yojana has created a structural demand shift toward water-soluble fertilizers, with drip and sprinkler systems requiring fully dissolved nutrients to prevent clogging and ensure uniform distribution. The scheme's allocation of INR 4,000 crore (USD 478.06 million) for 2024-25 targets coverage of 1.5 million hectares, directly translating to increased fertigation demand. In 2024, urea was priced at USD 328.25 per metric tonne, yet it boasts a high nutrient use efficiency. This efficiency becomes economically compelling for high-value crops where input costs represent a smaller share of total production expenses. Companies like Haifa Group have demonstrated yield improvements of 15-20% through precision fertigation protocols, establishing technical credibility that drives adoption among progressive farmers.
Expansion of Horticulture Acreage With Protected Cultivation
The protected cultivation area has expanded significantly, driven by government schemes promoting polyhouse and greenhouse adoption for high-value crops. The National Horticulture Mission's subsidy structure provides 50% cost support for protected structures, making precision nutrition economically viable for smallholder farmers. Controlled environment agriculture demands precise nutrient management to optimize plant growth cycles and prevent salt accumulation in soilless media. This application environment favors controlled-release fertilizers and liquid formulations that provide predictable nutrient release patterns. The 8.6% CAGR for controlled-release fertilizers reflects this structural demand shift, as protected cultivation operators prioritize yield consistency over input cost minimization. Regulatory compliance with food safety standards in export-oriented horticulture further drives the adoption of traceable, residue-free nutrition programs.
Growth of Ag-Input E-Commerce Platforms Improving Last-Mile Access
Digital agriculture platforms have transformed specialty fertilizer distribution by overcoming traditional channel limitations and enabling direct farmer engagement. IFFCO's e-Bazar platform and private players like BigHaat have created omnichannel distribution models that reduce intermediary markups while providing technical advisory services. E-commerce penetration addresses the historical challenge of specialty fertilizer availability in remote markets, where traditional dealers often lack inventory depth for niche products. These platforms leverage data analytics to provide crop-specific recommendations and dosage guidance, reducing the technical barrier to specialty fertilizer adoption. The integration of soil testing services with product recommendations creates a consultative selling model that justifies premium pricing while improving farmer outcomes. However, regulatory frameworks for online fertilizer sales remain evolving, requiring compliance with state-specific licensing requirements.
Restraints Impact Analysis*
| Restraint | (~) % Impact on CAGR Forecast | Geographic Relevance | Impact Timeline |
|---|---|---|---|
| High price premium versus conventional urea | -1.4% | National, with higher impact in price-sensitive eastern states | Short term (≤ 2 years) |
| Fragmented distribution enabling counterfeit products | -0.9% | National, concentrated in unorganized retail channels | Medium term (2-4 years) |
| Limited agronomic advisory causing crop-burn risk | -0.6% | National, with higher impact in less developed agricultural regions | Long term (≥ 4 years) |
| Import-dependence for coating materials and FX volatility | -0.5% | National, affecting manufacturers with high import content | Short term (≤ 2 years) |
| Source: Mordor Intelligence | |||
High Price Premium Versus Conventional Urea
The 2-4x price differential between specialty fertilizers and conventional urea creates a significant adoption barrier, particularly among price-sensitive smallholder farmers who represent 86% of India's agricultural population. In 2024, urea's wholesale price hovered around USD 328.2 per metric tonne, allowing farmers to avoid significant increases in working capital, even with enhanced nutrient use efficiency. For nearly a decade, the effective price has remained stable, granting nitrogen-heavy nutrition programs an artificial cost edge. The economic justification for specialty fertilizers requires demonstration of yield improvements that offset higher input costs, a value proposition that becomes challenging during periods of commodity price volatility. Credit constraints among smallholder farmers further limit their ability to invest in premium inputs, despite potential long-term soil health benefits.
Fragmented Distribution Enabling Counterfeit Products
India's fragmented fertilizer distribution network, comprising over 200,000 retail outlets with limited technical expertise, creates vulnerabilities for counterfeit product infiltration that undermines farmer confidence in specialty fertilizers. The complexity of specialty formulations makes quality verification difficult at the retail level, enabling spurious products that fail to deliver promised performance outcomes. Regulatory enforcement remains inconsistent across states, with quality control mechanisms varying significantly in effectiveness and coverage. The Essential Commodities Act's penalties for adulteration provide legal deterrence, but implementation gaps persist due to resource constraints at district levels. This quality integrity challenge is particularly acute for water-soluble fertilizers, where solubility and nutrient content verification requires specialized testing equipment unavailable to most retailers.
*Our forecasts treat driver/restraint impacts as directional, not additive. The impact forecasts reflect baseline growth, mix effects, and variable interactions.
Segment Analysis
By Specialty Type: Water-Soluble Fertilizers Drive Market Leadership
Water-soluble fertilizers are the largest segment, command 53.3% of the India urea market share in 2025, reflecting their compatibility with modern irrigation systems and their superior nutrient-use efficiency, which justifies premium pricing. The segment's dominance stems from its alignment with the expansion of micro-irrigation and the growth of protected cultivation, where precise nutrient delivery becomes critical for optimizing crop performance. Controlled-release fertilizers represent the fastest-growing specialty type, with a 8.6% CAGR through 2031, driven by their ability to reduce application frequency and minimize nutrient losses from leaching and volatilization. Slow-release fertilizers maintain a smaller but stable market presence, primarily serving turf and ornamental applications where extended feeding periods are valued.
Liquid fertilizers occupy a niche position focused on foliar applications and fertigation systems, offering rapid nutrient uptake and flexibility in formulation adjustments. IFFCO's development of nano fertilizers represents an emerging category that could disrupt traditional specialty types, with their nano urea and nano DAP products demonstrating 20-year patent protection and government approval for commercial launch. The regulatory framework under the Fertilizer Control Order 1985 governs product specifications and quality standards, with recent amendments introducing streamlined registration processes for water-soluble fertilizers that enable faster market entry for innovative formulations.


By Crop Type: Field Crops Dominate Despite Horticulture Growth Potential
Field crops are the largest segment, accounting for 88.4% of the India urea market size in 2025, driven by their extensive acreage and the increasing adoption of precision agriculture practices among progressive farmers. Rice and wheat cultivation, covering over 100 million hectares combined, represents the largest-volume opportunity despite lower per-hectare specialty fertilizer intensity than in horticultural crops. [1]Source: National Horticulture Board, “Statistics on Protected Cultivation,” nhb.gov.inCotton and sugarcane production have emerged as early adopters of controlled-release fertilizers, where input cost optimization and labor savings justify premium pricing for extended-release formulations.
Horticultural crops demonstrate the fastest growth potential, with a 8.1% CAGR through 2031, reflecting their intensive nutrient requirements and higher economic returns that support premium input adoption. Protected cultivation of vegetables and flowers creates concentrated demand for specialty fertilizers, as greenhouse operators require precise nutrient management to optimize yield and quality. Turf and ornamental applications represent a specialized segment focused on golf courses, landscaping, and urban green spaces, where aesthetic considerations and maintenance efficiency drive adoption of controlled-release fertilizers. The segment's growth is supported by increasing urbanization and infrastructure development that expands landscaping requirements.
By Form: Conventional Dominance With Specialty Growth Acceleration
Conventional forms maintain a 97.1% market share in 2025, reflecting established supply chain infrastructure and farmers' familiarity with granular fertilizer applications. The conventional segment's dominance is reinforced by existing equipment compatibility and application practices that require minimal changes to farming operations. However, specialty forms are projected to grow at an 8.2% CAGR through 2031, driven by their superior performance characteristics and alignment with precision agriculture trends.
Liquid formulations offer advantages in fertigation systems and foliar applications, enabling rapid nutrient uptake and precise dosage control that optimizes plant nutrition timing. Coated fertilizers represent advanced technology applications where polymer or sulfur coatings control nutrient release rates, reducing application frequency and improving nutrient use efficiency. The regulatory framework supports specialty form development through streamlined registration processes, with water-soluble fertilizers benefiting from general specifications that enable 30-day market entry timelines, compared to the 804-day average registration period for conventional products.
Geography Analysis
Northern states, including Punjab, Haryana, and Uttar Pradesh, benefit from well-established extension services, high irrigation intensity, and historically higher fertilizer application rates. Progressive cooperatives run demonstration plots that showcase yield responses to controlled-release urea, helping to convert risk-averse growers. Specialty adoption is further encouraged by sustained procurement of paddy and wheat at minimum support prices, which cushions farmers’ working-capital outlays.
Western India, spearheaded by Maharashtra and Gujarat, is the fastest-growing regional cluster. Strong state incentives for micro-irrigation, combined with significant fruit and vegetable acreage, create a natural fit for water-soluble and nano formulations. Maharashtra alone has 2.5 million hectares under drip systems, a fact that underpins double-digit demand growth for fertigation grades. Cooperative and private players jointly run mobile soil-testing labs, reinforcing evidence-based fertilizer decisions.
Southern states, including Karnataka, Andhra Pradesh, and Tamil Nadu, exhibit balanced adoption across specialty types. High-value chili, grape, and banana crops dominate nutrient budgets, fostering experimentation with polymer-coated and liquid blends. The recent inclusion of organic carbon enhancers derived from compressed biogas within the Fertilizer Control Order offers southern producers an additional lever to integrate sustainability credentials into their nutrient programs. Eastern states remain nascent markets but represent latent potential as irrigation projects and e-commerce platforms unlock access[2]Source: Ministry of New and Renewable Energy, “Compressed Biogas Manure Guidelines,” mnre.gov.in .
Competitive Landscape
The India urea market exhibits extreme fragmentation, which reflects the sector's highly competitive structure. This fragmentation stems from the market's diverse product requirements, regional distribution preferences, and the presence of numerous small-scale manufacturers serving local markets. Indian Farmers Fertiliser Cooperative Limited leads, leveraging its extensive cooperative network and recent investments in nano fertilizer technology, including a 20-year patent for stable nano nitrogen-phosphorus fertilizer formulations.
Strategic patterns focus on backward integration and technology differentiation, with companies like Coromandel International investing INR 750 crore (USD 83.7 million) in phosphoric acid and NPK granulation capacity to reduce import dependence and improve cost competitiveness[3]Source: Coromandel International Limited, “Investor Presentation FY 2025,” coromandel.co.in. White-space opportunities exist in precision agriculture services, with companies expanding beyond product supply to offer soil testing, drone-based application services, and agronomic advisory that create recurring revenue streams.
Emerging disruptors include technology-enabled startups focusing on customized fertilizer blends and direct-to-farmer distribution models that bypass traditional channel intermediaries. The regulatory framework under the Fertilizer Control Order 1985 governs market entry and product standards, with recent streamlining of registration processes for water-soluble fertilizers creating opportunities for faster innovation cycles.
India Urea Industry Leaders
Chambal Fertilizers & Chemicals Ltd
Indian Farmers Fertiliser Cooperative Limited
Mangalore Chemicals & Fertilizers Ltd.
National Fertilizers Ltd
Yara International ASA
- *Disclaimer: Major Players sorted in no particular order

Recent Industry Developments
- February 2025: India plans to establish its eighth new urea plant since 2019, as announced in the Union Budget 2025. With this move, the nation is poised to achieve self-sufficiency in urea production by the close of 2025.
- July 2024: In the country, six Nano Urea plants have been established, boasting an annual capacity of 26.62 crore bottles (each 500 ml). Additionally, four Nano DAP plants have been set up, with a combined annual capacity of 10.74 crore bottles, available in both 500 and 1000 ml sizes.
- July 2023: Urea Gold, an innovative fertilizer, is touted to be more economical and efficient than its neem-coated counterpart. It boosts nitrogen use efficiency in plants, curtails fertilizer consumption, and elevates crop quality.


India Urea Market Report Scope
The India Urea Market Report is Segmented by Specialty Type (Controlled-Release Fertilizers, Slow-Release Fertilizers, Liquid Fertilizers, and Water-Soluble Fertilizers), by Crop Type (Field Crops, Horticultural Crops, and Turf and Ornamental), and by Form (Conventional and Specialty). The Market Forecasts are Provided in Terms of Value (USD) and Volume (metric Tons).
Speciality Type
| CRF | Polymer Coated |
| Polymer-Sulfur Coated | |
| Others | |
| Liquid Fertilizer | |
| SRF | |
| Water Soluble |
Crop Type
| Field Crops |
| Horticultural Crops |
| Turf & Ornamental |
Form
| Conventional |
| Specialty |
| Speciality Type | CRF | Polymer Coated |
| Polymer-Sulfur Coated | ||
| Others | ||
| Liquid Fertilizer | ||
| SRF | ||
| Water Soluble | ||
| Crop Type | Field Crops | |
| Horticultural Crops | ||
| Turf & Ornamental | ||
| Form | Conventional | |
| Specialty |


Market Definition
- MARKET ESTIMATION LEVEL - Market Estimations for various types of fertilizers has been done at the product-level and not at the nutrient-level.
- NUTRIENT TYPES COVERED - Urea: Conventional Fertilizer, Controlled-release Urea Fertilizers, and Slow-Release Urea Fertilizer
- AVERAGE NUTRIENT APPLICATION RATE - This refers to the average volume of nutrient consumed per hectare of farmland in each country.
- CROP TYPES COVERED - Field Crops: Cereals, Pulses, Oilseeds, and Fiber Crops Horticulture: Fruits, Vegetables, Plantation Crops and Spices, Turf Grass and Ornamentals
| Keyword | Definition |
|---|---|
| Fertilizer | Chemical substance applied to crops to ensure nutritional requirements, available in various forms such as granules, powders, liquid, water soluble, etc. |
| Specialty Fertilizer | Used for enhanced efficiency and nutrient availability applied through soil, foliar, and fertigation. Includes CRF, SRF, liquid fertilizer, and water soluble fertilizers. |
| Controlled-Release Fertilizers (CRF) | Coated with materials such as polymer, polymer-sulfur, and other materials such as resins to ensure nutrient availability to the crop for its entire life cycle. |
| Slow-Release Fertilizers (SRF) | Coated with materials such as sulfur, neem, etc., to ensure nutrient availability to the crop for a longer period. |
| Foliar Fertilizers | Consist of both liquid and water soluble fertilizers applied through foliar application. |
| Water-Soluble Fertilizers | Available in various forms including liquid, powder, etc., used in foliar and fertigation mode of fertilizer application. |
| Fertigation | Fertilizers applied through different irrigation systems such as drip irrigation, micro irrigation, sprinkler irrigation, etc. |
| Anhydrous Ammonia | Used as fertilizer, directly injected into the soil, available in gaseous liquid form. |
| Single Super Phosphate (SSP) | Phosphorus fertilizer containing only phosphorus which has lesser than or equal to 35%. |
| Triple Super Phosphate (TSP) | Phosphorus fertilizer containing only phosphorus greater than 35%. |
| Enhanced Efficiency Fertilizers | Fertilizers coated or treated with additional layers of various ingredients to make it more efficient compared to other fertilizers. |
| Conventional Fertilizer | Fertilizers applied to crops through traditional methods including broadcasting, row placement, ploughing soil placement, etc. |
| Chelated Micronutrients | Micronutrient fertilizers coated with chelating agents such as EDTA, EDDHA, DTPA, HEDTA, etc. |
| Liquid Fertilizers | Available in liquid form, majorly used for application of fertilizers to crops through foliar and fertigation. |


Research Methodology
Mordor Intelligence follows a four-step methodology in all our reports.
- Step-1: IDENTIFY KEY VARIABLES: In order to build a robust forecasting methodology, the variables and factors identified in Step-1 are tested against available historical market numbers. Through an iterative process, the variables required for market forecast are set and the model is built on the basis of these variables.
- Step-2: Build a Market Model: Market-size estimations for the forecast years are in nominal terms. Inflation is not a part of the pricing, and the average selling price (ASP) is kept constant throughout the forecast period for each country.
- Step-3: Validate and Finalize: In this important step, all market numbers, variables and analyst calls are validated through an extensive network of primary research experts from the market studied. The respondents are selected across levels and functions to generate a holistic picture of the market studied.
- Step-4: Research Outputs: Syndicated Reports, Custom Consulting Assignments, Databases & Subscription Platforms


