Market Overview
| Study Period | 2021 - 2031 |
|---|---|
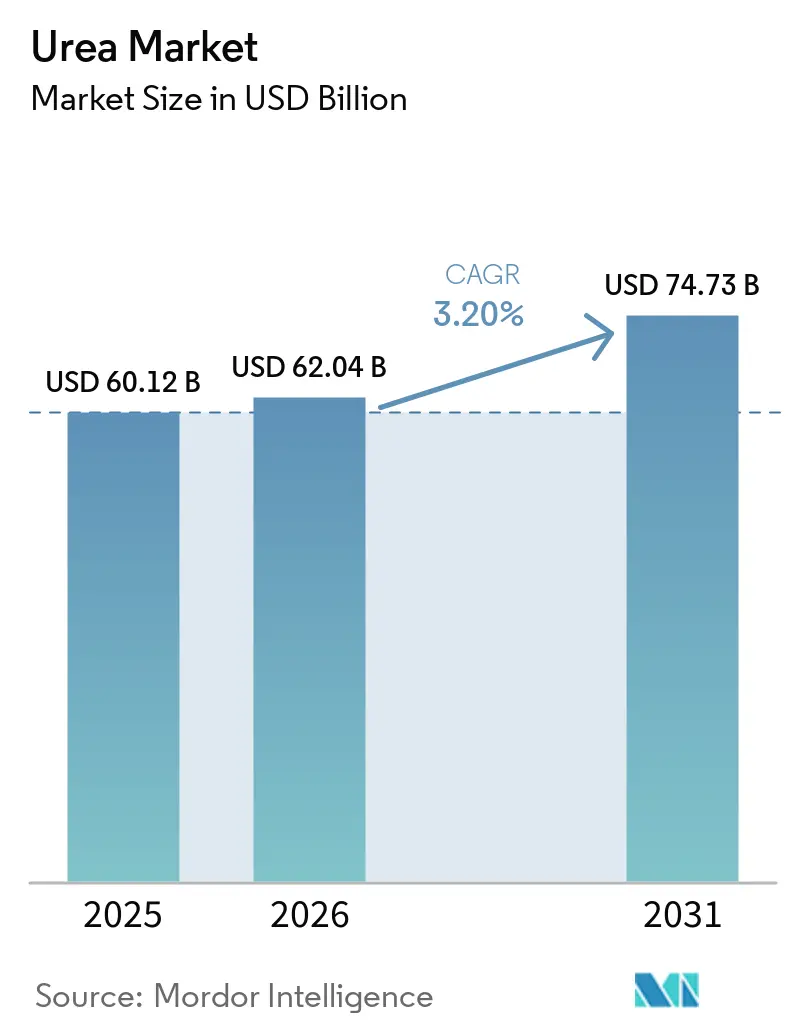
| Market Size (2026) | USD 62.04 Billion |
| Market Size (2031) | USD 74.73 Billion |
| Growth Rate (2026 - 2031) | 3.20% CAGR |
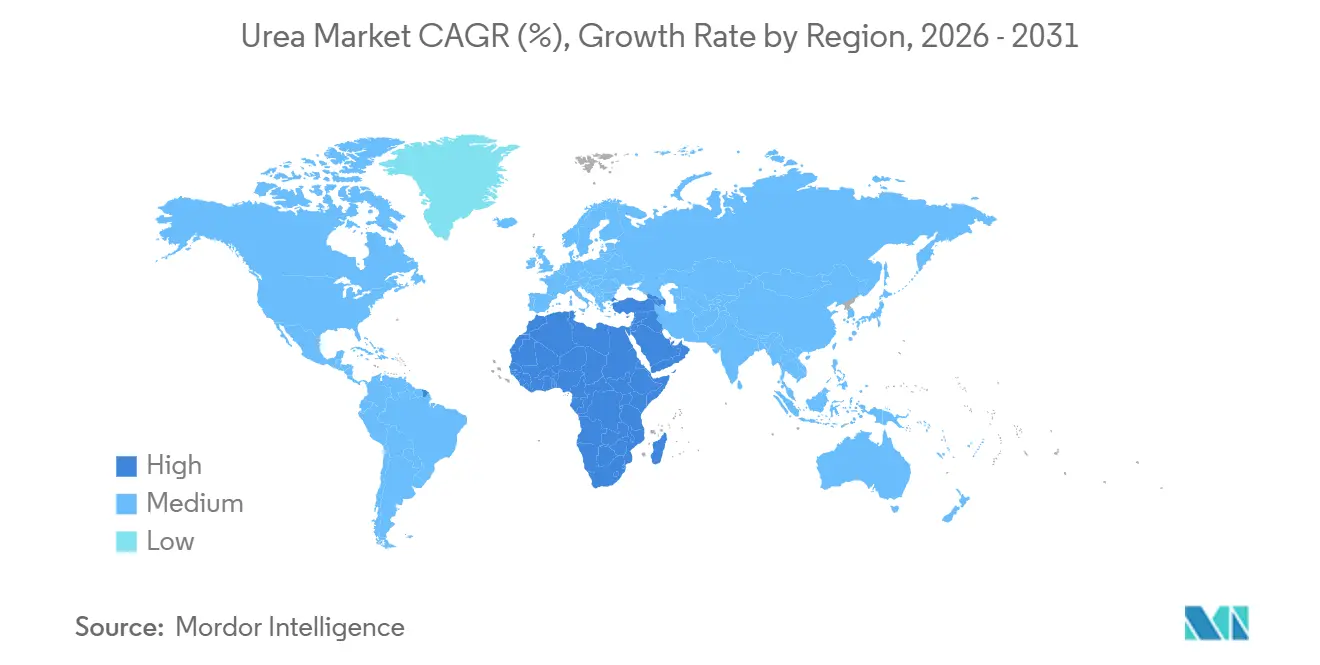
| Fastest Growing Market | Africa |
| Largest Market | Asia-Pacific |
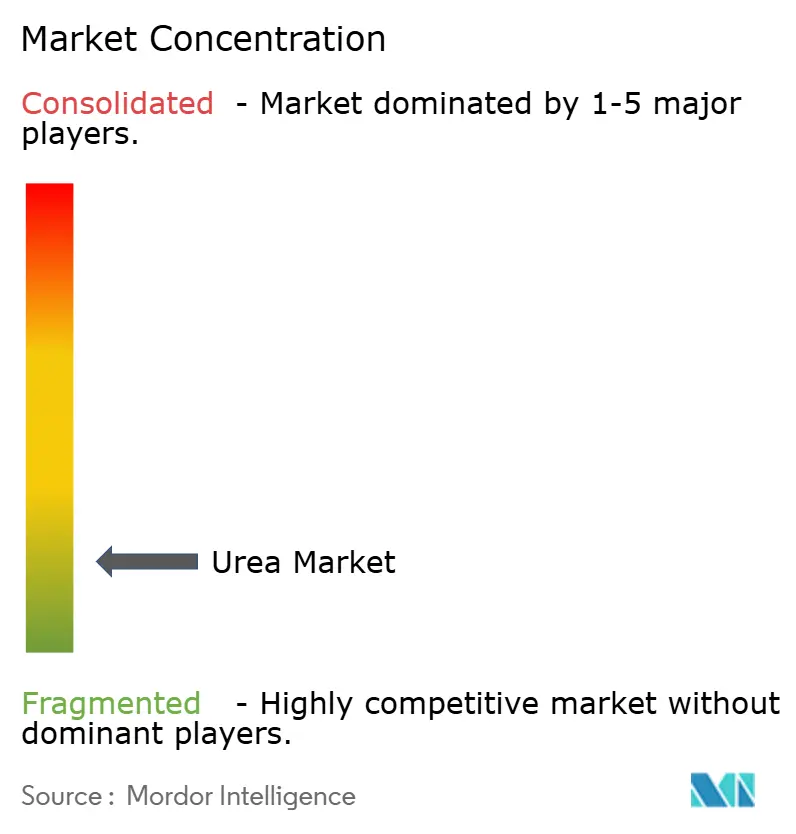
| Market Concentration | Medium |
Major Players *Disclaimer: Major Players sorted in no particular order Image © Mordor Intelligence. Reuse requires attribution under CC BY 4.0. | |
Urea Market Analysis by Mordor Intelligence
The urea market was valued at USD 60.12 billion in 2025 and is projected to grow from USD 62.04 billion in 2026 to USD 74.73 billion by 2031, registering a CAGR of 3.20% from 2026 to 2031. This growth is driven by consistent demand from global food production systems, where nitrogen remains critical for cereal yields and overall farm productivity. Urea maintains a significant role in agricultural input decisions due to its 46% nitrogen content, the highest among solid nitrogen fertilizers, which ensures cost-effective transport, storage, and application across the market. The near-term outlook for the urea market is influenced by factors such as trade route disruptions, fluctuations in natural gas costs, and stricter nitrogen-use regulations in Europe, all of which are impacting production economics and buyer preferences. Simultaneously, the market is witnessing opportunities for premium products and lower-emission production methods. Major producers are investing in specialty grades, low-carbon ammonia partnerships, and new export-oriented capacity expansions, contributing to the evolving dynamics of the urea market.
Key Report Takeaways
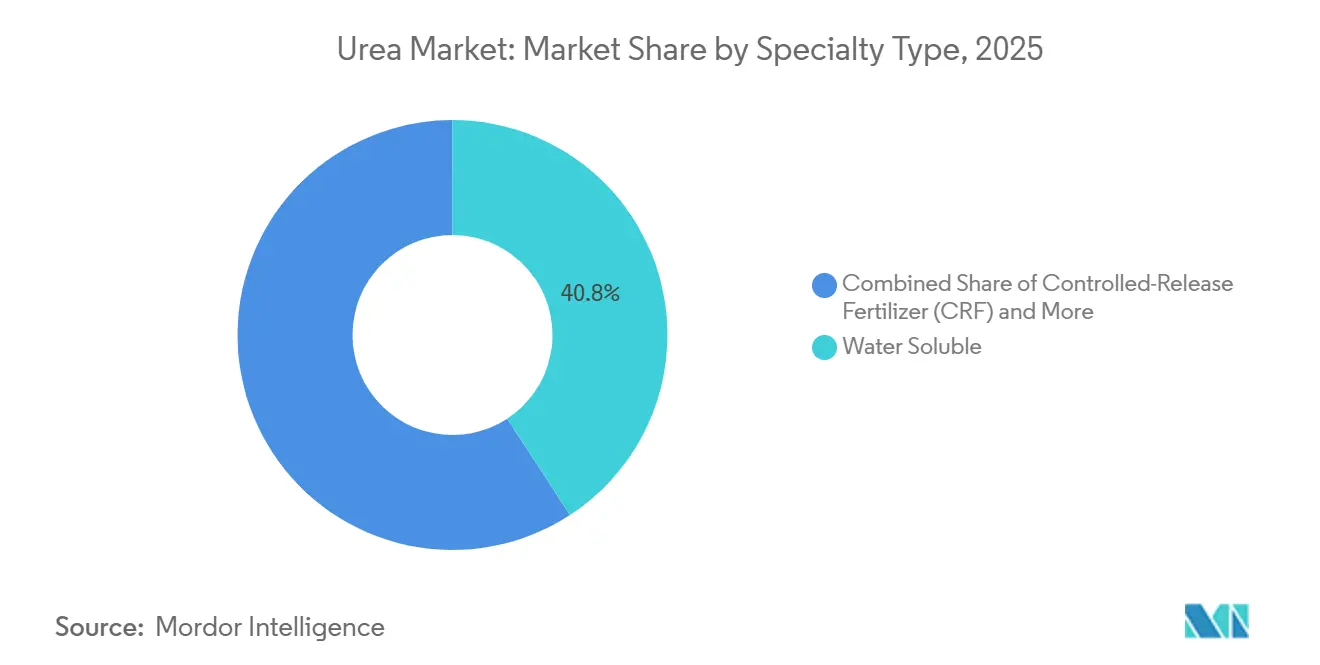
- By specialty type, the urea market share for the water soluble segment accounted for the largest 40.8% in 2025, while the urea market size for the controlled-release fertilizers segment is projected to grow at the fastest CAGR of 7.6% from 2026 to 2031.
- By crop type, field crops held the largest 77.6% share in 2025, whereas horticultural crops are forecast to grow at the fastest CAGR of 8.9% from 2026 to 2031.
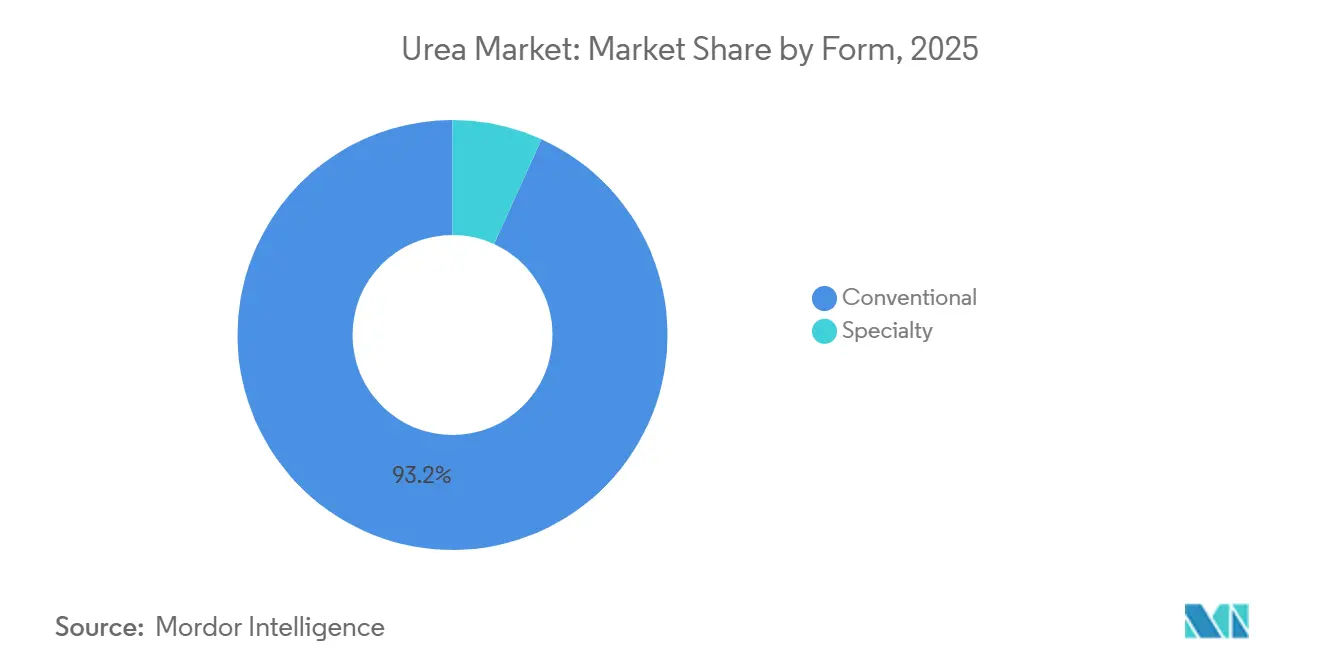
- By form, the conventional segment accounted for the largest 93.2% share in 2025, and the specialty segment is projected to grow at the fastest CAGR of 7.0% from 2026 to 2031.
- By geography, Asia-Pacific held the largest 55.1% share in 2025, and Africa is projected to grow at the fastest CAGR of 9.5% from 2026 to 2031.
Note: Market size and forecast figures in this report are generated using Mordor Intelligence’s proprietary estimation framework, updated with the latest available data and insights as of 2026.
Global Urea Market Trends and Insights
Drivers Impact Analysis*
| Driver | (~) % Impact on CAGR Forecast | Geographic Relevance | Impact Timeline |
|---|---|---|---|
| Intensifying cereal crop cultivation | +1.4% | Asia-Pacific core, Sub-Saharan Africa, and South America | Medium term (2-4 years) |
| Cost advantage of urea versus other nitrogen fertilizers | +1.3% | Global with strongest effect in South Asia and Middle East | Short term (≤2 years) |
| Fertilizer demand growth from population and dietary shifts | +1.0% | Global concentrated in Africa and South Asia | Long term (≥4 years) |
| Granular urea adoption in precision farming | +0.7% | North America, Western Europe, and Australia | Medium term (2-4 years) |
| Renewable-hydrogen-based green urea capacity additions | +0.6% | Europe and Middle East with pilot projects in Asia-Pacific | Long term (≥4 years) |
| Port-side modular urea plants lowering logistics costs | +0.4% | Import-dependent regions including Africa, Southeast Asia, and South America | Medium term (2-4 years) |
| Source: Mordor Intelligence | |||


Intensifying Cereal Crop Cultivation
Global demand for urea is driven by the extensive cultivation of major cereal crops, which are the largest consumers of nitrogen fertilizers. According to the Food and Agriculture Organization (FAO), the total harvested area of wheat, rice, and maize reached 601.9 million hectares in 2024, marking a 0.52% increase compared to 2023[1]Source: Food and Agriculture Organization, “FAOSTAT Crops and Livestock Products Database (QCL),” FAO, fao.org.. This growth in cereal cultivation highlights the ongoing efforts to enhance food security and maintain agricultural productivity in key producing regions. Urea continues to be the preferred nitrogen fertilizer for these crops due to its 46% nitrogen content, cost-effectiveness, and suitability for large-scale field crop production, thereby sustaining global demand.
Cost Advantage of Urea Versus Other Nitrogen Fertilizers
The urea market benefits from its high nutrient concentration and cost-effectiveness compared to alternative nitrogen fertilizers. With a nitrogen content of 46%, urea enables growers to transport, store, and apply more nitrogen per unit of product than fertilizers with lower nitrogen concentrations. This characteristic is particularly significant in price-sensitive agricultural regions, where fertilizer purchasing decisions are influenced by nutrient cost efficiency. For instance, according to Yara International ASA, calcium ammonium nitrate (CAN) contains only 27% nitrogen, significantly less than urea[2]Source: Yara International ASA, “Calcium Ammonium Nitrate (CAN),” Yara, yara.com.. The higher nutrient density of urea minimizes logistics and handling requirements per unit of nitrogen delivered, enhancing its competitiveness in major agricultural markets and supporting consistent global demand.
Granular Urea Adoption in Precision Farming
In 2025, variable-rate technology was used on 68% of Midwestern corn and soybean acres, up from 54% two years prior[3]Source: United States Department of Agriculture, “Precision Agriculture and Nitrogen Management 2025,” USDA, usda.gov. This growth highlights the growing adoption of precision agriculture practices to optimize input use and improve yields. Granular urea accounted for the majority of solid nitrogen sales within these systems, as its free-flowing particles prevent segregation in pneumatic applicators, ensuring uniform application. Field trials conducted by Deere & Company demonstrated that its ExactApply sprayer reduced waste when used with granular grades, showcasing the potential for cost savings and environmental benefits. Although the product is priced premium, it enhances placement accuracy across application zones ranging from 80 to 180 kilograms per hectare, contributing to better crop performance. While premium adoption remains limited in price-sensitive regions, facilities with granulation capacity achieve higher margins in North America and Western Europe, driven by the demand for advanced agricultural inputs.
Renewable-Hydrogen-Based Green Urea Capacity Additions
Green ammonia capacity reached 4.1 million metric tons in 2025, and projects totaling 6.8 million metric tons are scheduled before 2028[4]Source: International Renewable Energy Agency, “Green Hydrogen and Ammonia Production 2025,” IRENA, irena.org . Yara International ASA’s 75,000 metric tons facility in Norway achieved the first commercial batch of carbon-neutral urea under European Union certification in early 2025. OCI N.V. is investing USD 500 million in Texas to produce 1.1 million metric tons of green ammonia by 2027, with 60% earmarked for urea, targeting a USD 40 to USD 60 premium from California and European buyers. These initiatives gain ground as carbon border fees loom, though subsidy shifts remain a threat. Nonetheless, low-carbon supply is set to reshape procurement strategies in regulated markets.
Restraints Impact Analysis*
| Restraint | (~) % Impact on CAGR Forecast | Geographic Relevance | Impact Timeline |
|---|---|---|---|
| Natural gas price volatility raising production costs | -1.2% | Global with greatest stress in Europe and import-dependent Asia | Short term (≤2 years) |
| Tightening runoff and greenhouse gas regulations on nitrogen use | -0.9% | North America and European Union with new rules emerging in Australia | Medium term (2-4 years) |
| Substitution threat from ammonium nitrate and nitrogenous fertilizers | -0.7% | Europe, North America, and selected South American markets | Medium term (2-4 years) |
| Geopolitical trade-route disruptions | -0.6% | Global with sharp impacts in Africa, South America, and Southeast Asia | Short term (≤2 years) |
| Source: Mordor Intelligence | |||
Natural Gas Price Volatility Raising Production Costs
Natural gas accounts for a significant share of urea cash costs in gas-intensive regions. European facilities ceased production in early 2025 due to high hub prices, underscoring the impact of energy costs on production economics. In the United States, Henry Hub averages are forecast at USD 3.80 per million British thermal units in 2026, with potential fluctuations that could result in a 160% spread, complicating budget planning and introducing significant uncertainty for producers. According to CF Industries Holdings, Inc., an increase in natural gas prices adds to its cost curve, underscoring the critical impact of energy prices on profitability. As a result, margin visibility depends on fuel contracts or on integrating renewable gas, both of which require substantial capital investments that many mid-tier companies may lack, potentially limiting their competitiveness in the market.
Geopolitical Trade-Route Disruptions
Sanctions on Russian and Belarusian fertilizers have redirected 12 million metric tons since 2024, compelling Brazil to procure additional volumes from the Middle East and China at a freight premium. This shift has significantly impacted global trade flows, increasing dependency on alternative suppliers and raising transportation costs. Security concerns in the Red Sea caused delays of up to 15 days for shipments from the Arabian Gulf to East Africa in 2025, further straining supply chains. Producers situated along alternative routes redirected supplies to capitalize on spot premiums, emphasizing the advantages of diversified portfolios while leaving import-dependent nations vulnerable to abrupt shortages. These developments underscore the critical need for resilient supply chain strategies to mitigate risks associated with geopolitical and logistical disruptions.
*Our forecasts treat driver/restraint impacts as directional, not additive. The impact forecasts reflect baseline growth, mix effects, and variable interactions.
Segment Analysis
By Specialty Type: Water Soluble Anchors Revenue While Controlled-Release Fertilizer (CRF) Drives Premium Growth
The water soluble urea segment accounted for the largest market share, 40.8%, in 2025. This dominance is attributed to its extensive use in fertigation, greenhouse cultivation, and high-value horticultural systems, where complete solubility and uniform nutrient delivery are critical. Growers increasingly favor water soluble grades due to their compatibility with modern irrigation systems and their ability to support precise nitrogen management. Demand remains particularly strong in protected cultivation and intensive crop production, where accurate application significantly impacts productivity and crop quality. These factors continue to establish water soluble urea as the leading value contributor within the specialty segment.
The controlled-release fertilizer (CRF) segment is projected to grow at the fastest CAGR of 7.6% from 2026 to 2031. This growth is driven by rising demand for products that enhance nitrogen-use efficiency and minimize nutrient losses through leaching and volatilization. Controlled-release technologies ensure consistent nutrient availability throughout crop development while reducing the frequency of applications. Adoption is increasing in horticulture, turf, ornamental, and precision farming systems, where efficiency and sustainability are prioritized. Slow-release fertilizers address intermediate needs between conventional and premium products, while liquid formats benefit from the growing implementation of precision irrigation and nutrient management practices.


By Crop Type: Field Crops Lock in Volume While Horticulture Reshapes the Value Equation
Field crops accounted for the largest market share of 77.6% in 2025. This segment remains the primary consumer of urea due to the extensive cultivation of cereals, oilseeds, cotton, and other staple crops in major agricultural regions. Nitrogen is a critical nutrient influencing productivity in these systems, making urea a widely used fertilizer. The large-scale cultivation and established fertilization practices in this segment continue to drive strong volume demand. The scale of field crop production provides a stable foundation for the market, ensuring that urea remains a key component of global nitrogen fertilizer consumption.
Horticultural crops are projected to grow at the fastest CAGR of 8.9% from 2026 to 2031. This growth is driven by the increasing production of fruits, vegetables, and specialty crops, which require precise nutrient management and higher-value agricultural inputs. Growers in this segment are increasingly adopting specialty urea formulations to enhance nutrient availability, improve crop quality, and boost production efficiency. Additionally, the expansion of protected cultivation, greenhouse farming, and high-intensity production systems supports this growth. While turf and ornamental crops represent a smaller segment, they contribute to the demand for premium products, reinforcing the trend toward value-added nitrogen solutions.
By Form: Conventional Products Dominate Volume While Specialty Formats Lead Growth Trajectory
Conventional urea accounted for the largest 93.2% market share in 2025. This dominance is attributed to its affordability, widespread availability, and extensive use in large-scale agricultural systems. It remains the primary nitrogen source for growers seeking cost-effective fertilization solutions, particularly in developing agricultural economies. Established distribution networks and familiarity among farmers further strengthen its position. While interest in advanced formulations is growing, conventional urea continues to be the preferred choice for broad-acre crop systems due to its accessibility and favorable cost-to-nutrient ratio.
The specialty urea segment is projected to grow at the fastest CAGR of 7.0% from 2026 to 2031. This growth is driven by the increasing adoption of precision agriculture, environmental stewardship initiatives, and the demand for improved nutrient-use efficiency. Enhanced-efficiency products, including controlled-release, slow-release, and water-soluble formulations, are gaining popularity in production systems where nutrient losses pose significant economic challenges. Adoption is particularly strong in high-value crops, intensive farming operations, and regions with stricter environmental regulations. As awareness of nutrient management benefits grows, specialty urea products are projected to capture a larger share of market value while complementing the demand for conventional fertilizers.
Geography Analysis
Asia-Pacific accounted for the largest market share of 55.1% in 2025. This leadership position is attributed to extensive agricultural activities, large cereal cultivation areas, and strong fertilizer consumption in countries such as China, India, and Southeast Asia. Government support programs, food security initiatives, and high cropping intensity sustain the demand for nitrogen fertilizers in the region. Additionally, the region's diverse agricultural base, including cereals, plantation crops, fruits, and vegetables, further strengthens its position. Asia-Pacific's scale and consumption patterns make it a key player in global urea trade flows, production planning, and pricing dynamics.
Africa is projected to grow at the fastest CAGR of 9.5% from 2026 to 2031, emerging as the fastest-growing regional market. This growth is driven by increasing food demand, improved fertilizer accessibility, and government initiatives aimed at enhancing agricultural productivity. Many countries in the region are focusing on boosting crop yields through better nutrient management and broader fertilizer adoption. Expanding distribution networks and investments in agricultural development programs further support market growth. South America remains a significant consumer of nitrogen fertilizers due to its extensive grain production systems. Meanwhile, the Middle East continues to play a critical role in the global supply chain, leveraging its competitive nitrogen fertilizer production base to meet international demand.
Europe and North America are key markets due to their impact on technology adoption, environmental regulations, and advanced nutrient management practices. Producers and growers in these regions are prioritizing improvements in nitrogen-use efficiency through precision agriculture and enhanced-efficiency fertilizers. Regulatory frameworks aimed at reducing emissions and managing nutrients are driving the adoption of specialty formulations. Additionally, advanced agricultural infrastructure and significant research investments are fostering innovation in fertilizer application methods. These elements establish both regions as significant contributors to the adoption of premium products and sustainable nutrient management practices.

Competitive Landscape
Market concentration remains low, with the top five suppliers, Yara International ASA, CF Industries Holdings, Inc., OCI N.V., SABIC Agri-Nutrients Company, and Nutrien Ltd., holding a limited share of the market. Yara International ASA, CF Industries Holdings, Inc., and OCI N.V. operate fully integrated ammonia-urea complexes that enable them to switch between products as spreads change, thereby cushioning margin shocks. Indian cooperatives, notably Indian Farmers Fertiliser Cooperative Limited (IFFCO) and Krishak Bharati Cooperative Limited (KRIBHCO), sell most of their output under long-term government contracts that guarantee stable cash flow even during price downturns.
Middle Eastern companies, such as SABIC Agri-Nutrients Company and Qatar Fertiliser Company (QAFCO), benefit from access to competitively priced natural gas, enabling lower urea production costs and enhancing their competitiveness in global export markets. Strategic investments are increasingly directed toward back-integration into green ammonia production to improve sustainability and reduce carbon intensity within nitrogen fertilizer value chains. These companies are also focusing on enhancing operational efficiency through plant modernization, process optimization, and capacity expansion projects. Their ability to produce large volumes of cost-effective urea ensures supply reliability and underscores the region's significance in global urea trade and pricing dynamics.
Technology adoption among mid-tier players is progressing rapidly. Indian Farmers Fertiliser Cooperative Limited (IFFCO) sold 26.5 million bottles of Nano Urea Plus in 2025, replacing conventional nutrients, highlighting its potential to significantly impact volume metrics. Emerging companies like Fertiberia are integrating renewable energy into ammonia production units to supply premium-priced, low-carbon products to Europe and North Africa, underscoring the growing importance of carbon intensity alongside price and logistics as key differentiators.
Urea Industry Leaders
CF Industries Holdings, Inc.
Nutrien Ltd.
OCI N.V.
SABIC Agri-Nutrients Company
Yara International ASA
- *Disclaimer: Major Players sorted in no particular order

Recent Industry Developments
- December 2025: Uralchem Group has signed a Memorandum of Understanding (MoU) with Indian public sector undertakings Rashtriya Chemicals and Fertilizers (RCF), National Fertilizers Limited (NFL), and Indian Potash Limited (IPL) to develop a urea joint venture plant in Russia with a production capacity of 1.8–2 million metric tons. The project aims to ensure long-term fertilizer supplies for India and will be financed by Indian companies, utilizing ammonia sourced from Togliattiazot JSC.
- December 2025: Italian engineering firm Saipem has secured two significant contracts from Dangote Fertilizer to deliver technology and engineering services for six high-capacity urea units. These units include four in Nigeria and two in Ethiopia, each with a capacity of 4,235 metric tons per day (MTPD). The plants will utilize Snamprogetti's patented urea technology, significantly enhancing Africa's overall urea production capacity.
- December 2025: Adecoagro S.A. acquired a 90% equity stake in Profertil S.A. for approximately USD 1.1 billion, becoming the controlling shareholder of South America's largest granular urea producer and enhancing its position in the regional nitrogen fertilizer market.
- October 2025: United Capital Fertilizer (UCF) has launched a USD 641 million urea manufacturing plant in Chilanga, Zambia. This facility represents a significant step in Zambia’s plan to double its fertilizer production and establish itself as a regional agricultural hub. The plant aims to reduce Zambia’s dependence on imports.


Global Urea Market Report Scope
Urea fertilizer is a high-concentration, nitrogen-rich organic compound, chemically known as carbamide, with the formula CO(NH2)2. It is the most widely used solid nitrogenous fertilizer globally. The urea market report is segmented by specialty type (controlled-release fertilizer (CRF), liquid fertilizer, slow-release fertilizer (SRF), and water soluble), by crop type (field crops, horticultural crops, and turf and ornamental), by form (conventional and specialty), and by geography (North America, Europe, Asia-Pacific, South America, Middle East, and Africa). The market forecasts are provided in terms of value (USD) and volume (metric tons).
By Specialty Type
| Controlled-Release Fertilizer (CRF) | Polymer Coated |
| Polymer-Sulfur Coated | |
| Others | |
| Liquid Fertilizer | |
| Slow-Release Fertilizer (SRF) | |
| Water Soluble |
By Crop Type
| Field Crops |
| Horticultural Crops |
| Turf and Ornamental |
By Form
| Conventional |
| Specialty |
By Geography
| North America | Canada |
| Mexico | |
| United States | |
| Rest of North America | |
| Europe | France |
| Germany | |
| Italy | |
| Netherlands | |
| Russia | |
| Spain | |
| Ukraine | |
| United Kingdom | |
| Rest of Europe | |
| Asia-Pacific | Australia |
| Bangladesh | |
| China | |
| India | |
| Indonesia | |
| Japan | |
| Pakistan | |
| Philippines | |
| Thailand | |
| Vietnam | |
| Rest of Asia-Pacific | |
| South America | Argentina |
| Brazil | |
| Rest of South America | |
| Middle East | Turkey |
| Saudi Arabia | |
| Rest of Middle East | |
| Africa | Nigeria |
| South Africa | |
| Rest of Africa |
| By Specialty Type | Controlled-Release Fertilizer (CRF) | Polymer Coated |
| Polymer-Sulfur Coated | ||
| Others | ||
| Liquid Fertilizer | ||
| Slow-Release Fertilizer (SRF) | ||
| Water Soluble | ||
| By Crop Type | Field Crops | |
| Horticultural Crops | ||
| Turf and Ornamental | ||
| By Form | Conventional | |
| Specialty | ||
| By Geography | North America | Canada |
| Mexico | ||
| United States | ||
| Rest of North America | ||
| Europe | France | |
| Germany | ||
| Italy | ||
| Netherlands | ||
| Russia | ||
| Spain | ||
| Ukraine | ||
| United Kingdom | ||
| Rest of Europe | ||
| Asia-Pacific | Australia | |
| Bangladesh | ||
| China | ||
| India | ||
| Indonesia | ||
| Japan | ||
| Pakistan | ||
| Philippines | ||
| Thailand | ||
| Vietnam | ||
| Rest of Asia-Pacific | ||
| South America | Argentina | |
| Brazil | ||
| Rest of South America | ||
| Middle East | Turkey | |
| Saudi Arabia | ||
| Rest of Middle East | ||
| Africa | Nigeria | |
| South Africa | ||
| Rest of Africa | ||


Market Definition
- MARKET ESTIMATION LEVEL - Market Estimations for various types of fertilizers has been done at the product-level and not at the nutrient-level.
- NUTRIENT TYPES COVERED - Urea: Conventional Fertilizer, Controlled-release Urea Fertilizers, and Slow-Release Urea Fertilizer
- AVERAGE NUTRIENT APPLICATION RATE - This refers to the average volume of nutrient consumed per hectare of farmland in each country.
- CROP TYPES COVERED - Field Crops: Cereals, Pulses, Oilseeds, and Fiber Crops Horticulture: Fruits, Vegetables, Plantation Crops and Spices, Turf Grass and Ornamentals
| Keyword | Definition |
|---|---|
| Fertilizer | Chemical substance applied to crops to ensure nutritional requirements, available in various forms such as granules, powders, liquid, water soluble, etc. |
| Specialty Fertilizer | Used for enhanced efficiency and nutrient availability applied through soil, foliar, and fertigation. Includes CRF, SRF, liquid fertilizer, and water soluble fertilizers. |
| Controlled-Release Fertilizers (CRF) | Coated with materials such as polymer, polymer-sulfur, and other materials such as resins to ensure nutrient availability to the crop for its entire life cycle. |
| Slow-Release Fertilizers (SRF) | Coated with materials such as sulfur, neem, etc., to ensure nutrient availability to the crop for a longer period. |
| Foliar Fertilizers | Consist of both liquid and water soluble fertilizers applied through foliar application. |
| Water-Soluble Fertilizers | Available in various forms including liquid, powder, etc., used in foliar and fertigation mode of fertilizer application. |
| Fertigation | Fertilizers applied through different irrigation systems such as drip irrigation, micro irrigation, sprinkler irrigation, etc. |
| Anhydrous Ammonia | Used as fertilizer, directly injected into the soil, available in gaseous liquid form. |
| Single Super Phosphate (SSP) | Phosphorus fertilizer containing only phosphorus which has lesser than or equal to 35%. |
| Triple Super Phosphate (TSP) | Phosphorus fertilizer containing only phosphorus greater than 35%. |
| Enhanced Efficiency Fertilizers | Fertilizers coated or treated with additional layers of various ingredients to make it more efficient compared to other fertilizers. |
| Conventional Fertilizer | Fertilizers applied to crops through traditional methods including broadcasting, row placement, ploughing soil placement, etc. |
| Chelated Micronutrients | Micronutrient fertilizers coated with chelating agents such as EDTA, EDDHA, DTPA, HEDTA, etc. |
| Liquid Fertilizers | Available in liquid form, majorly used for application of fertilizers to crops through foliar and fertigation. |


Research Methodology
Mordor Intelligence follows a four-step methodology in all our reports.
- Step-1: IDENTIFY KEY VARIABLES: In order to build a robust forecasting methodology, the variables and factors identified in Step-1 are tested against available historical market numbers. Through an iterative process, the variables required for market forecast are set and the model is built on the basis of these variables.
- Step-2: Build a Market Model: Market-size estimations for the forecast years are in nominal terms. Inflation is not a part of the pricing, and the average selling price (ASP) is kept constant throughout the forecast period for each country.
- Step-3: Validate and Finalize: In this important step, all market numbers, variables and analyst calls are validated through an extensive network of primary research experts from the market studied. The respondents are selected across levels and functions to generate a holistic picture of the market studied.
- Step-4: Research Outputs: Syndicated Reports, Custom Consulting Assignments, Databases & Subscription Platforms


