
India Student Accommodation Market Size and Share
Market Overview
| Study Period | 2020 - 2031 |
|---|---|
| Forecast Data Period | 2026 - 2031 |
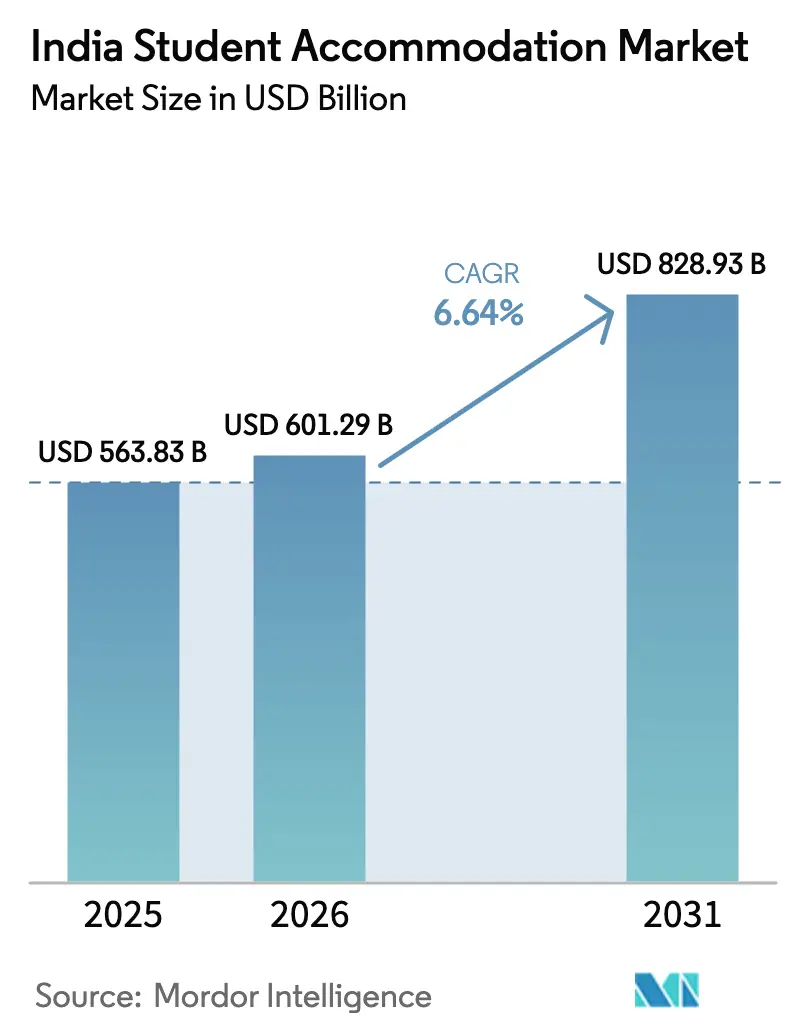
| Base Year Market Size (2025) | USD 563.83 Billion |
| Market Size (2026) | USD 601.29 Billion |
| Market Size (2031) | USD 828.93 Billion |
| Growth Rate (2026 - 2031) | 6.64 % |
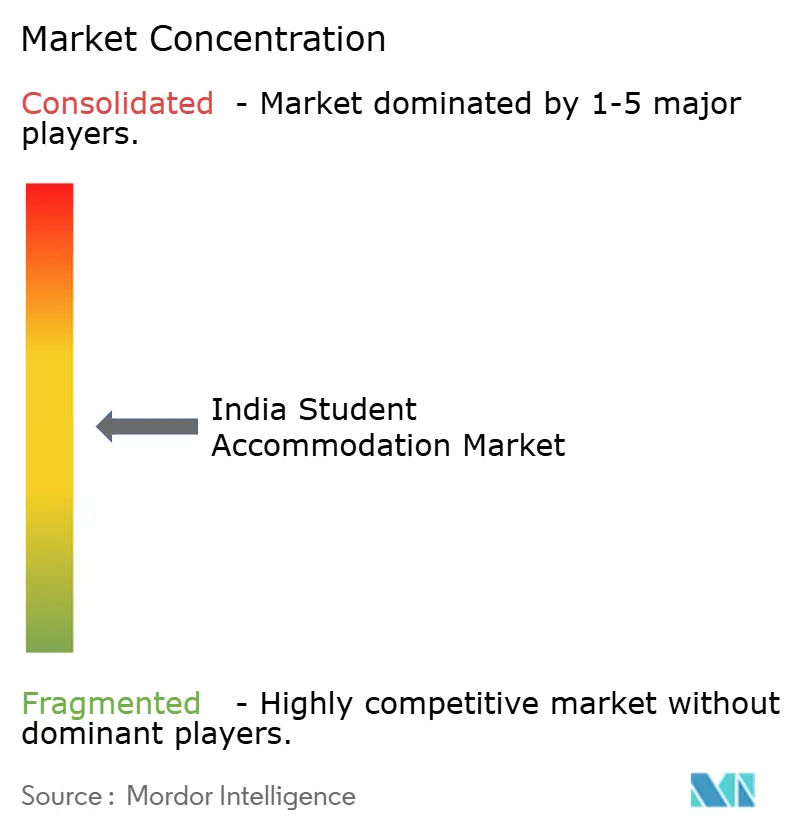
| Market Concentration | Medium |
Major Players *Disclaimer: Major Players sorted in no particular order Image © Mordor Intelligence. Reuse requires attribution under CC BY 4.0. | |
India Student Accommodation Market Analysis by Mordor Intelligence
The India Student Accommodation Market size was valued at USD 563.83 billion in 2025 and estimated to grow from USD 601.29 billion in 2026 to reach USD 828.93 billion by 2031, at a CAGR of 6.64% during the forecast period (2026-2031). Robust enrollment growth, targeted policy incentives, and parental willingness to pay for professionally managed housing underpin demand expansion. Tier I metropolitan zones command the largest share, while Tier II corridors deliver the fastest growth as new expressways and campus roll-outs spread the addressable base. Purpose-built operators are consolidating assets to scale service quality, and technology adoption, from smart access control to predictive maintenance, is streamlining operations and elevating student experience. Green building certification is becoming a competitive differentiator in the Indian student accommodation market as environmental awareness rises among universities and residents.
Key Report Takeaways
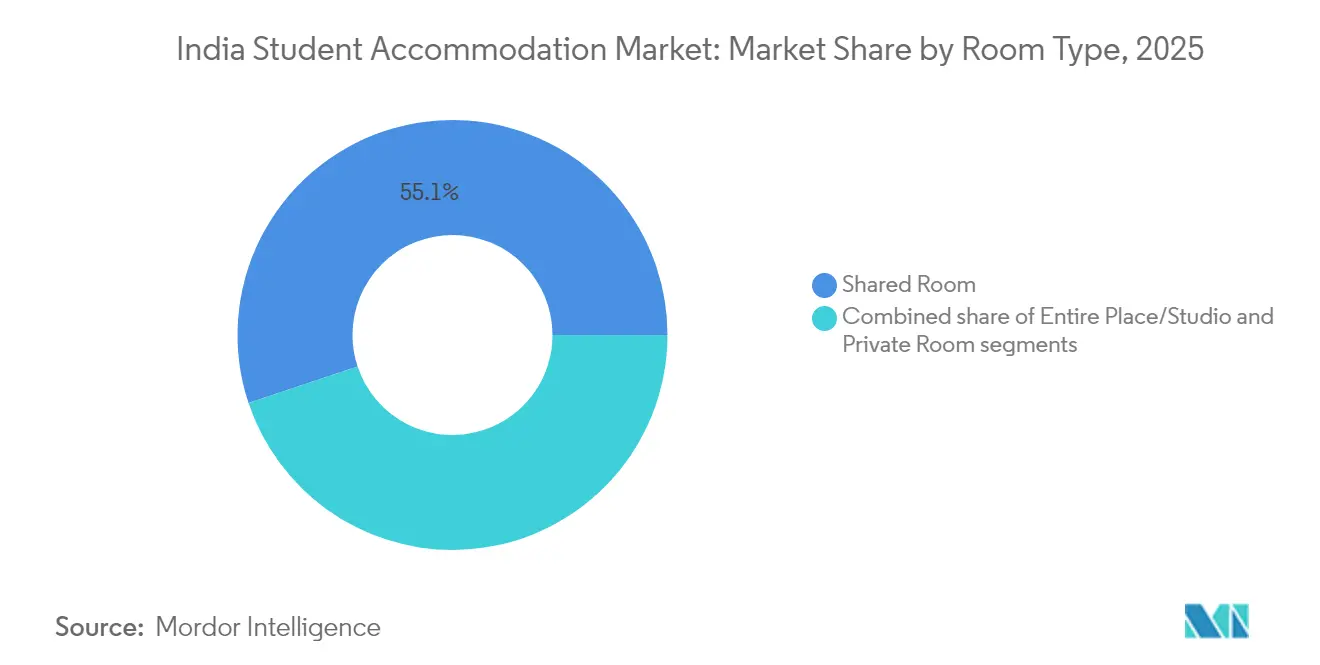
- By room type, shared configurations led with 55.12% revenue share in 2025, whereas studios are projected to expand at a 8.96% CAGR to 2031.
- By institution type, universities accounted for 66.12% of India's student accommodation market size in 2025; alternative education providers are tracking a 7.8% CAGR through 2031.
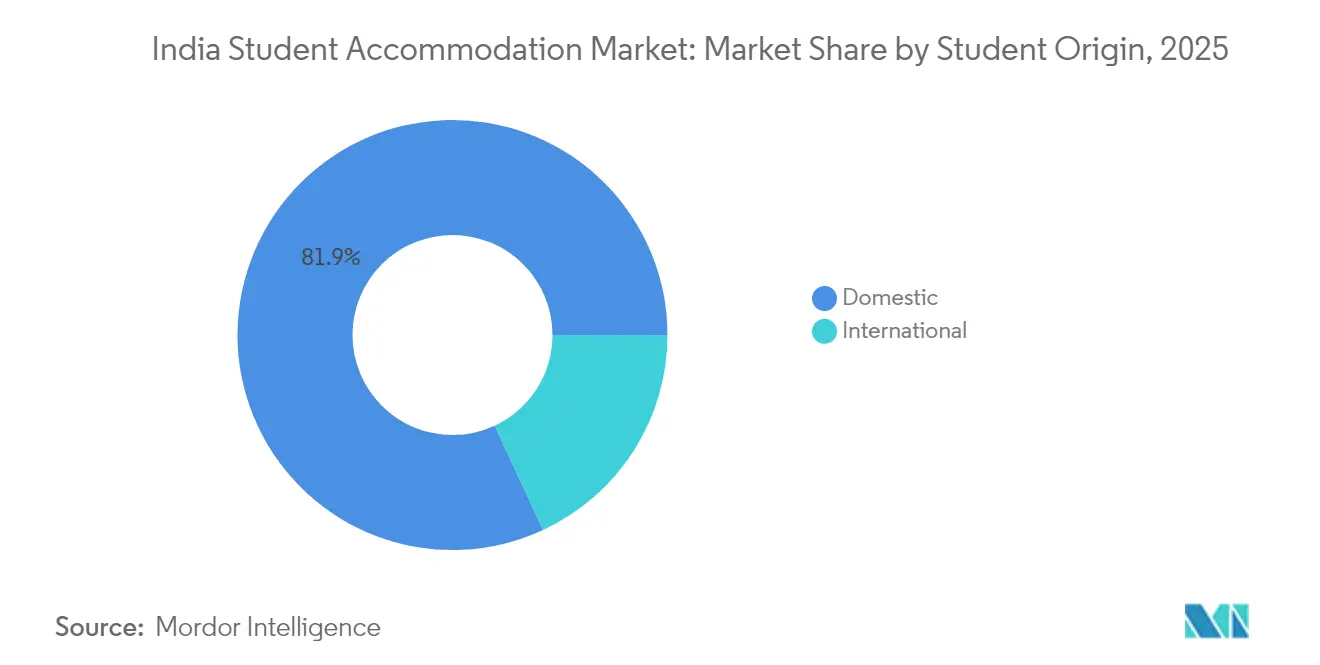
- By student origin, domestic occupants captured 81.92% share of the India student accommodation market size in 2025, while international residents are advancing at a 10.05% CAGR to 2031.
- By city tier, Tier I hubs held 54.93% of the India student accommodation market share in 2025; Tier II centers are set to post a 8.95% CAGR through 2031.
Note: Market size and forecast figures in this report are generated using Mordor Intelligence’s proprietary estimation framework, updated with the latest available data and insights as of 2026.
India contributes to a system defined not by any single country or region but by the interaction of many. The global student accommodation market data by Mordor Intelligence represents that combined structure.
India Student Accommodation Market Trends and Insights
Drivers Impact Analysis*
| Drivers | (~) % Impact on CAGR Forecast | Geographic Relevance | Impact Timeline |
|---|---|---|---|
| Surging domestic & inbound student enrolments | +1.8% | National, concentrated in Tier I & II cities | Medium term (2-4 years) |
| Expansion of higher-education campuses | +1.2% | National, with emphasis on emerging education hubs | Long term (≥ 4 years) |
| Parental shift toward managed PBSA | +0.9% | Tier I cities initially, spreading to Tier II | Medium term (2-4 years) |
| Government push via Model Tenancy Act 2021 | +0.7% | National implementation with state-level variations | Short term (≤ 2 years) |
| EdTech cohort courses driving short-stay demand | +0.5% | Urban centers with digital infrastructure | Short term (≤ 2 years) |
| Internship clustering in Tier-II IT corridors | +0.4% | Tier II cities, particularly Pune, Jaipur, Indore | Medium term (2-4 years) |
| Source: Mordor Intelligence | |||
Surging Domestic & Inbound Enrollments
Enrollment climbed to 43.3 million in 2025, and the target 50% Gross Enrollment Ratio by 2035 could add 25 million more learners. The Indian student accommodation market, therefore, faces structurally higher baseline demand. Federal outlays worth USD 603.35 million (INR 50,077.95 crore) in the 2025–26 budget fund new seats at IITs and medical colleges, creating near-term pressure on the surrounding housing supply. Tier I and emerging Tier II clusters draw most of the incremental intake because 70% of top institutions are located there, escalating competition for quality beds. India’s demographic dividend, with 600 million citizens under 25 years, ensures demand persistence, while rising rural aspirations enlarge the migrant student pool beyond traditional metros. Collectively, these factors lock in a multi-year volume runway for the Indian student accommodation market[1].
Expansion of Higher-Education Campuses
Budget allocations rose to USD 68.52 million for NITs and USD 201.10 million for Central Universities in 2025, accelerating greenfield and brownfield projects. IIT Madras alone commissioned a 1,200-bed hostel at a cost of USD 17.68 million, featuring 4-Star GRIHA certification. Such large-scale dormitory additions stimulate adjacent private accommodation because on-campus beds rarely suffice. Private universities follow suit; REVA University, for example, now offers space for more than 3,000 residents across gender-segregated blocks. Campus development radiates into Tier II and III cities, where land is cheaper and connectivity is improving, widening the geographic footprint of the Indian student accommodation market. New skill centers and AI institutes earmarked at USD 6.02 million each intensify accommodation needs for modular, short-stay cohorts[2].
Parental Shift Toward Managed PBSA
Dual-income households and heightened safety expectations encourage parents to favor branded, professionally run residences over informal paying-guest setups. Managed operators reply with 24/7 surveillance, biometric entry, meal plans, and academic lounges, building trust through transparent digital platforms displaying reviews and compliance certificates. The India student accommodation market sees especially strong premium uptake among female students whose families value secure, gated premises. Operators such as Stanza Living and Your-Space report occupancy rates above 93% in 2025 across metros, demonstrating willingness to pay a 15–20% tariff premium for standardized services. As nuclear families proliferate and migration trends persist, the managed PBSA proposition is expected to deepen, reinforcing above-trend growth within the Indian student accommodation market.
Government Push via Model Tenancy Act 2021
Implementation of the Model Tenancy Act harmonizes rental contracts and caps security deposits, lowering disputes and easing institutional entry. Rent tribunals streamline eviction and recovery processes, mitigating legal uncertainty that previously deterred large investors. Early-adopter states such as Maharashtra and Karnataka have published draft rules, boosting pipeline investments from private equity funds specializing in rental housing. For operators active across multiple cities, legal uniformity cuts compliance overhead and accelerates property onboarding. Over the short term, this regulatory modernization is forecast to contribute an incremental 0.7 percentage points to the India student accommodation market CAGR[3].
Restraints Impact Analysis*
| Restraints | (~) % Impact on CAGR Forecast | Geographic Relevance | Impact Timeline |
|---|---|---|---|
| High capex & long pay-back cycles | -1.1% | National, particularly acute in Tier I cities | Long term (≥ 4 years) |
| Zoning / development approval hurdles | -0.8% | Urban centers with complex regulatory frameworks | Medium term (2-4 years) |
| Cultural bias against female migration | -0.6% | Rural and semi-urban regions, particularly North & Central India | Medium term (2-4 years) |
| Hybrid & remote learning dampening demand | -0.4% | National, concentrated in technology and management education | Short term (≤ 2 years) |
| Source: Mordor Intelligence | |||
High Capex & Long Pay-Back Cycles
Land prices in core Tier I precincts swallow up to half of a PBSA project budget, and construction outlays average INR 2,500 - 4,000 per sq ft (USD 28.39 - 45.42) for mid-scale quality, dragging the break-even horizon to 7–10 years. Debt financing is scarce because most lenders view the sector as conventional commercial real estate, applying higher risk premiums. The India student accommodation industry is therefore tilting toward joint ventures with landowners, asset-light management agreements, and, recently, pilot REIT structures aimed at recycling capital. These mitigation strategies partly offset but do not eliminate the financial intensity that restrains the India student accommodation market over the long term.
Zoning / Development Approval Hurdles
Multi-agency clearance involving municipal bodies, fire departments, and environmental regulators typically inflates project timelines by 18–24 months in major cities. Floor Space Index ceilings further reduce project feasibility on constrained plots. Fragmented governance in metros like Delhi and Mumbai forces developers to navigate overlapping jurisdictions, elevating soft costs and uncertainty. The India student accommodation market thus witnesses supply lags, particularly around premier campuses where demand is inelastic. While single-window clearance proposals are on the policy agenda, implementation remains uneven, sustaining this drag through the medium term.
*Our forecasts treat driver/restraint impacts as directional, not additive. The impact forecasts reflect baseline growth, mix effects, and variable interactions.
Segment Analysis
By Room Type: Studios Drive Premium Segment Growth
Shared rooms maintained 55.12% of the India student accommodation market share in 2025, underscoring price sensitivity among the broad middle-class student cohort. Typical monthly rents of INR 8,000–15,000 (USD 96–181) in Tier II corridors position shared layouts as the most economical choice. Within this mainstream, community living fosters peer networks and divides utility costs, aligning well with undergraduate lifestyles. The segment also sees rising technological upgrades such as app-based maintenance requests, illustrating how digital convenience can coexist with budget models.
Studios, by contrast, log the fastest 8.96% CAGR as higher disposable incomes and privacy preferences flourish among urban affluent families. Safety-oriented parents supporting daughters studying in distant metros gravitate toward this format despite its 20–30% rent premium. Feature sets now include IoT-enabled smart locks, voice-controlled lighting, and bundled high-speed Wi-Fi, enhancing perceived value against conventional PG stock. Hyderabad’s 47-floor H1 tower, scheduled for 2026, epitomizes the aspirational end with women-only floors and work-from-home pods. As such, upscale offerings multiply, the studio sub-segment is poised to capture a larger slice of the Indian student accommodation market during the forecast horizon.

By Institution Type: Alternative Education Accelerates
Traditional universities controlled 66.12% of the India student accommodation market size in 2025, thanks to an ecosystem of 1,113 institutions and more than 42,000 colleges spread nationwide. Most university towns operate entrenched rental micro-markets of hostels, PGs, and private apartments. Subsidized public universities attract socially diverse students, reinforcing baseline demand regardless of macro-economic cycles. To bridge on-campus shortfalls, private operators cluster properties within walking distance, exploiting predictable intake calendars and semester-linked occupancy cycles.
Alternative education providers, coaching centers, EdTech bootcamps, and certification programs are, however, scaling faster at 7.8% CAGR. Kota’s exam-prep hub sustains year-round occupancy, while Bengaluru’s tech-oriented micro-courses create rolling batches requiring three-to-six-month stays. Government-funded skilling clusters and AI excellence centers add modular demand streams outside the traditional academic calendar. These patterns diversify the revenue mix and extend peak season utilization for operators nimble enough to adapt lease durations. Consequently, the India student accommodation market is broadening beyond degree-centric models toward flexible, program-agnostic housing solutions.
By Student Origin: International Segment Shows Promise
Domestic migrants still fill 81.92% of beds in 2025, mirroring entrenched inter-state education mobility and robust scholarship support of INR 2,160 crore (USD 26.04 million) for 2025. Improved rail and highway linkages shorten travel time, making relocation to academic hubs more feasible for rural students. Operators leverage vernacular marketing and culturally specific meal plans to deepen engagement with this high-volume segment.
International enrollees, rising at a 10.05% CAGR, reflect India’s emergence as an affordable regional study destination despite outbound flows of 1.33 million Indian students. Medical and engineering seats attract applicants from South Asia and Africa, who appreciate English-medium instruction and global-standard accreditation. The federal “Study in India” campaign offers fee concessions, while upcoming foreign university campuses on Indian soil are set to internationalize the talent mix. UK-based Vita Student’s 2024 entry signals confidence in premium global-style PBSA demand. Though starting from a lower base, the foreign student cohort could meaningfully thicken occupancy and raise RevPAR in the India student accommodation market.
Geography Analysis
Tier I metros contributed 54.93% to India student accommodation market revenue in 2025, led by Delhi, Mumbai, Bengaluru, and Hyderabad, where IITs, IIMs, and large private universities cluster. Mature transport networks and employment prospects create a dual pull: students enroll locally and often stay on for internships. Asset owners in these corridors can charge a 25–30% rent premium relative to Tier II cities, boosting return profiles. Yet rising land prices and regulatory layers cap new supply, intensifying competition for centrally located plots.
Tier II cities, Pune, Jaipur, Ahmedabad, Chandigarh, Lucknow, and Indore, are forecast to compound at 8.95% CAGR, outpacing national averages. Accelerated highway projects and smart-city grants increase livability scores, encouraging private universities to establish satellite campuses. Property markets here saw up to 65% price appreciation in 2024, yet remain attractive relative to Tier I, enabling profitable greenfield PBSA ventures. Operators adopt modular construction to reduce build times, aligning delivery with rapid enrollment upticks.
Tier III towns such as Mysuru, Kota, Dehradun, and Manipal specialize in niche education, coaching, medical, or engineering, and exhibit distinctive seasonality. Lower land costs and supportive local administrations facilitate campus expansion, but demand is highly localized. Developers mitigate volatility by bundling multiple small-town assets into regional portfolios, achieving operational synergies. Although individually modest, aggregated Tier III potential contributes a stabilizing diversification layer to the India student accommodation market.
The student accommodation market is analyzed by Mordor Intelligence across multiple other geographies, with in-depth regional assessments available for Asia and Europe. This is complemented by country-specific insights for Germany, United States, and United Kingdom, reflecting various localized market behavior and policy environments' coverage.
Regulatory Landscape
India student accommodation operates under a mix of real estate, tax, and safety norms. Real estate development and sales practices for new-build projects sit under the Real Estate (Regulation and Development) Act, 2016 (RERA), while rental-market reforms such as the Model Tenancy Act, 2021 influence how operators structure lease terms and dispute resolution across states. A key pricing-related change took effect on July 15, 2024, when a GST exemption (Entry 12AA) became applicable to hostel and student accommodation services priced at or below INR 20,000 per person per month for a continuous stay of at least 90 days. This can affect product positioning across budget shared rooms and premium formats.
Operational compliance is also shaped by student protection and building norms. The National Commission for Protection of Child Rights (NCPCR) has issued guidelines for hostels housing students aged 6-18, including supervision and age-appropriate segregation, which pushes organized providers to strengthen safeguarding processes where they serve minors. Separately, hostel building bye-laws referenced for 2025 introduce facility design anchors such as a minimum room area of 8 square meters per student and reserving 15% of permissible floor area for public facilities (for example, dining and common areas). These requirements influence feasibility, capex, and amenity planning for purpose-built assets.
Value Chain Analysis
The India student accommodation value chain runs from site sourcing and asset creation (land aggregation, design, construction, and fit-outs) to asset control (ownership, leasing, or partnering with institutions) and then ongoing operations (leasing, resident services, facility management, and renewals). Operators typically enter using several models, including build-to-operate (including PPP-style campus-linked development), long-term leasing of existing residential assets converted to student use, and management service agreements where owners retain the asset and brands deliver standardized operations and occupancy management.
Downstream, platform-led models are gaining traction. Aggregator and managed-living platforms connect fragmented supply from small hostel and PG owners with student demand through centralized discovery, pricing, contracting, and service standards, while large operators run city clusters to optimize staffing, procurement, and maintenance. Technology-enabled operations such as smart access control, app-based issue tracking, predictive maintenance, and digital resident engagement have become core value-add layers alongside essentials like food services, security, and housekeeping, helping organized providers differentiate from informal PG stock and improve utilization across academic and short-stay cohorts.
Competitive Landscape
The India student accommodation market hosts a blend of legacy PG landlords, tech-enabled co-living startups, and institutional PBSA operators. The top six brands, Stanza Living, Your-Space, Good Host Spaces, Colive, Tribe Stays, and Zolo, collectively command just under 30% of enrolled capacity, indicating moderate fragmentation. Asset managers are moving from pure operations contracts toward partial or full ownership stakes to ensure design standardization and brand consistency.
M&A momentum is rising; Good Host Spaces purchased Zolostays’ student arm for USD 12.99 million in 2024, underscoring the quest for scale. Private equity inflows target high-occupancy assets in Tier I engineering belts, while strategic investors favor multi-city platforms with proven technology stacks. PropTech systems covering predictive maintenance, AI-based pricing, and resident engagement apps are now baseline differentiators.
Sustainability is the emerging battleground. Operators obtain LEED or GRIHA ratings to align with institutional ESG mandates and appeal to eco-conscious Gen Z tenants. UK-origin Vita Student’s planned Indian pipeline imports global best practices in wellness amenities, potentially lifting service benchmarks for premium sub-segments. Taken together, competitive intensity is escalating, yet first-mover incumbents retain a localization edge in the India student accommodation market.
India Student Accommodation Industry Leaders
-
Stanza Living
-
Zolo Stays
-
Your-Space
-
NestAway
-
Colive
- *Disclaimer: Major Players sorted in no particular order
Market Opportunities and Future Outlook
White space is most visible where demand is clustered around expanding higher-education capacity, while professionally managed bed supply remains uneven across city tiers and micro-markets. Tier II education hubs highlighted in-market (for example, Indore, Coimbatore, and Nagpur) offer room for purpose-built and professionally managed formats that standardize safety, service levels, and lease transparency, especially where parents prioritize secure housing. The July 15, 2024 GST exemption threshold for student accommodation services (up to INR 20,000 per person per month with at least a 90-day stay) also creates a clearer pricing band for operators to design compliant offerings and compete more directly with unorganized PG alternatives.
Institution-linked development and asset recycling create additional opportunity lanes. The June 2026 PPP-linked 1,800-bed project with IIT Madras (via Elevate Campuses) illustrates how campus-adjacent capacity additions can be executed through private participation, which can serve as a reference point for other institutions where on-campus hostels lag enrollment growth. Developers and operators can also use build-to-rent approaches to convert suitable unsold or under-utilized residential inventory into organized student housing through leasing and management contracts, aligning with an asset-light expansion direction while still supporting branded service differentiation (for example, tech-enabled maintenance and standardized facility management).
Recent Industry Developments
- July 2026: Curated Living Solutions (CLS) announced a strategic goal to reach 50,000 beds over the next five years, scaling from its current 15,000 bed capacity. The announcement points to a marked expansion in the managed student housing footprint and positions CLS to pursue greater occupancy and pricing leverage. The move accelerates consolidation and longer-term asset ownership plans aimed at higher occupancy and revenue per bed.
- June 2026: Elevate Campuses partnered with IIT Madras to develop and operate an 1,800-bed student housing project on a 3.5-acre campus site with a ₹400 crore investment under a PPP model, completion targeted for 2028. The collaboration expands the scale of campus housing in a premier education corridor and supports a framework for standardized delivery on a large campus. Public-private collaboration to accelerate campus housing capacity and standardization across IIT Madras campus.
- June 2026: Union Living added over 2,000 beds through new property launches in Mumbai, Pune, and Ahmedabad, targeting an ARR of ₹100 crore for FY 2026-27. The expansion strengthens the company's footprint across major metro corridors and enhances modal diversification within its portfolio. Strengthens multi-city platform with higher recurring revenue potential and scale advantages.
Research Methodology Framework and Report Scope
Market Definition and Coverage
For this study, the market covers paid accommodation used by students in India, including on-campus hostels and off-campus options such as PGs and professionally managed residences, measured as annual revenue generated from rentals and bundled services.
Scope exclusions: home-stays with families, unpaid stays with relatives, and pure brokerage or property sale revenues are excluded unless they are part of recurring accommodation income.
Segmentation Overview
- By Room Type
- Entire Place/Studio
- Private Room
- Shared Room
- By Institution type
- Universities
- Others (Coaching Institutes, EdTech-driven, Test Prep hubs, etc.)
- By Student
- Domestic
- International
- By Geography
- Tier I Cities (Delhi, Mumbai, Bengaluru, Hyderabad, Chennai, and Kolkata)
- Tier II Cities (Pune, Ahmedabad, Jaipur, Chandigarh, Lucknow, Indore, Coimbatore, Kochi, Surat, Nagpur, Bhubaneswar, and Visakhapatnam)
- Tier III & Campus Towns (Mysuru, Madurai, Patna, Raipur, Dehradun, Guwahati, Jodhpur, Kanpur, Varanasi, Mangalore, Udaipur, Trichy, Ranchi, Kota, Manipal, Pilani, Aligarh, and Amritsar)
Data Sources, Market Sizing, and Validation
Desk Research
Desk research establishes baseline facts on student bed needs, where students are studying, and how quickly the demand pool shifts across Indian cities. We used public education and demographic series such as Ministry of Education releases (AISHE), UGC updates, and state higher-education dashboards, then pulled city-level urban and housing indicators from MoHUA publications and Census-linked migration summaries where available.
To link demand to paid accommodation value, we reviewed non-paywalled references such as RBI macro series for inflation and interest rate context, GST and state policy notes that affect housing services, and trade and association publications on student housing and managed living. We also used company filings, investor presentations, and reputed press to sanity-check rent ranges, occupancy patterns, and expansion timelines. For deeper financial intelligence, selected paid subscriptions were used, and we applied patent lookups where relevant and shipment-level import-export checks for furnishing and dorm equipment proxies. This list is illustrative only, and many other public and internal references were used for data collection, cross-checking, and clarification during the work.
Primary Interviews and Surveys
Primary work was used to convert broad demand and bed-gap signals into assumptions on pricing, occupancy, seasonality, and service attach rates across major education hubs. We spoke with operators, university and hostel administrators, property managers, and local brokers across Tier I and Tier II markets to separate what is monetized through paid agreements from what remains informal.
These discussions also helped confirm realistic inventory ramp-up timelines for new supply, typical contract structures, and how rent is adjusted across academic cycles, which we then triangulated with desk research inputs before finalizing the market model.
Distribution of primary research fieldwork respondents
| Company type | Respondent position |
|---|---|
| Top tier: 35% | CXOs: 12% |
| Mid tier: 43% | Functional/Unit leaders: 38% |
| Smaller Players: 22% | Managers: 50% |
Market-Sizing & Forecasting
Sizing started with a top-down build where higher-education enrollment and out-of-station student shares are translated into an addressable bed pool, then adjusted using hostel capacity signals and city-level demand concentration. To convert beds into value, we applied blended monthly rent ranges and typical service bundles (food, laundry, security, and utilities), then scaled them by observed occupancy through peak and off-peak months.
To keep the model tied to on-ground realities, we ran selective bottom-up checks using operator bed counts, city cluster capacity additions, and sampled rent cards. We then adjusted totals when the implied revenue per bed looked inconsistent with what interviews indicated. Key inputs used in the model included higher-education enrollment levels, migration toward major campus clusters, hostel bed stock growth, occupancy and churn patterns across the academic year, and rent escalation behavior by city tier.
For forecasting, scenario analysis was applied around three levers that stakeholders repeatedly highlighted: new supply delivery pace, rent escalation in high-demand micro-markets, and changes in student mobility across Tier I and Tier II cities. Where bottom-up visibility was weak for smaller PG inventory, we used calibrated penetration and pricing ranges from fieldwork, then applied conservative caps so informal supply was not overstated.
Data Validation & Update Cycle
Outputs were cross-checked against independent signals such as student migration indicators, reported hostel capacity additions, and whether the implied rent levels aligned with observed city ranges. Outliers, such as unusually high revenue per bed or abrupt city jumps, were reviewed and traced back to the specific assumption before sign-off. Follow-up calls were triggered when variance could not be explained by seasonality or a one-time event.
We followed a multi-step review where the model, assumptions, and calculations were rechecked by another analyst. After that, narrative conclusions were aligned to the final numbers. Reports are refreshed annually, and interim updates are made when material changes occur, such as policy shifts, large campus additions, or visible rent shocks, followed by a final pre-delivery pass so clients receive the latest updated view.
Mordor Intelligence's India Student Accommodation Market Size Versus Other Published Estimates
Published numbers for India student accommodation often differ because authors may count different housing types, use different timeframes (calendar year versus academic year), or mix revenue opportunity language with measured market revenue.
The spread also comes from how informal PG supply is treated, how bundled services are priced, and whether occupancy is averaged across the full year or only across the main academic months. When scope is narrowed to professionally managed beds only, totals can look smaller, while broader inclusion of all paid student stays can push the value higher, especially across large metro clusters.
Benchmark comparison
| Source | Market Size | Gaps in Research Methodology |
|---|---|---|
| Mordor Intelligence | USD 563.83 B (2025) | |
| Trade Journal A | USD 4.00 B (2028) | Framed as a revenue opportunity tied to professionally managed student accommodation and bed-gap discussion, which can exclude large informal PG inventory and often uses academic-year timing rather than full-year realized revenue. |
| Industry Body B | USD 0.78 B (2030) | Higher-level projection that appears to generalize student housing using broad growth rates, with limited disclosure on coverage of bundled services, occupancy normalization across months, and the split between on-campus and off-campus paid stays. |
The table shows that differences are mostly driven by what is counted as student accommodation and how revenue is translated from beds and rents across the year, and this gap remains once informal and formal supply are priced with occupancy and service bundles using Mordor Intelligence's approach.
Key Questions Answered in the Report
How large is the India student accommodation market in 2026?
It is valued at USD 601.29 billion and is projected to reach USD 828.93 billion by 2031.
What CAGR is forecast for organized student housing through 2031?
The overall India student accommodation market is expected to grow at a 6.64% CAGR during 2026-2031.
Which city tier is expanding fastest for new beds?
Tier II corridors such as Pune, Jaipur, and Lucknow are posting a 8.95% CAGR, outpacing Tier I metros.
What room format is gaining traction among premium buyers?
Studio and entire-place units are the fastest-growing sub-segment at a 8.96% CAGR due to rising disposable incomes.