Market Overview
| Study Period | 2021 - 2031 |
|---|---|
| Forecast Data Period | 2026 - 2031 |
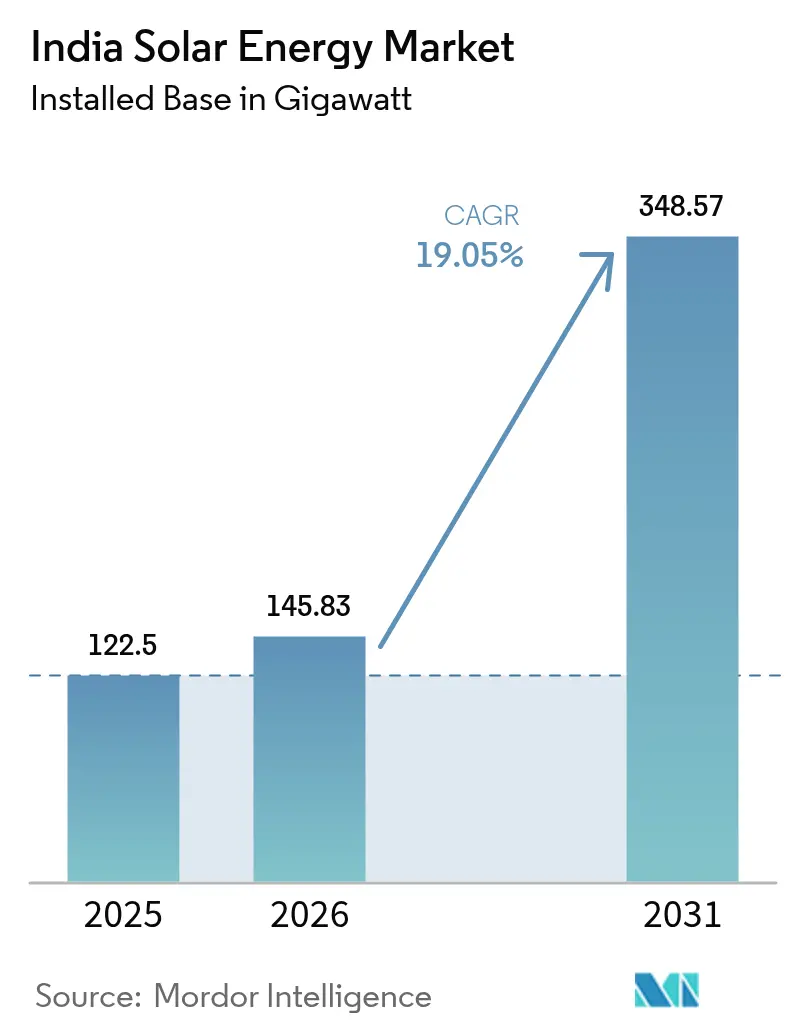
| Base Year Market Size (2025) | 122.5 gigawatt |
| Market Volume (2026) | 145.83 gigawatt |
| Market Volume (2031) | 348.57 gigawatt |
| Growth Rate (2026 - 2031) | 19.05% CAGR |
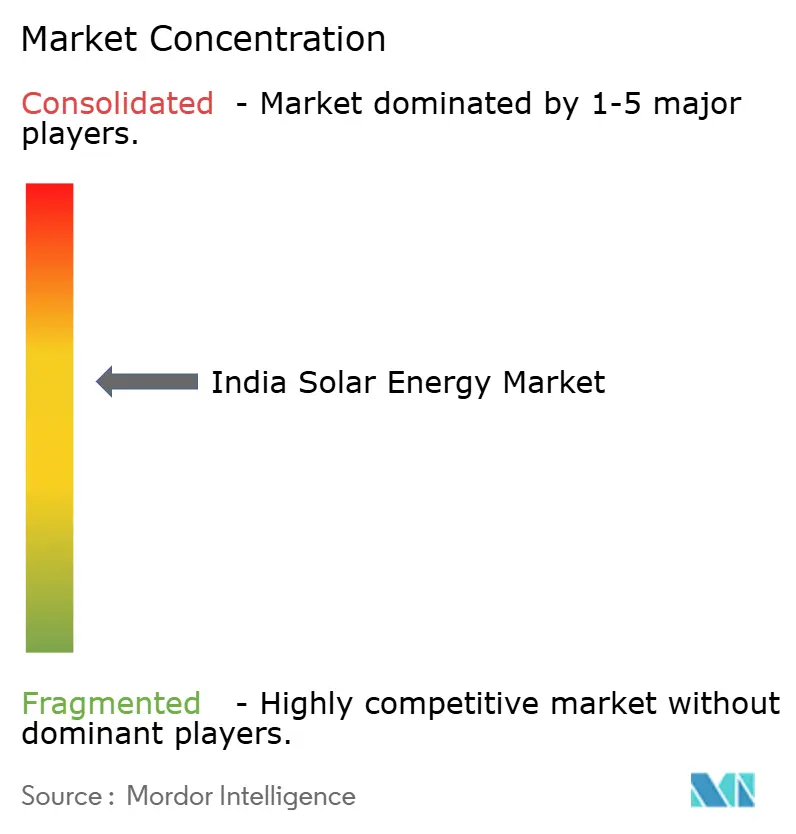
| Market Concentration | Medium |
Major Players *Disclaimer: Major Players sorted in no particular order Image © Mordor Intelligence. Reuse requires attribution under CC BY 4.0. | |
India Solar Energy Market Analysis by Mordor Intelligence
The India Solar Energy Market size was valued at 122.5 gigawatt in 2025 and estimated to grow from 145.83 gigawatt in 2026 to reach 348.57 gigawatt by 2031, at a CAGR of 19.05% during the forecast period (2026-2031).
Rising deployment momentum comes from the 500 GW national non-fossil target, PLI-backed manufacturing expansion, and stable auction tariffs that continue to undercut coal.[1]Ministry of New and Renewable Energy, “Solar Energy – Current Status,” mnre.gov.in Backward integration into cell, wafer, and polysilicon production is trimming import exposure that once exceeded 90%. At the same time, falling levelized costs, standardized rooftop subsidies, and open-access reforms are broadening demand beyond utility-scale plants. Developers are responding with hybrid solar-plus-storage bids that smooth evening demand curves, while states with canal-top and agrivoltaic programs are easing land bottlenecks.
Key Report Takeaways
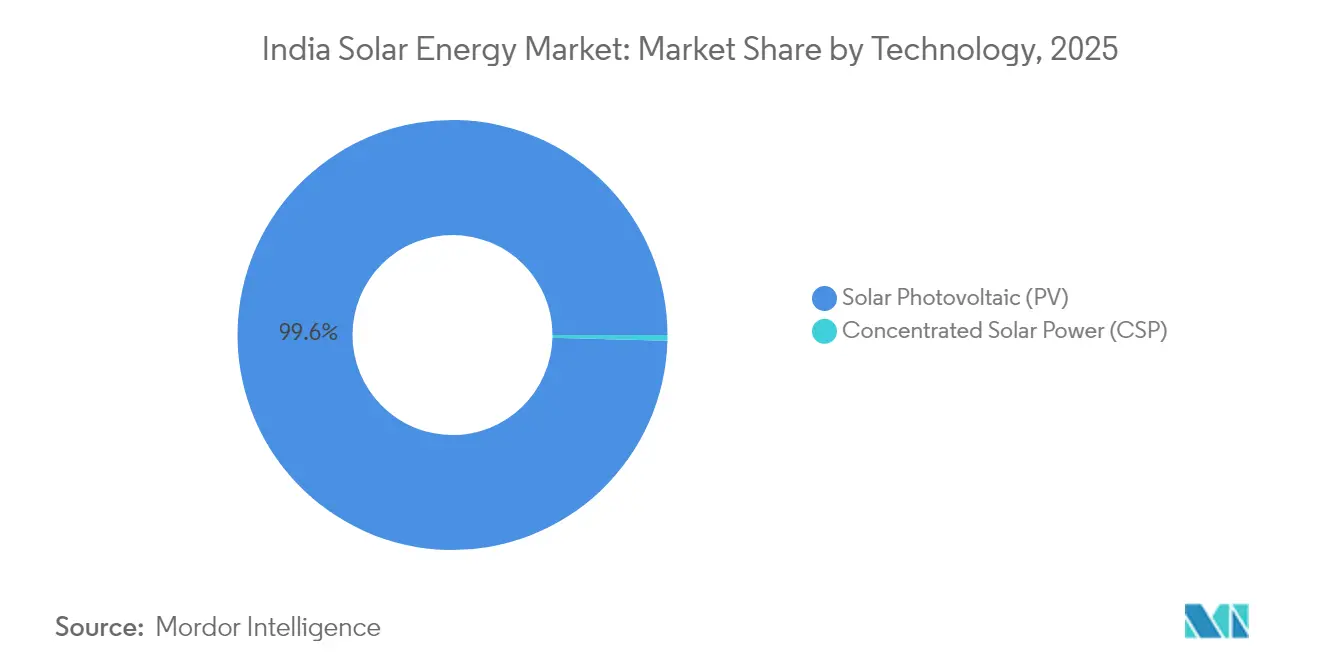
- By technology, solar photovoltaic commanded 99.58% of the India solar energy market share in 2025 and is advancing at a 19.08% CAGR to 2031.
- By grid type, on-grid systems held a 96.85% share in 2025, whereas off-grid installations are forecast to post the fastest 26.1% CAGR through 2031.
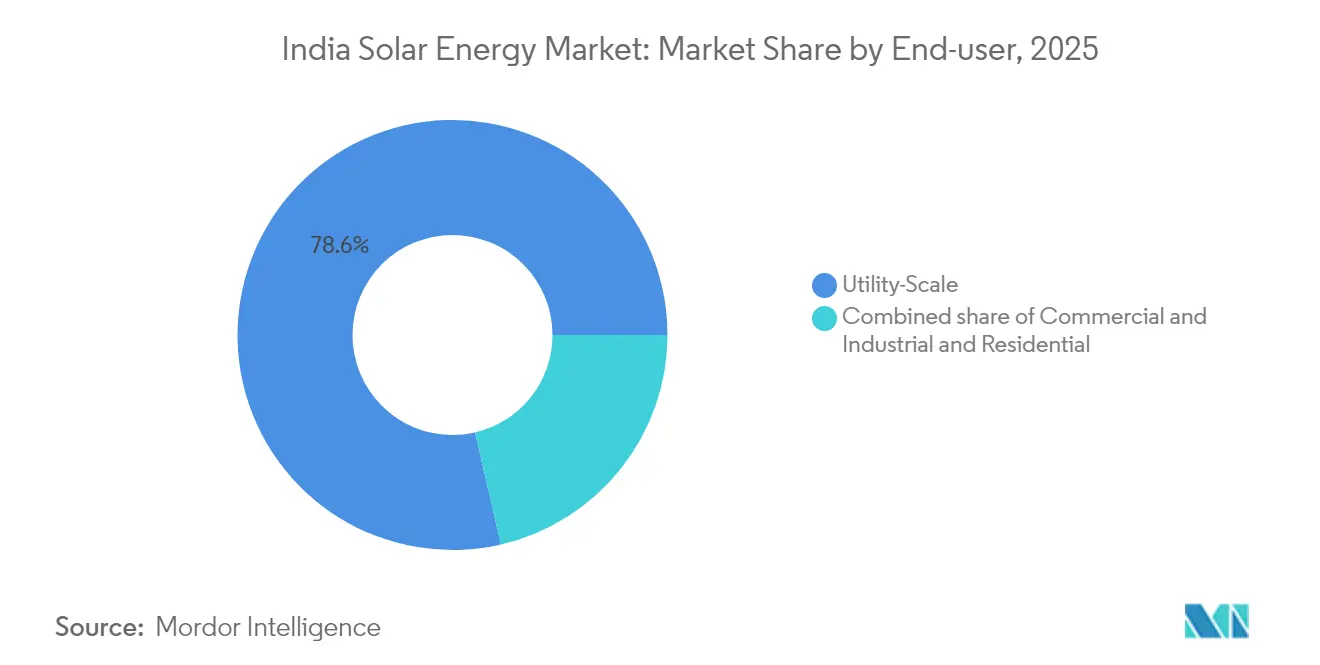
- By end-user, utility-scale projects accounted for 78.62% of the India solar energy market size in 2025, while the residential segment is set to expand at a 23.4% CAGR through 2031.
Note: Market size and forecast figures in this report are generated using Mordor Intelligence’s proprietary estimation framework, updated with the latest available data and insights as of 2026.
India Solar Energy Market Trends and Insights
Drivers Impact Analysis*
| Driver | (~) % Impact on CAGR Forecast | Geographic Relevance | Impact Timeline |
|---|---|---|---|
| Supportive federal and state incentives | +3.2% | National, led by Gujarat, Tamil Nadu, Rajasthan | Medium term (2-4 years) |
| Rapid decline in module LCOE | +4.1% | National, strongest in price-sensitive C&I and residential segments | Short term (≤ 2 years) |
| 500 GW national target sustaining tenders | +5.3% | National, with notable pipelines in Karnataka and Madhya Pradesh | Long term (≥ 4 years) |
| Green-hydrogen-linked solar demand | +1.8% | Coastal states such as Gujarat and Odisha | Long term (≥ 4 years) |
| Domestic polysilicon-to-module build-out | +2.4% | Clusters in Gujarat, Andhra Pradesh, Tamil Nadu | Medium term (2-4 years) |
| State-led agrivoltaic and canal-top programs | +1.5% | Punjab, Haryana, Uttar Pradesh, Gujarat | Medium term (2-4 years) |
| Source: Mordor Intelligence | |||
Supportive Federal and State Incentives Accelerate Localization
India's Solar Energy market expansion is underwritten by regulations that reward domestic value addition. The Approved List of Models and Manufacturers (ALMM) favors locally produced modules, while two PLI tranches are underwriting more than 48 GW of integrated cell-to-module capacity scheduled to go online by 2026.[2]Rachit Chawla, “PLI-II winners plan 48 GW of integrated capacity,” economictimes.indiatimes.com Tata Power, Waaree Energies, and Goldi Solar commissioned large plants in 2025, keeping domestic module margins in the 12-14% range despite import duties. Developers face 6-8% higher upfront costs in the short run, yet long-term supply security and potential tax credits offset the burden. Expansion of ALMM to cover cells from June 2026 is projected to triple exports to 8-9 GW in FY 2025, bolstering balance-of-payments resilience and deepening India's Solar Energy market competitiveness.
Rapid Decline in Module-Levelized Cost Unlocks Distributed Segments
Average utility-scale project capex fell 28% year-on-year in 2024, pushing discovered tariffs to INR 2/kWh, a new national floor. Cost compression stems from global oversupply, technology shifts toward TOPCon, and widening domestic supply chains. Intermittent spikes due to logistics bottlenecks and basic customs duties occasionally disrupt bids; still, most developers model energy at ≤ INR 2.4/kWh over project life. Sustaining that benchmark depends on continued efficiency gains, accelerated polysilicon-to-module build-out, and moderated freight rates. If manufacturers achieve advertised cell efficiencies above 25%, the India Solar Energy market could see sub-INR 2 tariffs by 2027, reinforcing demand across utility, C&I, and residential applications.[3] Uma Gupta, “Module prices hit INR 19/Wp amid global glut,” pv-magazine-india.com
500 GW National Target Sustains Utility-Scale Tender Pipeline
The national 500 GW renewables target anchors a predictable multiyear tender schedule. As of 2025, 163 GW of large-scale solar projects sit in various development stages, giving investors line-of-sight on offtake and policy stability. Central agencies have standardized auction timelines, while state utilities align feed-in tariffs and bankability standards. However, the spatial concentration of winning bids in Gujarat and Rajasthan strains transmission capacity, heightening curtailment risk. Flexible procurement clauses, hybrid wind-solar-storage bids, and impending market-based economic dispatch reforms are expected to spread installations to emerging states, enhancing diversity across the India Solar Energy market.
Green-Hydrogen–Linked Solar Demand Creates Dedicated Off-Take Channels
Industrial decarbonization strategies are driving new offtake clusters. ReNew aims to produce 1 million t of green hydrogen annually, powered by 25 GW of renewables, while NTPC and Adani target multi-GW electrolyzer facilities synchronized with utility-scale solar. Co-located solar, storage, and hydrogen plants enable higher capacity-utilization factors and diversified revenue. Project finance structures increasingly bundle merchant hydrogen sales with long-term power-purchase agreements, lowering the cost of capital. As India finalizes its National Hydrogen Mission incentives, demand from refineries, fertilizer plants, and steel mills will anchor larger projects, cementing the India Solar Energy market as a backbone of industrial competitiveness.
Restraints Impact Analysis*
| Restraint | (~) % Impact on CAGR Forecast | Geographic Relevance | Impact Timeline |
|---|---|---|---|
| Weak grid flexibility and curtailment risk | -2.8% | Tamil Nadu, Karnataka, Andhra Pradesh | Short term (≤ 2 years) |
| Land-acquisition bottlenecks | -1.9% | Rajasthan, Gujarat, Madhya Pradesh | Medium term (2-4 years) |
| Cell and wafer import dependency | -1.6% | National | Short term (≤ 2 years) |
| Limited credit for MSME rooftop projects | -1.2% | Tier-2 and Tier-3 cities | Medium term (2-4 years) |
| Source: Mordor Intelligence | |||
Weak Grid Flexibility and Curtailment Risk Threatens Project Returns
Solar penetration in leading states now exceeds 25% of peak demand, exposing grids to frequent curtailment events. Limited ancillary services, delayed battery-storage rollouts, and network congestion erode plant load factors by up to 4 percentage points. The Green Energy Corridor program and the commissioning of India’s largest BESS factory in Karnataka improve flexibility yet lag capacity-addition velocity. Developers incorporate generation forecasts, but unpredictable curtailment complicates financing, especially for medium-sized independent power producers. Faster adoption of market-based economic dispatch and real-time ancillary markets is essential to preserve investor confidence in the India Solar Energy market.
Land-Acquisition Bottlenecks in High-Irradiance States Delay Commissioning
Gujarat and Rajasthan’s solar parks highlight land-aggregation challenges. Competing land use, fragmented titles, and environmental clearances can delay projects by up to 12 months. Karnataka’s Pavagada Solar Park uses cooperative lease arrangements that provide farmers with annual rent indexed to inflation, offering a replicable model.[4]Lulu Raghavan, “Land acquisition hurdles in Rajasthan solar parks,” wri.org State-level digitization of land records and single-window clearances reduce transaction costs, but areas near wildlife sanctuaries and cultural sites remain contentious. The India Solar Energy industry increasingly explores floating, canal-top, and agrivoltaic installations to sidestep land constraints while supporting local economies.
*Our forecasts treat driver/restraint impacts as directional, not additive. The impact forecasts reflect baseline growth, mix effects, and variable interactions.
Segment Analysis
By Technology: PV Dominance Masks Niche CSP Revival
Solar photovoltaic accounted for 99.58% of the India solar energy market in 2025 and is on track for a 19.08% CAGR through 2031. Within PV, TOPCon modules already form 35% of domestic output after Waaree, Adani, and Premier ramped 18 GW combined capacity. BIS-mandated quality rules removed low-grade imports, nudging developers toward bifacial designs that raise yields 10-20%. Concentrated solar power, although below 1 GW, re-entered the tender pipeline via hybrid bids that bundle six-hour thermal storage. NTPC’s 50 MW Ladakh CSP plant logs a 42% capacity factor, showing dispatchable value in high-altitude sites.
Developers weigh CSP’s higher capital intensity against superior evening output when evaluating mixed portfolios. Meanwhile, Reliance’s planned 10 GW HJT line targets 25-26% cell efficiency by 2027, which could narrow LCOE differences with CSP. As cost spreads tighten, technology choice will hinge on project-specific land and storage constraints. The India solar energy market, therefore, remains PV-heavy yet technologically fluid, with niche CSP and next-gen PV formats carving differentiated roles over the decade.


By Grid Type: Off-Grid Surge Driven by Agricultural Electrification
On-grid capacity represented 96.85% of the India solar energy market size in 2025, supported by stable utility tariffs and bankable PPAs. Off-grid systems, however, are projected to grow at a 26.1% CAGR, catalyzed by PM KUSUM’s 3.5 million solar-pump mandate and Saubhagya village electrification. Stand-alone pumps cut diesel bills by INR 30,000-50,000 annually for a 5 HP unit, encouraging adoption in Bihar and Uttar Pradesh.
Financing divergence persists. Grid-tied projects secure 8-9% public-sector debt, whereas off-grid projects rely on 60-90% subsidy plus micro-finance rates of 12-15%. Recent pilots in Ladakh and Arunachal proved 35-40% diesel displacement for solar-plus-storage mini-grids. As battery costs fall and policy support widens, off-grid options could erode on-grid dominance, adding breadth to the India solar energy market.
By End-User: Residential Rooftop Outpaces Utility-Scale Growth
Utility-scale plants controlled 78.62% of the India solar energy market in 2025, underpinned by SECI’s robust auction flow and 25-year PPAs. Yet residential rooftops are predicted to advance ata 23.4% CAGR to 2031 as PM Surya Ghar targets 10 million homes. Subsidies lower simple paybacks to four to five years in high-tariff states such as Maharashtra.
Commercial and industrial buyers leverage group-captive rules to avoid wheeling charges, accelerating rooftop pipelines by 22-24% each year. Persistent subsidy delays of four to six months could temper momentum, but installers expect streamlined portals to cut approval times. As households recognize savings against INR 6-9 per kWh retail tariffs, distributed generation should capture incrementally larger slices of the India solar energy market.
Geography Analysis
Gujarat, Rajasthan, and Karnataka together contributed more than 60% of 2025 additions on the back of robust solar resources, streamlined land-leasing regimes, and strong state-utility creditworthiness. Gujarat’s 30 GW hybrid park at Khavda illustrates the state’s capacity to aggregate land, coordinate transmission, and de-risk offtake, while Rajasthan tops commissioning tables with multi-GW clusters linked to the Green Energy Corridor.
Maharashtra, Punjab, and Assam are now scaling distributed programs, leveraging agrivoltaic pilots and canal-top schemes to meet dual objectives of rural income and water conservation. Transmission upgrades under the Interstate Green Energy Corridor Phase-II enable surplus from western parks to flow eastward, easing regional imbalances. Nonetheless, curtailment incidence in Rajasthan and Gujarat signals the need for storage integration and flexible demand-side programs.
Union Territories such as Chandigarh and Lakshadweep test floating solar, while northeastern states deploy rooftop clusters under viability-gap funding. Harmonizing state regulations, standardizing banking periods, and accelerating digital approval portals remain prerequisites for balanced regional growth across the India Solar Energy market.
Competitive Landscape
India's Solar Energy market competition is intensifying as conglomerates vertically integrate, and new domestic manufacturers enter with IPO-backed capital. Adani Green Energy crossed 12 GW of operational capacity in early 2025 and targets 45 GW by 2030; its Khavda cluster integrates PV, wind, and storage for 24/7 supply commitments. Tata Power commissioned a 4.3 GW cell-to-module plant in Tamil Nadu, underpinning ALMM compliance for its pipeline and external customers. ReNew’s INR 31,500 crore investment plan bundles 40 GW of projects with 6 GW of manufacturing, signaling a pivot toward integrated value chains.
Mid-tier manufacturers Waaree, Goldi Solar, Saatvik, and Jupiter International collectively announced >20 GW of new cell lines using TOPCon and HJT, carving export channels to the Middle East, Europe, and the United States. Foreign OEMs JinkoSolar and LONGi are forming joint ventures to navigate ALMM requirements and access PLI incentives. Storage integration is the new frontier: the inauguration of India’s largest BESS factory in Karnataka reveals synergies between module producers and storage OEMs, positioning diversified players for hybrid bids.
Tender bidding margins remain tight, often ≤ INR 0.15/kWh, propelling consolidation as smaller developers exit or pivot to rooftop niches. Access to low-cost capital, technological learning curves, and policy influence thus confer durable advantages to incumbents, indicating a moderately concentrated trajectory for the India Solar Energy market.
India Solar Energy Industry Leaders
Adani Green Energy Ltd.
Tata Power Solar Systems Ltd.
ReNew Power Pvt. Ltd.
Azure Power Global Ltd.
NTPC Renewable Energy Ltd.
- *Disclaimer: Major Players sorted in no particular order

Recent Industry Developments
- June 2025: In Ganjam district of Odisha, Saatvik Solar, a subsidiary of Saatvik Green Energy Limited (SGEL), is constructing a facility with a capacity of 4.8GW for solar cell production and 4GW for module manufacturing. The integrated plant is being developed by SSIPL, which SGEL fully owns.
- March 2025: Waaree Energies kicked off commercial production at its 5.4 GW solar cell manufacturing facility in Chikhli, Gujarat. Currently, 1.4 GW of Mono PERC capacity is operational, with plans to commission an additional 4 GW of TOPCon capacity in the upcoming phase.
- March 2024: Adani Green Energy activated 1 GW of solar power at the Khavda Renewable Energy Park in Gujarat. This milestone contributes to the ambitious 30 GW capacity of the world's largest solar project. With this latest addition, AGEL's operational capacity now stands at 9,478 MW, inching closer to its 2030 target of 45,000 MW.
- January 2024: The UT administration plans to install rooftop solar power plants on approximately 4,000 government residences to generate green energy. The Chandigarh Renewable Energy Science and Technology Promotion Society (CREST) will implement the project, with a total capacity of about 12 MWp (megawatt peak).


India Solar Energy Market Report Scope
Solar power is the conversion of solar energy into thermal or electrical energy. Solar energy is the cleanest and most abundant renewable energy source accessible, and it may be used to generate electricity, provide light or a comfortable interior environment, and heat water for home, commercial, or industrial purposes.
The Indian solar energy market report includes:
By Technology
| Solar Photovoltaic (PV) |
| Concentrated Solar Power (CSP) |
By Grid Type
| On-Grid |
| Off-Grid |
By End-User
| Utility-Scale |
| Commercial and Industrial (C&I) |
| Residential |
By Component (Qualitative Analysis)
| Solar Modules/Panels |
| Inverters (String, Central, Micro) |
| Mounting and Tracking Systems |
| Balance-of-System and Electricals |
| Energy Storage and Hybrid Integration |
| By Technology | Solar Photovoltaic (PV) |
| Concentrated Solar Power (CSP) | |
| By Grid Type | On-Grid |
| Off-Grid | |
| By End-User | Utility-Scale |
| Commercial and Industrial (C&I) | |
| Residential | |
| By Component (Qualitative Analysis) | Solar Modules/Panels |
| Inverters (String, Central, Micro) | |
| Mounting and Tracking Systems | |
| Balance-of-System and Electricals | |
| Energy Storage and Hybrid Integration |


Key Questions Answered in the Report
How large is the India solar energy market in 2026?
Installed capacity reached 145.83 GW in 2026 and is forecast to rise to 348.57 GW by 2031.
What is driving rooftop solar adoption among households?
PM Surya Ghar subsidies up to INR 78,000 per 3 kW system and rising retail tariffs cut paybacks to four-five years in many states.
Which technology dominates new capacity additions?
Solar photovoltaic holds 99.58% share and benefits from falling TOPCon and bifacial module costs.
Why are developers adding batteries to solar projects?
Round-the-clock tenders require four-hour storage to meet evening peaks, earning 15-20% tariff premiums over pure solar.
What challenges slow solar growth in high-irradiance states?
Land clearances and transmission congestion delay 8-10 GW of projects and trigger curtailment that erodes project returns.
Page last updated on:


