India MLCC Market Size and Share
Market Overview
| Study Period | 2020 - 2031 |
|---|---|
| Forecast Data Period | 2026 - 2031 |
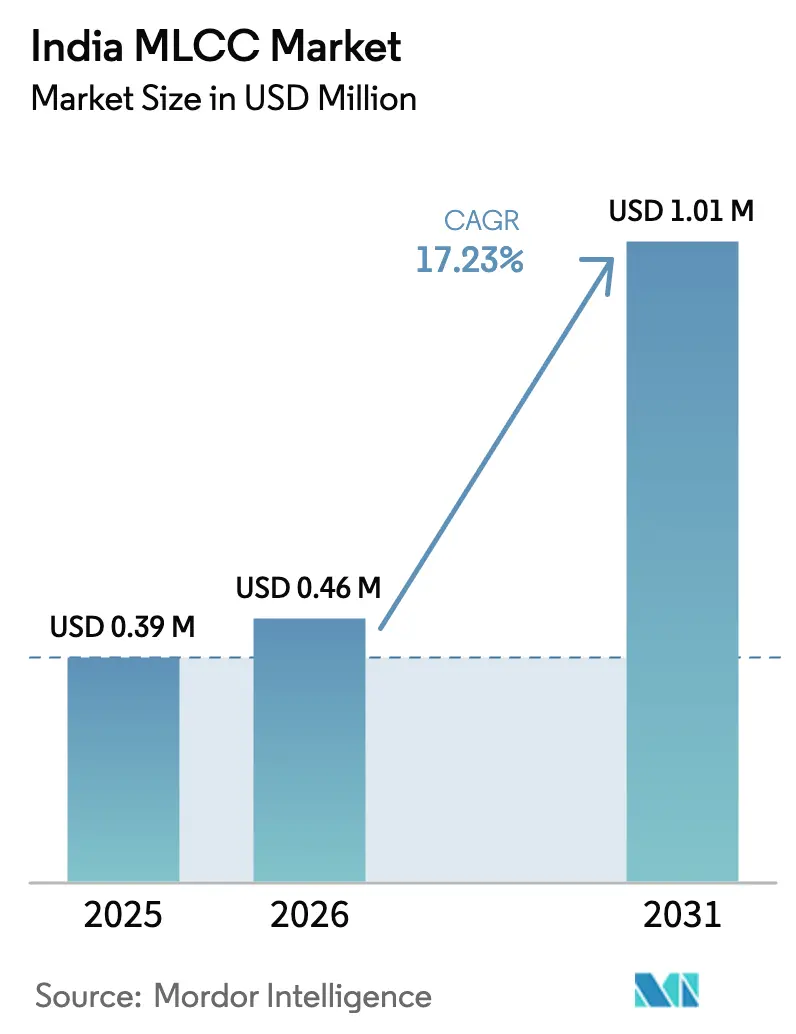
| Base Year Market Size (2025) | USD 0.39 Million |
| Market Size (2026) | USD 0.46 Million |
| Market Size (2031) | USD 1.01 Million |
| Growth Rate (2026 - 2031) | 17.23% CAGR |
| Market Concentration | Medium |
Major Players *Disclaimer: Major Players sorted in no particular order Image © Mordor Intelligence. Reuse requires attribution under CC BY 4.0. | |
India MLCC Market Analysis by Mordor Intelligence
India MLCC market size in 2026 is estimated at USD 0.46 billion, growing from 2025 value of USD 0.39 billion with 2031 projections showing USD 1.01 billion, growing at 17.23% CAGR over 2026-2031. Momentum stems from government incentives that expand domestic component capacity, sustained smartphone exports, and rising electronic content in vehicles. Capacity additions from global suppliers shorten lead times, while policy reforms reduce import dependence and foreign-exchange exposure. Automotive electrification multiplies per-vehicle capacitor counts, 5G network densification accelerates demand for high-frequency variants, and surface-mount miniaturization boosts throughput on automated lines. The convergence of these vectors positions the India MLCC market as a strategic arena where domestic and overseas firms compete for share.
Key Report Takeaways
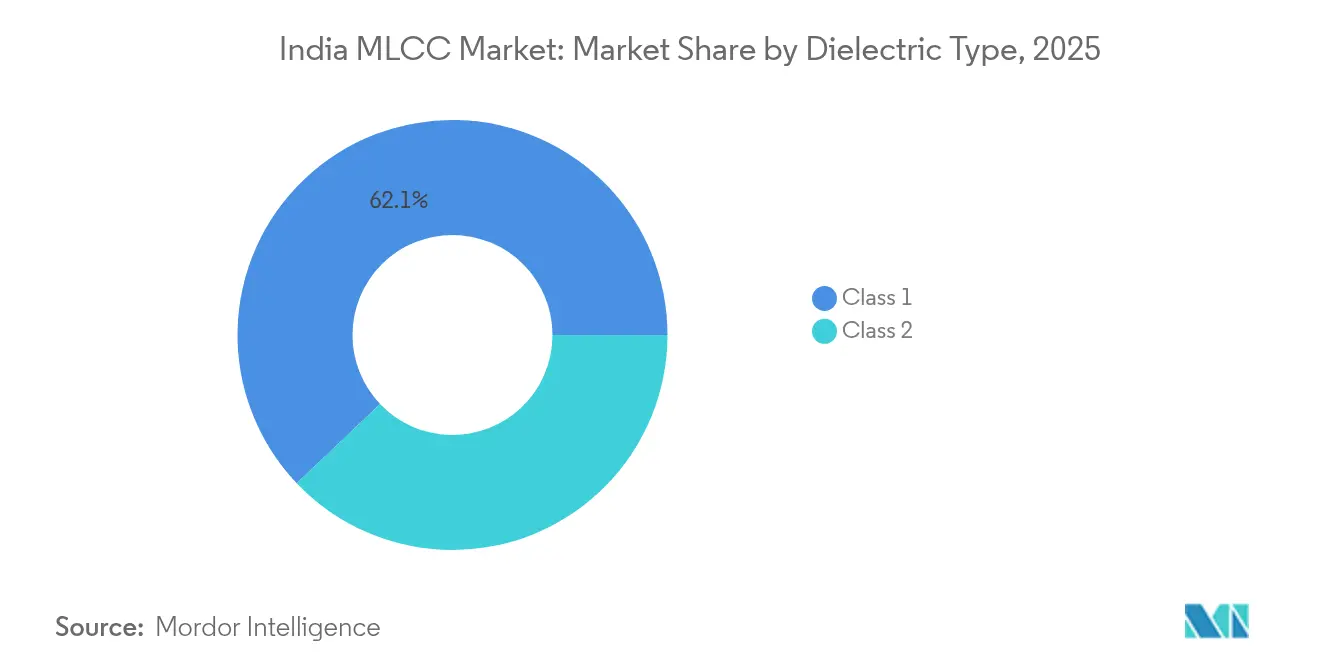
- By dielectric type, Class 1 MLCCs led with 62.10% share in 2025 and are projected to grow at an 18.22% CAGR through 2031.
- By case size, the 201 package captured 56.05% of 2025 revenue, while the 402 package posts the quickest 18.05% CAGR over the forecast period.
- By voltage rating, low-voltage MLCCs, up to 100 V, held a 58.85% share in 2025 and recorded the highest 18.11% CAGR from 2025 to 2031.
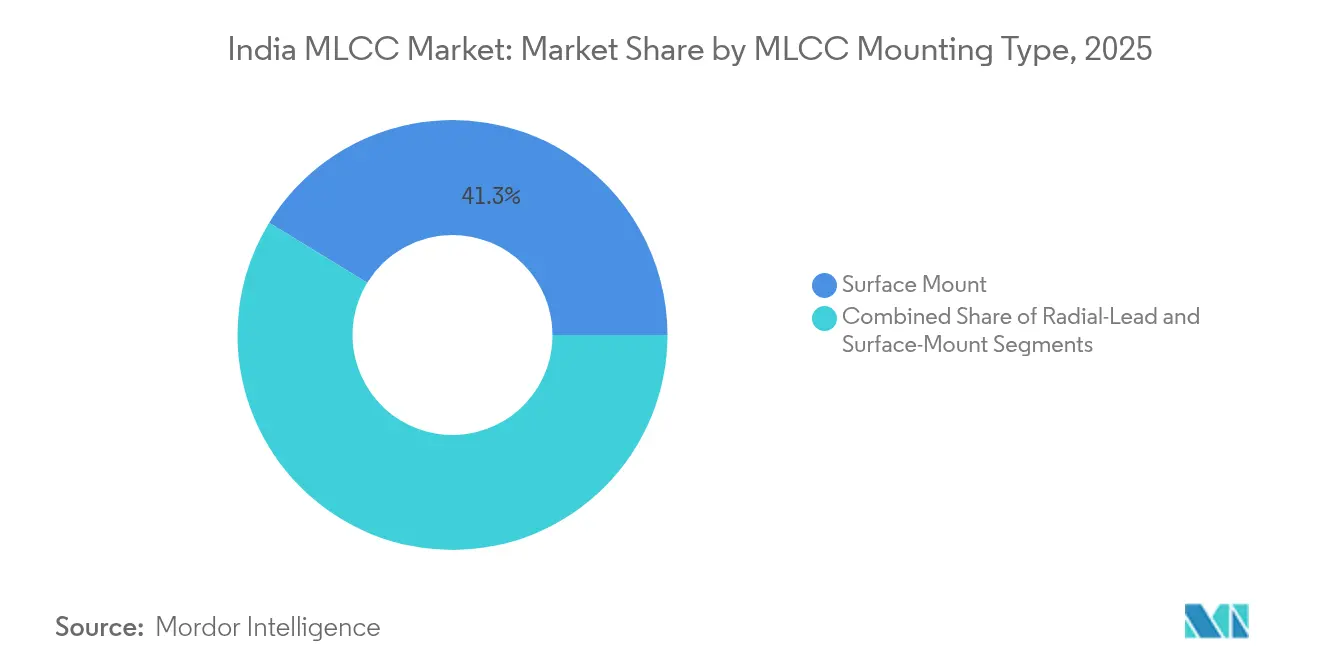
- By MLCC mounting type, surface-mount devices dominated with a 41.25% share in 2025, while metal-cap variants surged at an 17.9% CAGR through 2031.
- By end-user application, consumer electronics contributed 50.95% of 2025 revenue, whereas automotive demand accelerates at a 18.62% CAGR to 2031.
Note: Market size and forecast figures in this report are generated using Mordor Intelligence’s proprietary estimation framework, updated with the latest available data and insights as of 2026.
India MLCC Market Trends and Insights
Drivers Impact Analysis*
| Driver | (~) % Impact on CAGR Forecast | Geographic Relevance | Impact Timeline |
|---|---|---|---|
| Surge in Automotive Electronics Content per Vehicle | +3.2% | National, with early gains in Chennai, Pune, Gujarat | Medium term (2-4 years) |
| Government PLI Schemes Boosting Domestic MLCC Production | +2.8% | National, concentrated in Gujarat, Tamil Nadu, Andhra Pradesh | Long term (≥ 4 years) |
| Rapid 5G Roll-out Driving High-Frequency MLCC Demand | +2.1% | Urban centers, tier-1 cities expanding to tier-2 | Short term (≤ 2 years) |
| Consumer Shift to Premium Smartphones with Higher MLCC Count | +1.8% | National, stronger in urban markets | Medium term (2-4 years) |
| Adoption of SiP Modules in IoT Wearables | +1.4% | Technology hubs in Bengaluru, Hyderabad, Pune | Long term (≥ 4 years) |
| Rail-Signalling Electrification Projects | +0.9% | National railway corridors, focus on high-speed routes | Long term (≥ 4 years) |
| Source: Mordor Intelligence | |||
Surge in Automotive Electronics Content per Vehicle
EVs integrate 15,000–20,000 MLCCs, compared to 2,000–3,000 units in internal-combustion cars. India’s EV registrations increased from 95,198 units in 2018 to 1,670,736 units in 2024, representing a 61% compound annual growth rate that directly impacts capacitor volumes. LiDAR-grade MLCCs, recently qualified to AEC-Q200, capture emerging design wins in advanced driver-assistance systems, while 48 V architectures require higher voltage and temperature stability. Automakers localize module production to meet value-addition norms, pulling passive suppliers into proximity with vehicle plants.
Government PLI Schemes Boosting Domestic MLCC Production
The Electronics Component Manufacturing Scheme earmarks Rs 22,919 crore (USD 2.7 billion) for passive parts, offering 4–6% sales incentives and 25% capital subsidies. [1]Sankalp Phartiyal, “India Unveils $2.7 Billion Plan for Electronics Parts Production,” Bloomberg, bloomberg.com Gujarat and Andhra Pradesh layer an extra 20–25% capex support, lowering entry costs for multilayer ceramic capacitor lines. Employment-linked payouts favor integrated fabs that combine electrode printing, ceramic firing, and test, enabling producers to lift domestic value addition from 20% to 40%. The policy targets USD 4,56,500 crore cumulative output by 2030, underwriting a stable demand floor for locally made MLCCs.
Rapid 5G Roll-out Driving High-Frequency MLCC Demand
India installed 469,000 5G base stations by February 2025, covering 99% of districts. [2]“5G Is Here, But 6G Is Coming,” Angel One, angelone.in Radio front-end modules deploy high-Q capacitors at 3.5 GHz and above; Murata’s 100 V, high-Q MLCC is specified in new macro cells. Spectrum-charge reductions and easier right-of-way rules compress deployment cycles, shifting demand into a shorter window. Small-cell densification further raises units per square kilometer, and 6G trials open specifications up to 15 GHz, intensifying the call for low-ESR ceramic parts.
Consumer Shift to Premium Smartphones with Higher MLCC Count
Premium handsets embed 900–1,100 MLCCs, compared with 400–600 units in entry-tier models. India shipped USD 15 billion worth of smartphones in 2024, with iPhones accounting for 65% of the export value. DDR5 memory regulators now utilize 25 V MLCCs on the motherboard, increasing the average voltage ratings in the bill of materials. The localization of assembly hubs in Chennai and Noida favors just-in-time passive component supply, thereby shortening reorder cycles for MLCC vendors.
Restraints Impact Analysis*
| Restraint | (~) % Impact on CAGR Forecast | Geographic Relevance | Impact Timeline |
|---|---|---|---|
| Supply Tightness of High-Purity Nickel and Palladium | -2.4% | Global supply chains affecting Indian manufacturers | Short term (≤ 2 years) |
| Volatile INR–JPY Exchange Impacting Import Costs | -1.8% | National, affecting Japanese supplier relationships | Medium term (2-4 years) |
| Skilled-Labour Gap in Flip-Chip Plating | -1.2% | Technology clusters in Bengaluru, Chennai, Pune | Long term (≥ 4 years) |
| E-Waste Compliance Burden on OEMs | -0.7% | National, stricter in urban manufacturing zones | Medium term (2-4 years) |
| Source: Mordor Intelligence | |||
Supply Tightness of High-Purity Nickel and Palladium
Nickel and palladium feedstocks underpin base-metal electrode MLCCs, yet export curbs on critical minerals raise spot prices and stretch lead times. Indian assemblers must secure multi-source contracts or carry higher inventory, tying up working capital. When shortages peak, delivery windows for high-capacitance MLCCs lengthen from weeks to months, forcing OEMs to redesign boards around available values. [3]Michael Zogbi, “MLCC Shortages and Why They Might Last Longer Than Expected,” TTI, tti.com
Volatile INR–JPY Exchange Impacting Import Costs
Japanese makers still supply more than half of global MLCC output. A 5% swing in the rupee-yen pair quickly widens procurement budgets, given the large pass-through of imported content. Although Murata’s Chennai hub reduces logistics outlays, critical automotive-grade lines remain anchored in Japan, leaving Indian buyers vulnerable to currency fluctuations.
*Our forecasts treat driver/restraint impacts as directional, not additive. The impact forecasts reflect baseline growth, mix effects, and variable interactions.
Segment Analysis
By Dielectric Type: Precision Needs Propel Class 1
Class 1 parts held 62.10% of 2025 shipments and are projected to display an 18.22% CAGR to 2031. Their tight capacitance drift suits timing loops in 5G radios and battery-management units. The India MLCC market size for Class 1 is projected to reach USD 0.63 billion by 2031. Automotive designers favor C0G/NP0 parts above 100 V, where one supplier’s 10 µF, 3225 device halves the board real estate. Class 2 volumes persist in phones and tablets due to their higher capacitance density, yet their growth trails that of precision grades. Domestic fabs eye Class 1 lines first, buoyed by PLI multipliers on high-value layers. Government labs fast-track BIS certification, easing local release cycles.


By Case Size: Miniaturization Elevates 402 Packages
The 201 footprint captured 56.05% of 2025 demand, yet 402 units show an 18.05% CAGR as handset OEMs shave board area. Murata’s 006003-inch MLCC sets a new miniaturization record, signaling where flagship wearables are heading. For powertrains and industrial drives, 603 and 1210 stay relevant because thermal mass and voltage margins overshadow size. The India MLCC market share for sub-0402 parts increases as automated optical inspection improves resolution, lifting process yields. Equipment vendors introduce feeders that place 100,000 0201 parts per hour, lowering takt time on high-mix lines.
By Voltage: Low-Voltage Devices Retain Dual Leadership
Capacitors rated ≤ 100 V command 58.85% of units and match the top CAGR at 18.11%. Tier-1 EV suppliers add 48 V lines, pushing mid-voltage usage into DC-DC converters and EPS modules. High-voltage parts above 500 V serve solar inverters and charging piles, where ceramic stability beats film equivalents in humid conditions. As fast-charging standards rise toward 240 W, even phone OEMs specify 50 V MLCCs on USB-PD ports, expanding the mid-voltage addressable base.
By MLCC Mounting Type: Metal-Cap Reliability Gains Traction
Surface-mount formats dominate with 41.25% share, favored by high-speed pick-and-place lines. Metal-cap terminations, although only a fraction of the volume, experience an 17.9% CAGR in power-train boards exposed to vibration. Flip-chip and system-in-package architectures integrate micro-MLCCs beside die, anchoring fresh demand for ultrathin substrates plated in cleanrooms.
By End-User Application: Automotive Growth Outpaces Consumer Volume
Consumer electronics accounted for 50.95% of 2025 revenue as India became the world's fourth-largest smartphone producer. The automotive sector is the fastest climber, with a 18.62% CAGR, echoing policy targets of 30% EV penetration by 2031. Industrial automation, medical imaging, and utility inverters round out specialty niches where reliability premiums offset smaller runs. The Indian MLCC industry is increasingly tailoring qualification flows, such as AEC-Q200 for vehicles and ISO 13485 for medical devices, to secure long-cycle orders.
Geography Analysis
Tamil Nadu anchors the largest slice of the India MLCC market, leveraging long-standing EMS and smartphone lines in Sriperumbudur and Chengalpattu. Murata’s 3,500 m² Chennai dispatch center halves delivery time for regional handset builders, tightening just-in-time loops. Gujarat’s Dholera cluster positions itself as a semiconductor hub, supported by a 20% state capex grant that attracts passive manufacturers to shared infrastructure with wafer fabs. Karnataka’s Bengaluru hub excels in R&D and design services, funneling prototype demand to local component distributors. Uttar Pradesh’s Greater Noida campus gains traction after HCL-Foxconn secured approval for a display-driver fab, opening a north-India consumption node for MLCCs. Maharashtra and Telangana round out the map by courting high-value projects in optics and RF, gradually diffusing concentration risk across the nation.
Competitive Landscape
Innovation and Localization Drive Future Success
Four global leaders-Murata, Samsung Electro-Mechanics, TDK, and Kyocera AVX—collectively controlled just over 60% of the 2024 shipments in the Indian MLCC market. Murata’s Chennai hub illustrates the shift from pure import to local packaging, shielding buyers from yen volatility and delivering automotive-grade parts in days rather than weeks. Samsung Electro-Mechanics targets KRW 1 trillion in 2025 automotive MLCC sales, driven by a LiDAR-qualified 2.2 µF, 1005 device that meets AEC-Q200 temperature cycling requirements. TDK’s 10 µF, 100 V part in 3225 size cuts PCB area for 48 V lines by 50%, winning design-ins with EV inverter suppliers. Kyocera AVX establishes a foothold in wearables with a 47 µF, 0402 world-first, delivering density gains in power-hungry earbuds. Domestic entrants leverage the PLI subsidy stack but still rely on imported dielectric powders and nickel paste, thereby maintaining technology barriers even as assembly localizes.
India MLCC Industry Leaders
Darfon Electronics Corporation
Holy Stone Enterprise Co., Ltd.
Jianghai Capacitor Co., Ltd.
Kyocera AVX Components Corporation
Maruwa Co., Ltd.
- *Disclaimer: Major Players sorted in no particular order


Recent Industry Developments
- August 2025: Murata began operations at its Chennai packaging facility, shipping MLCCs to smartphone and EV customers.
- August 2025: Andhra Pradesh cleared up to USD 600 million in incentives for component makers, including MLCC lines.
- April 2025: TDK released a 10 µF, 100 V MLCC in 3225 package for automotive 48 V rails.
- April 2025: The Indian government finalized guidelines for the Rs 22,919 crore.


India MLCC Market Report Scope
Class 1, Class 2 are covered as segments by Dielectric Type. 0 201, 0 402, 0 603, 1 005, 1 210, Others are covered as segments by Case Size. 500V to 1000V, Less than 500V, More than 1000V are covered as segments by Voltage. 100µF to 1000µF, Less than 100µF, More than 1000µF are covered as segments by Capacitance. Metal Cap, Radial Lead, Surface Mount are covered as segments by Mlcc Mounting Type. Aerospace and Defence, Automotive, Consumer Electronics, Industrial, Medical Devices, Power and Utilities, Telecommunication, Others are covered as segments by End User.| Class 1 |
| Class 2 |
| 201 |
| 402 |
| 603 |
| 1005 |
| 1210 |
| Other Case Sizes |
| Low Voltage (less than or equal to 100 V) |
| Mid Voltage (100 – 500 V) |
| High Voltage (above 500 V) |
| Metal Cap |
| Radial Lead |
| Surface Mount |
| Aerospace and Defence |
| Automotive |
| Consumer Electronics |
| Industrial |
| Medical Devices |
| Power and Utilities |
| Telecommunication |
| Other End-User Applications |
| By Dielectric Type | Class 1 |
| Class 2 | |
| By Case Size | 201 |
| 402 | |
| 603 | |
| 1005 | |
| 1210 | |
| Other Case Sizes | |
| By Voltage | Low Voltage (less than or equal to 100 V) |
| Mid Voltage (100 – 500 V) | |
| High Voltage (above 500 V) | |
| By MLCC Mounting Type | Metal Cap |
| Radial Lead | |
| Surface Mount | |
| By End-User Application | Aerospace and Defence |
| Automotive | |
| Consumer Electronics | |
| Industrial | |
| Medical Devices | |
| Power and Utilities | |
| Telecommunication | |
| Other End-User Applications |


Market Definition
- MLCC (Multilayer Ceramic Capacitor) - A type of capacitor that consists of multiple layers of ceramic material, alternating with conductive layers, used for energy storage and filtering in electronic circuits.
- Voltage - The maximum voltage that a capacitor can safely withstand without experiencing breakdown or failure. It is typically expressed in volts (V)
- Capacitance - The measure of a capacitor's ability to store electrical charge, expressed in farads (F). It determines the amount of energy that can be stored in the capacitor
- Case Size - The physical dimensions of an MLCC, typically expressed in codes or millimeters, indicating its length, width, and height
| Keyword | Definition |
|---|---|
| MLCC (Multilayer Ceramic Capacitor) | A type of capacitor that consists of multiple layers of ceramic material, alternating with conductive layers, used for energy storage and filtering in electronic circuits. |
| Capacitance | The measure of a capacitor's ability to store electrical charge, expressed in farads (F). It determines the amount of energy that can be stored in the capacitor |
| Voltage Rating | The maximum voltage that a capacitor can safely withstand without experiencing breakdown or failure. It is typically expressed in volts (V) |
| ESR (Equivalent Series Resistance) | The total resistance of a capacitor, including its internal resistance and parasitic resistances. It affects the capacitor's ability to filter high-frequency noise and maintain stability in a circuit. |
| Dielectric Material | The insulating material used between the conductive layers of a capacitor. In MLCCs, commonly used dielectric materials include ceramic materials like barium titanate and ferroelectric materials |
| SMT (Surface Mount Technology) | A method of electronic component assembly that involves mounting components directly onto the surface of a printed circuit board (PCB) instead of through-hole mounting. |
| Solderability | The ability of a component, such as an MLCC, to form a reliable and durable solder joint when subjected to soldering processes. Good solderability is crucial for proper assembly and functionality of MLCCs on PCBs. |
| RoHS (Restriction of Hazardous Substances) | A directive that restricts the use of certain hazardous materials, such as lead, mercury, and cadmium, in electrical and electronic equipment. Compliance with RoHS is essential for automotive MLCCs due to environmental regulations |
| Case Size | The physical dimensions of an MLCC, typically expressed in codes or millimeters, indicating its length, width, and height |
| Flex Cracking | A phenomenon where MLCCs can develop cracks or fractures due to mechanical stress caused by bending or flexing of the PCB. Flex cracking can lead to electrical failures and should be avoided during PCB assembly and handling. |
| Aging | MLCCs can experience changes in their electrical properties over time due to factors like temperature, humidity, and applied voltage. Aging refers to the gradual alteration of MLCC characteristics, which can impact the performance of electronic circuits. |
| ASPs (Average Selling Prices) | The average price at which MLCCs are sold in the market, expressed in USD million. It reflects the average price per unit |
| Voltage | The electrical potential difference across an MLCC, often categorized into low-range voltage, mid-range voltage, and high-range voltage, indicating different voltage levels |
| MLCC RoHS Compliance | Compliance with the Restriction of Hazardous Substances (RoHS) directive, which restricts the use of certain hazardous substances, such as lead, mercury, cadmium, and others, in the manufacturing of MLCCs, promoting environmental protection and safety |
| Mounting Type | The method used to attach MLCCs to a circuit board, such as surface mount, metal cap, and radial lead, which indicates the different mounting configurations |
| Dielectric Type | The type of dielectric material used in MLCCs, often categorized into Class 1 and Class 2, representing different dielectric characteristics and performance |
| Low-Range Voltage | MLCCs designed for applications that require lower voltage levels, typically in the low voltage range |
| Mid-Range Voltage | MLCCs designed for applications that require moderate voltage levels, typically in the middle range of voltage requirements |
| High-Range Voltage | MLCCs designed for applications that require higher voltage levels, typically in the high voltage range |
| Low-Range Capacitance | MLCCs with lower capacitance values, suitable for applications that require smaller energy storage |
| Mid-Range Capacitance | MLCCs with moderate capacitance values, suitable for applications that require intermediate energy storage |
| High-Range Capacitance | MLCCs with higher capacitance values, suitable for applications that require larger energy storage |
| Surface Mount | MLCCs designed for direct surface mounting onto a printed circuit board (PCB), allowing for efficient space utilization and automated assembly |
| Class 1 Dielectric | MLCCs with Class 1 dielectric material, characterized by a high level of stability, low dissipation factor, and low capacitance change over temperature. They are suitable for applications requiring precise capacitance values and stability |
| Class 2 Dielectric | MLCCs with Class 2 dielectric material, characterized by a high capacitance value, high volumetric efficiency, and moderate stability. They are suitable for applications that require higher capacitance values and are less sensitive to capacitance changes over temperature |
| RF (Radio Frequency) | It refers to the range of electromagnetic frequencies used in wireless communication and other applications, typically from 3 kHz to 300 GHz, enabling the transmission and reception of radio signals for various wireless devices and systems. |
| Metal Cap | A protective metal cover used in certain MLCCs (Multilayer Ceramic Capacitors) to enhance durability and shield against external factors like moisture and mechanical stress |
| Radial Lead | A terminal configuration in specific MLCCs where electrical leads extend radially from the ceramic body, facilitating easy insertion and soldering in through-hole mounting applications. |
| Temperature Stability | The ability of MLCCs to maintain their capacitance values and performance characteristics across a range of temperatures, ensuring reliable operation in varying environmental conditions. |
| Low ESR (Equivalent Series Resistance) | MLCCs with low ESR values have minimal resistance to the flow of AC signals, allowing for efficient energy transfer and reduced power losses in high-frequency applications. |


Research Methodology
Mordor Intelligence has followed the following methodology in all our MLCC reports.
- Step 1: Identify Data Points: In this step, we identified key data points crucial for comprehending the MLCC market. This included historical and current production figures, as well as critical device metrics such as attachment rate, sales, production volume, and average selling price. Additionally, we estimated future production volumes and attachment rates for MLCCs in each device category. Lead times were also determined, aiding in forecasting market dynamics by understanding the time required for production and delivery, thereby enhancing the accuracy of our projections.
- Step 2: Identify Key Variables: In this step, we focused on identifying crucial variables essential for constructing a robust forecasting model for the MLCC market. These variables include lead times, trends in raw material prices used in MLCC manufacturing, automotive sales data, consumer electronics sales figures, and electric vehicle (EV) sales statistics. Through an iterative process, we determined the necessary variables for accurate market forecasting and proceeded to develop the forecasting model based on these identified variables.
- Step 3: Build a Market Model: In this step, we utilized production data and key industry trend variables, such as average pricing, attachment rate, and forecasted production data, to construct a comprehensive market estimation model. By integrating these critical variables, we developed a robust framework for accurately forecasting market trends and dynamics, thereby facilitating informed decision-making within the MLCC market landscape.
- Step 4: Validate and Finalize: In this crucial step, all market numbers and variables derived through an internal mathematical model were validated through an extensive network of primary research experts from all the markets studied. The respondents are selected across levels and functions to generate a holistic picture of the market studied.
- Step 5: Research Outputs: Syndicated Reports, Custom Consulting Assignments, Databases, and Subscription Platform


