Asia-Pacific MLCC Market Size and Share
Market Overview
| Study Period | 2020 - 2031 |
|---|---|
| Forecast Data Period | 2026 - 2031 |
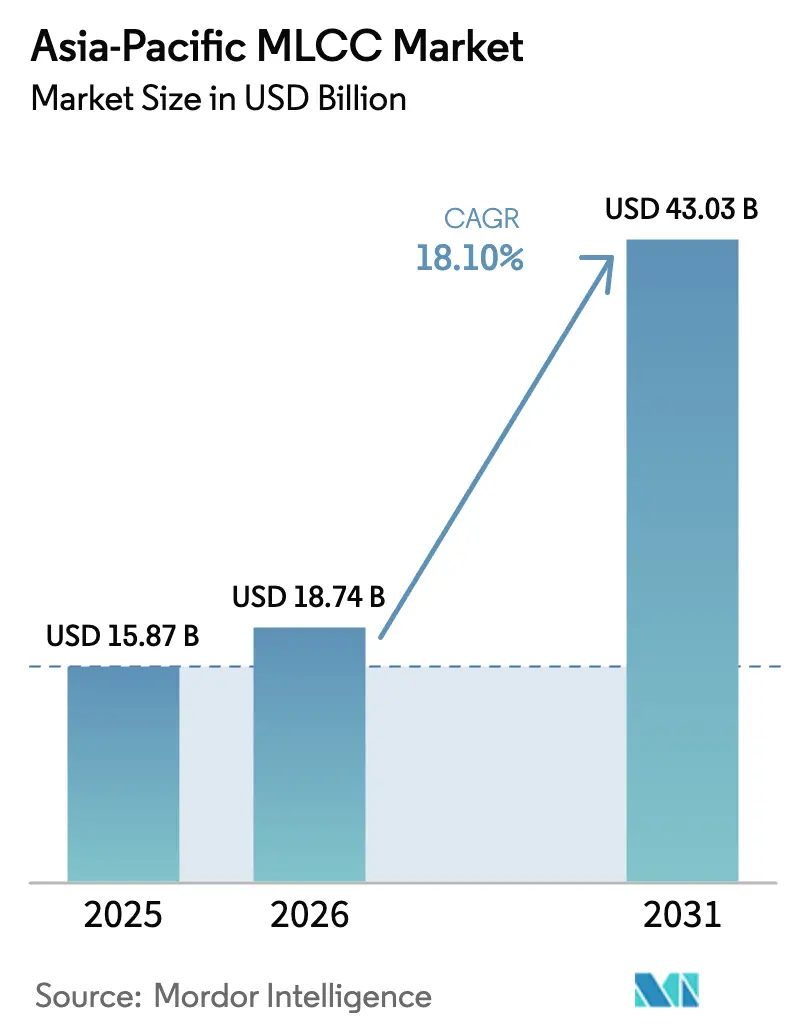
| Base Year Market Size (2025) | USD 15.87 Billion |
| Market Size (2026) | USD 18.74 Billion |
| Market Size (2031) | USD 43.03 Billion |
| Growth Rate (2026 - 2031) | 18.10% CAGR |
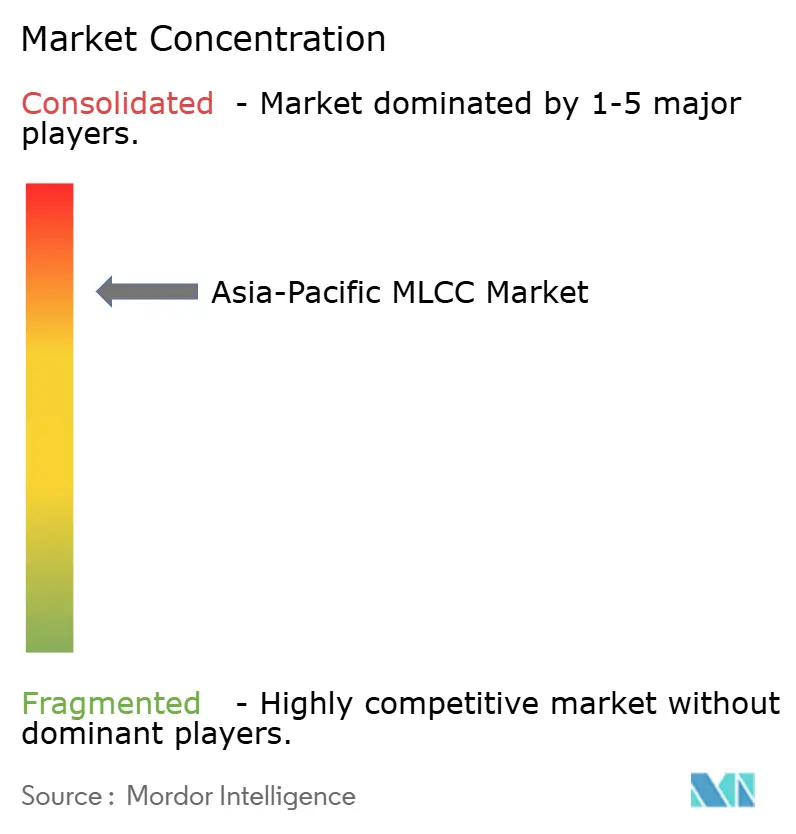
| Market Concentration | High |
Major Players *Disclaimer: Major Players sorted in no particular order Image © Mordor Intelligence. Reuse requires attribution under CC BY 4.0. | |
Asia-Pacific MLCC Market Analysis by Mordor Intelligence
The Asia-Pacific MLCC market size is expected to grow from USD 15.87 billion in 2025 to USD 18.74 billion in 2026 and is forecast to reach USD 43.03 billion by 2031 at 18.10% CAGR over 2026-2031. In 2025, demand inflection points include 5G base-station roll-outs, AI server expansion, and a steep increase in electric-vehicle (EV) production-all of which embed thousands of capacitors per end product and therefore magnify unit consumption across the Asia-Pacific MLCC market. Robust government incentives in China, India, and Southeast Asia add capacity while the transition toward high-voltage 48 V and emerging 800 V vehicle platforms pushes average selling prices up in tandem with volumes. Tight raw-material supply, especially for nickel electrodes and barium titanate powders, maintains pricing discipline for qualified suppliers even as overall wafer-level conversion yields improve. Competitive strategies revolve around miniaturization leadership, high-reliability automotive design wins, and geographic diversification of production footprints into Vietnam, Malaysia, and the Philippines. The simultaneous spike in AI edge hardware and consumer-electronics miniaturization gives companies able to mass-produce sub-0402 formats a sizable share-of-wallet advantage.
Key Report Takeaways
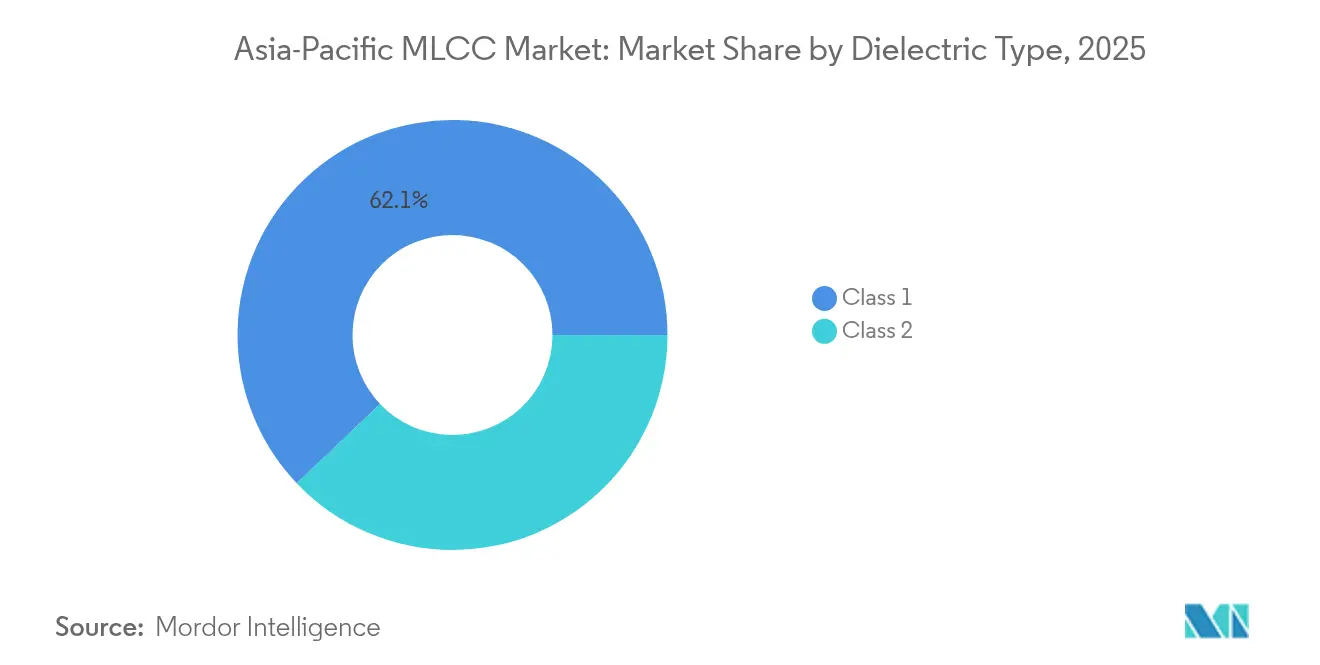
- By dielectric type, Class 1 captured 62.10% of the Asia-Pacific MLCC market share in 2025 and is projected to expand at a 19.05% CAGR through 2031.
- By case size, the 201 package accounted for 55.85% of the Asia-Pacific MLCC market share in 2025, whereas the 402 format is forecast to deliver the fastest growth, with a 19.10% CAGR to 2031.
- By voltage, low-voltage MLCCs (≤100 V) held 58.90% of the Asia-Pacific MLCC market share in 2025, while high-voltage parts (≥500 V) are poised to advance at an 18.35% CAGR over the same horizon.
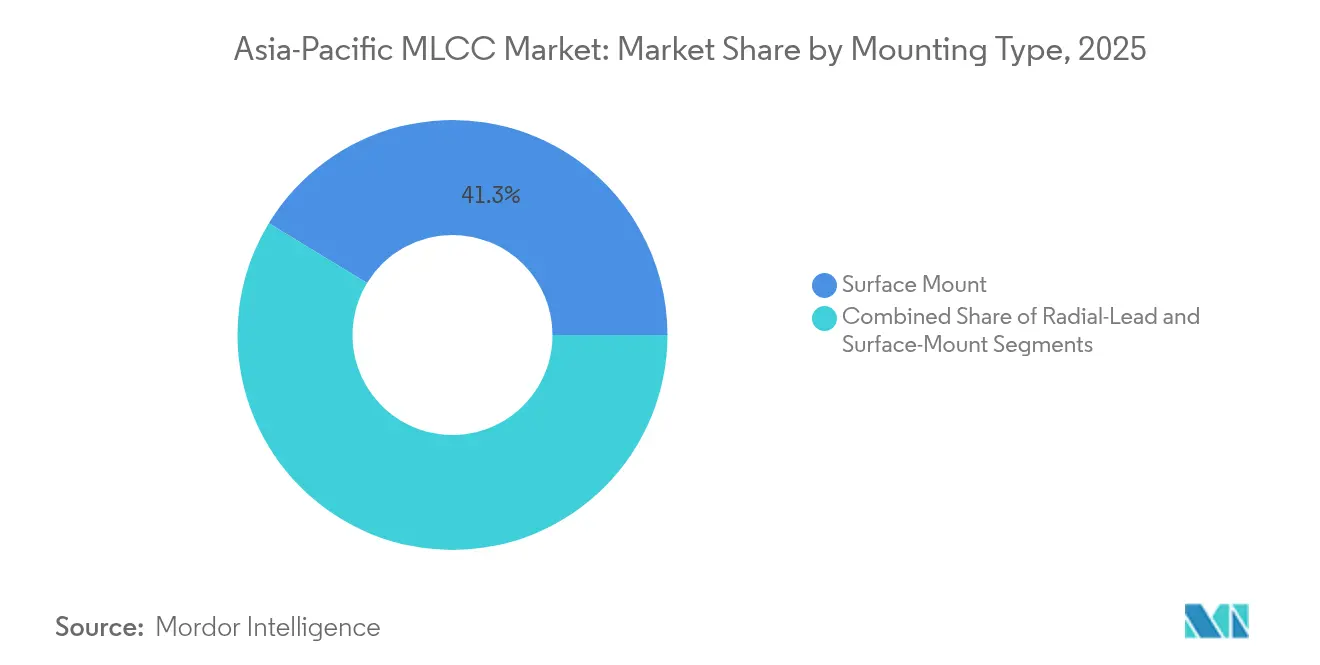
- By MLCC Mounting Type, surface-mount technology led the Asia-Pacific MLCC market with a 41.30% share in 2025; metal-cap variants recorded the highest 18.95% CAGR through 2031.
- By End-User Application, consumer electronics represented 50.95% of the Asia-Pacific MLCC market size in 2025, while automotive demand is projected to accelerate at a 19.35% CAGR until 2031.
- By geography, the Rest of Asia-Pacific dominated the Asia-Pacific MLCC market with 43.75% of the market share in 2025; China exhibited the fastest 19.25% CAGR during the forecast period.
Note: Market size and forecast figures in this report are generated using Mordor Intelligence’s proprietary estimation framework, updated with the latest available data and insights as of 2026.
Asia-Pacific MLCC Market Trends and Insights
Drivers Impact Analysis*
| Driver | (~) % Impact on CAGR Forecast | Geographic Relevance | Impact Timeline |
|---|---|---|---|
| Surge in 5G-enabled smartphone production | +4.2% | China, South Korea, India | Medium term (2-4 years) |
| Electrification of vehicles boosting MLCC volume per car | +5.8% | China, Japan, South Korea | Long term (≥ 4 years) |
| Consumer-electronics miniaturization demands higher capacitance density | +3.1% | Pan-regional | Short term (≤ 2 years) |
| Emergence of AI edge devices requiring high-frequency MLCC | +2.9% | China, Japan, Taiwan | Medium term (2-4 years) |
| Large-scale 5G base-station deployments across Asia | +3.7% | China, India, Southeast Asia | Medium term (2-4 years) |
| Government incentive programs expanding electronics-component manufacturing | +2.2% | India, China, Vietnam | Short term (≤ 2 years) |
| Source: Mordor Intelligence | |||
Surge in 5G-Enabled Smartphone Production
Fourth-generation handsets averaged 800–900 MLCCs, whereas 5G flagships now embed 1,200–1,500 units. China alone targets more than 5 million base stations by 2027, an infrastructure push that cascades into handset demand for high-Q, sub-1 nH equivalents used in RF front-end modules. Murata’s February 2024 launch of a high-Q 100 V MLCC in a 0402 envelope illustrates how suppliers with proprietary ceramic chemistries capture design slots in ultra-compact antennas and filter banks. [1]Murata Manufacturing Co., Ltd., “Murata Introduces the World's Smallest High-Q 100 V MLCC,” murata.com Korean and Japanese makers, who already supply major handset OEMs, benefit first, while Chinese brands accelerate “local for local” sourcing to mitigate geopolitical shocks.
Electrification of Vehicles Boosting MLCC Volume per Car
Battery EVs require 18,000–20,000 capacitors, compared to 3,000–5,000 units in gasoline models, making the automobile the single fastest-growing insertion point within the Asia-Pacific MLCC market. The migration to 48 V auxiliaries and 800 V traction inverters raises voltage classes to 100 V and above, prompting TDK’s April 2025 release of a 10 µF, 100 V MLCC qualified to AEC-Q200 standards. [2]TDK Corporation, “Multilayer Ceramic Capacitors with Industry-Highest Capacitance at 100 V,” tdk.com Samsung Electro-Mechanics followed in February 2025 with the first LiDAR-rated capacitor, underscoring how ADAS subsystems widen the total addressable content per vehicle. Automotive qualification cycles run three to five years, preserving pricing power for incumbents.
Consumer-Electronics Miniaturization Demands Higher Capacitance Density
Murata reached 100 µF in a 0603 package in July 2024, cutting board real estate by 60% while doubling capacitance per square millimeter. Wearables, foldable phones, and ultra-slim laptops are all pivoting toward sub-0402 footprints. Kyocera-AVX’s March 2025 release of a 47 µF 0402 part demonstrates a fast-follower dynamic that raises the entry bar for suppliers lacking thin-layer deposition expertise. As 0201 devices penetrate power-distribution networks, fabs without optical-metrology and defect-density controls cannot compete on yield.
Emergence of AI Edge Devices Requiring High-Frequency MLCC
AI servers draw 2-3 times the total capacitance of conventional racks and require very low ESR values at frequencies beyond 500 kHz. Samsung Electro-Mechanics’ 25 V portfolio for DDR5 memory regulators addresses exactly this switch-mode zone. China’s AI-data center build-out, incentivized under the 14th Five-Year Plan, concentrates demand for these premium MLCCs in the Guangdong, Shanghai, and Jiangsu clusters. Japanese and Korean suppliers with strong high-frequency pedigree secure early production volumes, while Taiwanese ODMs encourage second-source qualification to stabilize supply.
Restraints Impact Analysis*
| Restraint | (~) % Impact on CAGR Forecast | Geographic Relevance | Impact Timeline |
|---|---|---|---|
| Chronic supply–demand imbalance driving price volatility | -2.8% | Pan-regional | Short term (≤ 2 years) |
| Nickel and rare-earth cost fluctuations | -1.9% | China, Japan, South Korea | Medium term (2-4 years) |
| Raw-material supply disruptions from natural disasters | -2.4% | United States, Japan, Philippines | Short term (≤ 2 years) |
| High technical entry barriers limiting new capacity | -1.5% | Global Asia-Pacific | Long term (≥ 4 years) |
| Source: Mordor Intelligence | |||
Chronic Supply–Demand Imbalance Driving Price Volatility
Since 2020, leading producers refocused capacity toward automotive and industrial-grade SKUs, leaving mid-range commodity MLCCs undersupplied. Lead times for popular 0402 1 µF 16 V parts peaked above 52 weeks in early 2025, constraining downstream board assemblers. Natural-disaster events-such as Hurricane Helene’s September 2024 disruption of high-purity quartz mining-exposed fragility in upstream feedstocks critical to fine-grain dielectric powders. [3]TechXplore, “Hurricane Helene Shut Down NC Mine Pivotal to Semiconductor Supply,” techxplore.com Vertically integrated firms that own ceramic-powder synthesis and internal front-line plating lines are better equipped to navigate shortages than distributors dependent on spot purchases.
Nickel and Rare-Earth Cost Fluctuations
Electrode stacks consume nickel paste, whereas high-εr ceramic systems rely on dysprosium and other heavy rare-earth elements. China’s October 2024 regulations introduced traceability audits on export quotas, compressing merchant availability and raising spot prices despite a 30% decline earlier in the year. Suppliers with forward contracts and reclaim technologies partially buffer gross margin swings; smaller entrants see profitability erode as powder prices fluctuate.
*Our forecasts treat driver/restraint impacts as directional, not additive. The impact forecasts reflect baseline growth, mix effects, and variable interactions.
Segment Analysis
By Dielectric Type: Class 1 Maintains Performance Edge
Class 1 devices held a 62.10% share in 2025, a leadership position rooted in near-zero temperature coefficient performance, which is essential for RF power amplifiers and precision timing circuits. Average selling prices attached to Class 1 parts tend to be 15–20% higher than those of Class 2 because volumetric efficiency yields cannot offset the need for stable capacitance across the –55 °C to 125 °C temperature range. As a result, the Asia-Pacific MLCC market size tied to Class 1 is set to climb from USD 11.74 billion in 2026 to USD 28.06 billion by 2031. Japan’s intellectual property advantage in C0G/NP0 chemistries maintains high-barrier control, while Chinese fab expansions currently focus on Class 2 high-capacitance lines.
Rising 5G radio shipments pull Class 1 demand into double-digit growth across handset, small-cell, and base-station sectors. At the same time, automotive electronic-control units are tightening tolerance windows under ISO 26262 functional-safety norms, pushing Tier 1s to prefer Class 1 for powertrain and braking controllers. This dual adoption curve explains why the Asia-Pacific MLCC market registers one of the highest growth premia versus other passive components.


By Case Size: 402 Format Outpaces 201 Leadership
201 packages delivered 55.85% of 2025 revenue, yet the 402 size posts the fastest CAGR at 19.10% through 2031. That performance stems from an inflection where power-delivery-network engineers want above 22 µF in footprints no thicker than 0.6 mm. Murata’s 100 µF 0603 announcement highlights how ongoing miniaturization continues to propagate into ever-smaller outlines without sacrificing capacitance density. As the Asia-Pacific MLCC industry transitions to 20 µm ceramic layers, defect density control becomes the key factor determining viable sub-0402 yields.
The Asia-Pacific MLCC market size, related to 402 shipments, is projected to increase from USD 4.34 billion in 2026 to USD 10.44 billion in 2031. Production footprints increasingly reside in Malaysia and Vietnam, where new-build cleanrooms offer “copy-exact” replication of headquarters process recipes. Capital spend allocations target dual-source sintering ovens to hedge energy-interruption risks.
By Voltage: High-Voltage SKUs Command Premiums
Low-voltage MLCCs represented 58.90% of the 2025 turnover, but high-voltage (≥500 V) parts grew faster at an 18.35% CAGR, driven by the proliferation of EV traction inverters and solar inverters. The Asia-Pacific MLCC market share for high-voltage devices is modest yet immediately profitable, with unit ASPs three to five times higher than those of smartphones. TDK utilizes laminated-electrode void-control technology to certify 100 V MLCCs for 48 V auxiliary systems, while Murata and Samsung expand their 630 V lines for DC-link filtering in on-board chargers.
Long-haul adoption hinges on stable dielectric-layer thickness exceeding 25 µm, compelling suppliers to deploy advanced co-firing furnaces and humidity-controlled cleanrooms. Japanese vendors already hold ample patent coverage, making licenses or green-field R&D a costly barrier for latecomers.
By Mounting Type: Metal-Cap Uptick in Harsh-Duty Zones
Surface-mount configurations remain the workhorse, accounting for 41.30% of 2025 turnover. Yet metal-cap variants, prized for mechanical robustness under thermal cycling, register a 18.95% CAGR on the back of automotive and aerospace programs. AEC-Q200 revisions now encourage metal-cap terminations for zones exceeding 125 °C or enduring vibration above 14 grms. As a result, the Asia-Pacific MLCC market size for metal-cap parts could triple to USD 6.62 billion by 2031. Process complexity and lower throughput compared to standard Ni/Sn terminations limit the supplier field to a handful of highly automated lines in Japan and South Korea.
By End-User Application: Automotive Narrowing Gap with Consumer Electronics
Consumer electronics contributed 50.95% of 2025 revenue; however, automotive penetration, advancing at a 19.35% CAGR, is expected to push the segment from USD 4.58 billion in 2026 to nearly USD 11.13 billion in 2031. The Asia-Pacific MLCC industry responds with differentiated high-voltage, high-reliability portfolios that meet ISO 26262 and IATF 16949 controls. In parallel, telecom-infrastructure deployments tied to 5G and Open RAN add steady multi-billion-dollar demand for RF-grade capacitors.
Geography Analysis
The rest of the Asia-Pacific holds 43.75% of the 2025 turnover, thanks to a cluster of EMS hubs that integrate capacitors directly into PCBAs destined for global handset and laptop OEMs. Vietnam and Malaysia draw incremental lines as Japanese and Korean groups diversify away from single-country exposure. Murata’s Philippines expansion, valued at JPY 11.2 billion, secures capacitor output continuity while capturing local tax incentives.
China’s momentum rests on the twin pillars of the world’s largest EV market and an aggressive 5G macro-cell agenda. Passenger-car electrification, which is projected to reach 36% penetration by 2024, is expected to add up to 280 billion MLCC units annually by 2027. Domestic makers, such as Fenghua, accelerate fab-build schedules, but premium automotive and high-frequency slots still rely on Japanese imports under long-term supply agreements. Policy-driven rare-earth traceability introduces cost uncertainty, prompting downstream OEMs to consider dual sourcing from Southeast Asia.
Japan and South Korea, though smaller in shipment volume, command technology-intensive niches. Murata’s thin-layer co-firing patents and Samsung Electro-Mechanics’ void-minimization know-how anchor premium margin pools. India’s PLI rollout creates a nascent pull for local MLCC tonnage, with at least two multinational contenders reportedly evaluating sites in Tamil Nadu and Gujarat for a 2026 start-up.
Competitive Landscape
Innovation and Specialization Drive Market Success
Japanese incumbents maintain approximately 56% regional share, with Murata alone accounting for an estimated 34%. High-entry moats encompass 30-plus-year ceramic chemistry IP portfolios, multi-decade OEM relationships, and stringent automotive-quality pedigrees. Korean competitor Samsung Electro-Mechanics integrates upstream with Samsung Electronics to meet demand for handsets and memory DIMMs, enabling economies of scope that newer Chinese challengers struggle to match.
Strategic capital expenditures concentrate on sub-0201 lines, high-voltage 100 V+ stacks, and geographic risk hedging. Murata’s 2025 Vietnam plant is expected to add 12 billion units annually by 2027, while TDK invests in furnace electrification and CO₂ Abatement to address Scope 1 emissions compliance. Chinese entrants, who leverage low-cost labor and state subsidies, struggle to attain AEC-Q200 zero-ppm goals required by global Tier 1 automotive customers. As design cycles for AI accelerators shorten, ODMs increasingly value suppliers that can co-engineer power-delivery networks, solidifying share for technology leaders.
M&A interest focuses on niche metal-cap and ultra-high-voltage specialists. Vertical integration into powder synthesis reemerges as a hedge against upstream price swings, with at least two Japanese majors reportedly negotiating stakes in barium-titanate mines in Southeast Asia.
Asia-Pacific MLCC Industry Leaders
Kyocera AVX Components Corporation
Maruwa Co., Ltd.
Murata Manufacturing Co., Ltd.
Nippon Chemi-Con Corporation
Samsung Electro-Mechanics Co., Ltd.
- *Disclaimer: Major Players sorted in no particular order

Recent Industry Developments
- July 2025: Murata begins mass production of a 47 µF MLCC in the 0402 size for AI-server PDNs
- May 2023: Murata starts construction of a new Vietnam building to expand automotive-coil capacity
- April 2025: TDK debuts a 10 µF, 100 V automotive MLCC in the 3225 case, targeting 48 V systems
- March 2025: India approves a ₹22,919 crore PLI scheme to catalyze passive-component investment


Asia-Pacific MLCC Market Report Scope
Class 1, Class 2 are covered as segments by Dielectric Type. 0 201, 0 402, 0 603, 1 005, 1 210, Others are covered as segments by Case Size. 500V to 1000V, Less than 500V, More than 1000V are covered as segments by Voltage. 100µF to 1000µF, Less than 100µF, More than 1000µF are covered as segments by Capacitance. Metal Cap, Radial Lead, Surface Mount are covered as segments by Mlcc Mounting Type. Aerospace and Defence, Automotive, Consumer Electronics, Industrial, Medical Devices, Power and Utilities, Telecommunication, Others are covered as segments by End User. China, India, Japan, South Korea, Others are covered as segments by Country.| Class 1 |
| Class 2 |
| 201 |
| 402 |
| 603 |
| 1005 |
| 1210 |
| Other Case Sizes |
| Low Voltage (less than or equal to 100 V) |
| Mid Voltage (100 – 500 V) |
| High Voltage (above 500 V) |
| Metal-Cap |
| Radial-Lead |
| Surface-Mount |
| Aerospace and Defence |
| Automotive |
| Consumer Electronics |
| Industrial |
| Medical Devices |
| Power and Utilities |
| Telecommunication |
| Other End-User Applications |
| China |
| Japan |
| South Korea |
| India |
| Rest of Asia-Pacific |
| By Dielectric Type | Class 1 |
| Class 2 | |
| By Case Size | 201 |
| 402 | |
| 603 | |
| 1005 | |
| 1210 | |
| Other Case Sizes | |
| By Voltage | Low Voltage (less than or equal to 100 V) |
| Mid Voltage (100 – 500 V) | |
| High Voltage (above 500 V) | |
| By MLCC Mounting Type | Metal-Cap |
| Radial-Lead | |
| Surface-Mount | |
| By End-User Application | Aerospace and Defence |
| Automotive | |
| Consumer Electronics | |
| Industrial | |
| Medical Devices | |
| Power and Utilities | |
| Telecommunication | |
| Other End-User Applications | |
| By Country | China |
| Japan | |
| South Korea | |
| India | |
| Rest of Asia-Pacific |


Market Definition
- MLCC (Multilayer Ceramic Capacitor) - A type of capacitor that consists of multiple layers of ceramic material, alternating with conductive layers, used for energy storage and filtering in electronic circuits.
- Voltage - The maximum voltage that a capacitor can safely withstand without experiencing breakdown or failure. It is typically expressed in volts (V)
- Capacitance - The measure of a capacitor's ability to store electrical charge, expressed in farads (F). It determines the amount of energy that can be stored in the capacitor
- Case Size - The physical dimensions of an MLCC, typically expressed in codes or millimeters, indicating its length, width, and height
| Keyword | Definition |
|---|---|
| MLCC (Multilayer Ceramic Capacitor) | A type of capacitor that consists of multiple layers of ceramic material, alternating with conductive layers, used for energy storage and filtering in electronic circuits. |
| Capacitance | The measure of a capacitor's ability to store electrical charge, expressed in farads (F). It determines the amount of energy that can be stored in the capacitor |
| Voltage Rating | The maximum voltage that a capacitor can safely withstand without experiencing breakdown or failure. It is typically expressed in volts (V) |
| ESR (Equivalent Series Resistance) | The total resistance of a capacitor, including its internal resistance and parasitic resistances. It affects the capacitor's ability to filter high-frequency noise and maintain stability in a circuit. |
| Dielectric Material | The insulating material used between the conductive layers of a capacitor. In MLCCs, commonly used dielectric materials include ceramic materials like barium titanate and ferroelectric materials |
| SMT (Surface Mount Technology) | A method of electronic component assembly that involves mounting components directly onto the surface of a printed circuit board (PCB) instead of through-hole mounting. |
| Solderability | The ability of a component, such as an MLCC, to form a reliable and durable solder joint when subjected to soldering processes. Good solderability is crucial for proper assembly and functionality of MLCCs on PCBs. |
| RoHS (Restriction of Hazardous Substances) | A directive that restricts the use of certain hazardous materials, such as lead, mercury, and cadmium, in electrical and electronic equipment. Compliance with RoHS is essential for automotive MLCCs due to environmental regulations |
| Case Size | The physical dimensions of an MLCC, typically expressed in codes or millimeters, indicating its length, width, and height |
| Flex Cracking | A phenomenon where MLCCs can develop cracks or fractures due to mechanical stress caused by bending or flexing of the PCB. Flex cracking can lead to electrical failures and should be avoided during PCB assembly and handling. |
| Aging | MLCCs can experience changes in their electrical properties over time due to factors like temperature, humidity, and applied voltage. Aging refers to the gradual alteration of MLCC characteristics, which can impact the performance of electronic circuits. |
| ASPs (Average Selling Prices) | The average price at which MLCCs are sold in the market, expressed in USD million. It reflects the average price per unit |
| Voltage | The electrical potential difference across an MLCC, often categorized into low-range voltage, mid-range voltage, and high-range voltage, indicating different voltage levels |
| MLCC RoHS Compliance | Compliance with the Restriction of Hazardous Substances (RoHS) directive, which restricts the use of certain hazardous substances, such as lead, mercury, cadmium, and others, in the manufacturing of MLCCs, promoting environmental protection and safety |
| Mounting Type | The method used to attach MLCCs to a circuit board, such as surface mount, metal cap, and radial lead, which indicates the different mounting configurations |
| Dielectric Type | The type of dielectric material used in MLCCs, often categorized into Class 1 and Class 2, representing different dielectric characteristics and performance |
| Low-Range Voltage | MLCCs designed for applications that require lower voltage levels, typically in the low voltage range |
| Mid-Range Voltage | MLCCs designed for applications that require moderate voltage levels, typically in the middle range of voltage requirements |
| High-Range Voltage | MLCCs designed for applications that require higher voltage levels, typically in the high voltage range |
| Low-Range Capacitance | MLCCs with lower capacitance values, suitable for applications that require smaller energy storage |
| Mid-Range Capacitance | MLCCs with moderate capacitance values, suitable for applications that require intermediate energy storage |
| High-Range Capacitance | MLCCs with higher capacitance values, suitable for applications that require larger energy storage |
| Surface Mount | MLCCs designed for direct surface mounting onto a printed circuit board (PCB), allowing for efficient space utilization and automated assembly |
| Class 1 Dielectric | MLCCs with Class 1 dielectric material, characterized by a high level of stability, low dissipation factor, and low capacitance change over temperature. They are suitable for applications requiring precise capacitance values and stability |
| Class 2 Dielectric | MLCCs with Class 2 dielectric material, characterized by a high capacitance value, high volumetric efficiency, and moderate stability. They are suitable for applications that require higher capacitance values and are less sensitive to capacitance changes over temperature |
| RF (Radio Frequency) | It refers to the range of electromagnetic frequencies used in wireless communication and other applications, typically from 3 kHz to 300 GHz, enabling the transmission and reception of radio signals for various wireless devices and systems. |
| Metal Cap | A protective metal cover used in certain MLCCs (Multilayer Ceramic Capacitors) to enhance durability and shield against external factors like moisture and mechanical stress |
| Radial Lead | A terminal configuration in specific MLCCs where electrical leads extend radially from the ceramic body, facilitating easy insertion and soldering in through-hole mounting applications. |
| Temperature Stability | The ability of MLCCs to maintain their capacitance values and performance characteristics across a range of temperatures, ensuring reliable operation in varying environmental conditions. |
| Low ESR (Equivalent Series Resistance) | MLCCs with low ESR values have minimal resistance to the flow of AC signals, allowing for efficient energy transfer and reduced power losses in high-frequency applications. |


Research Methodology
Mordor Intelligence has followed the following methodology in all our MLCC reports.
- Step 1: Identify Data Points: In this step, we identified key data points crucial for comprehending the MLCC market. This included historical and current production figures, as well as critical device metrics such as attachment rate, sales, production volume, and average selling price. Additionally, we estimated future production volumes and attachment rates for MLCCs in each device category. Lead times were also determined, aiding in forecasting market dynamics by understanding the time required for production and delivery, thereby enhancing the accuracy of our projections.
- Step 2: Identify Key Variables: In this step, we focused on identifying crucial variables essential for constructing a robust forecasting model for the MLCC market. These variables include lead times, trends in raw material prices used in MLCC manufacturing, automotive sales data, consumer electronics sales figures, and electric vehicle (EV) sales statistics. Through an iterative process, we determined the necessary variables for accurate market forecasting and proceeded to develop the forecasting model based on these identified variables.
- Step 3: Build a Market Model: In this step, we utilized production data and key industry trend variables, such as average pricing, attachment rate, and forecasted production data, to construct a comprehensive market estimation model. By integrating these critical variables, we developed a robust framework for accurately forecasting market trends and dynamics, thereby facilitating informed decision-making within the MLCC market landscape.
- Step 4: Validate and Finalize: In this crucial step, all market numbers and variables derived through an internal mathematical model were validated through an extensive network of primary research experts from all the markets studied. The respondents are selected across levels and functions to generate a holistic picture of the market studied.
- Step 5: Research Outputs: Syndicated Reports, Custom Consulting Assignments, Databases, and Subscription Platform


