Consumer Electronics MLCC Market Size and Share
Market Overview
| Study Period | 2020 - 2031 |
|---|---|
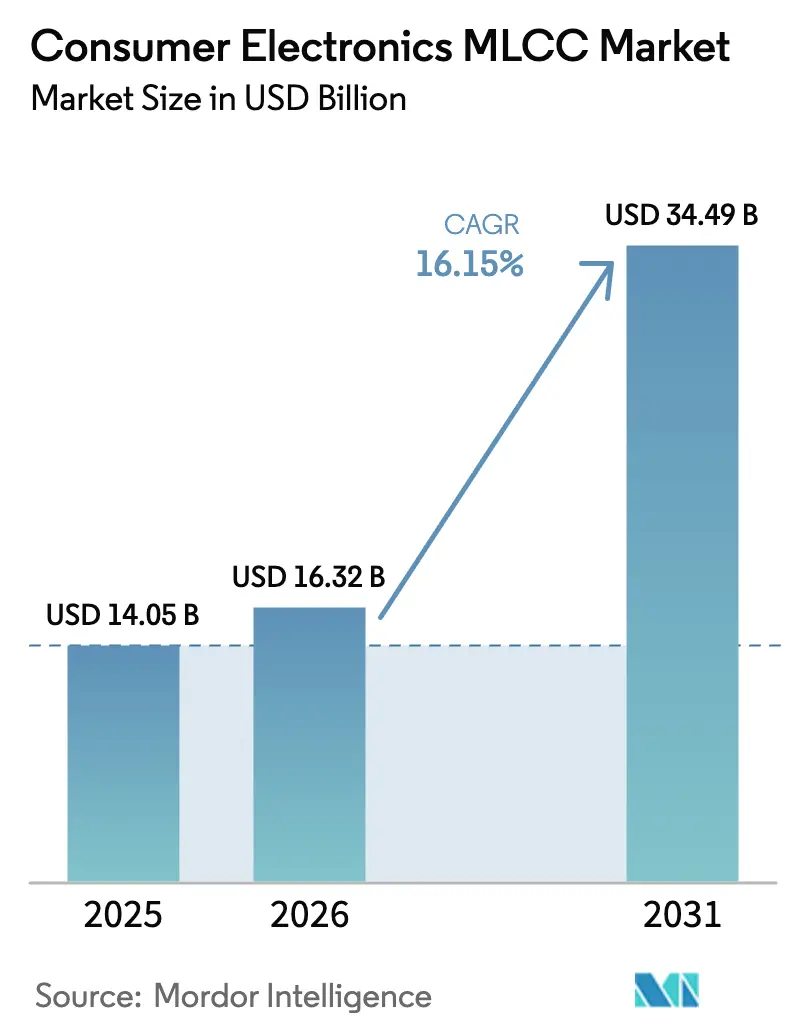
| Market Size (2026) | USD 16.32 Billion |
| Market Size (2031) | USD 34.49 Billion |
| Growth Rate (2026 - 2031) | 16.15% CAGR |
| Fastest Growing Market | Asia Pacific |
| Largest Market | North America |
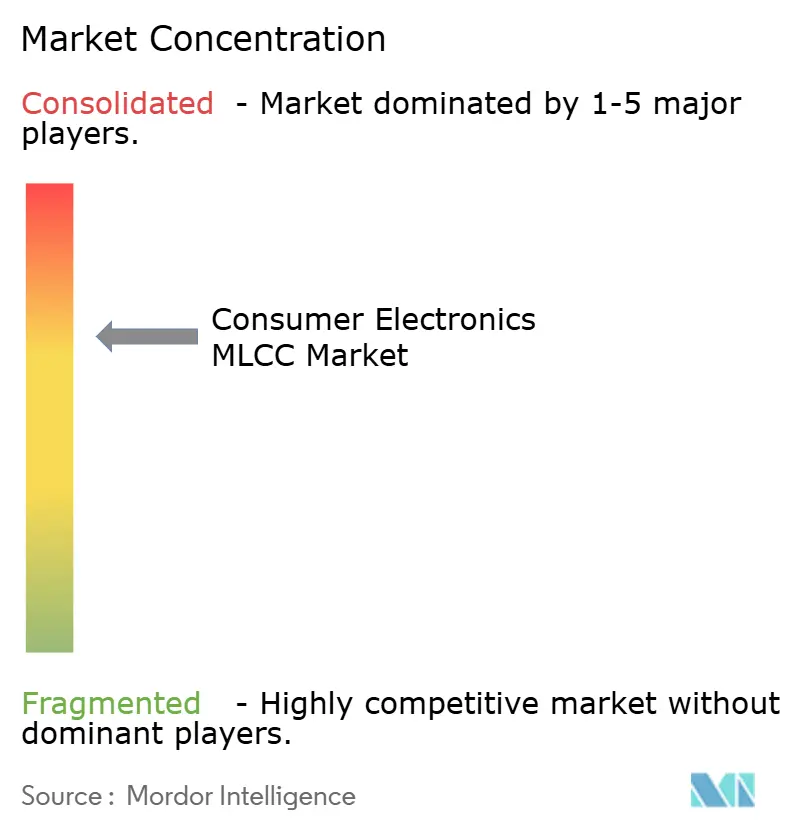
| Market Concentration | Medium |
Major Players*Disclaimer: Major Players sorted in no particular order Image © Mordor Intelligence. Reuse requires attribution under CC BY 4.0. | |
Consumer Electronics MLCC Market Analysis by Mordor Intelligence
The consumer electronics MLCC market size in 2026 is estimated at USD 16.32 billion, growing from 2025 value of USD 14.05 billion with 2031 projections showing USD 34.49 billion, growing at 16.15% CAGR over 2026-2031. Surging demand for edge-AI smartphones, 5G handsets, and ultra-compact wearables is lifting multilayer ceramic capacitor (MLCC) content per device, while premium radio-frequency (RF) architectures push suppliers toward ultra-low equivalent series inductance (ESL) designs. Component miniaturization is accelerating as OEMs transition from 0402 to 0201 footprints, and the ongoing migration to mid-range capacitance values is displacing legacy electrolytic capacitors in space-constrained boards. Tight ESG rules around barium-titanate sourcing and DC-bias derating remain structural headwinds even as consolidation among tier-one vendors reinforces an oligopolistic supply landscape.[1]Murata Manufacturing Co., “FY2024 Q4 Financial Results,” Murata.com
Key Report Takeaways
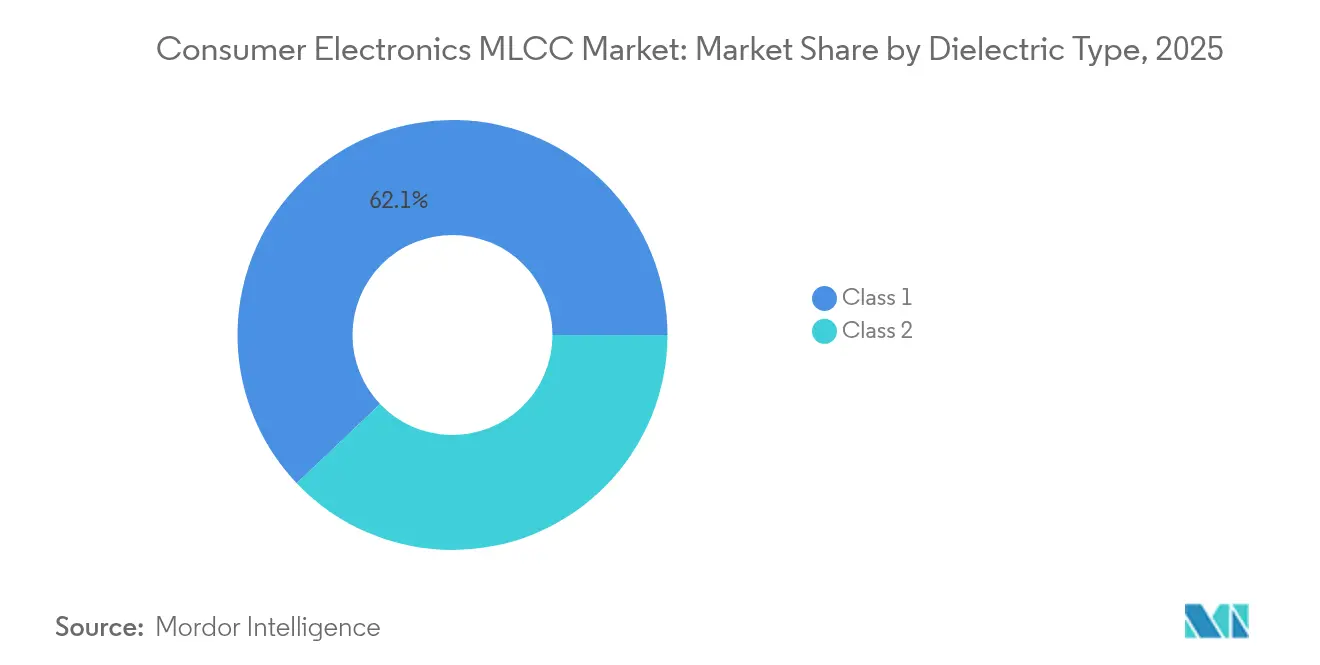
- By dielectric type, Class 1 devices accounted for 62.10% of the consumer electronics MLCC market share in 2025, whereas the same category is forecast to register the highest 17.12% CAGR to 2031.
- By case size, the 0201 footprint held 55.68% revenue share in 2025 in the consumer electronics MLCC market; 0402 devices are projected to expand at a 16.83% CAGR through 2031.
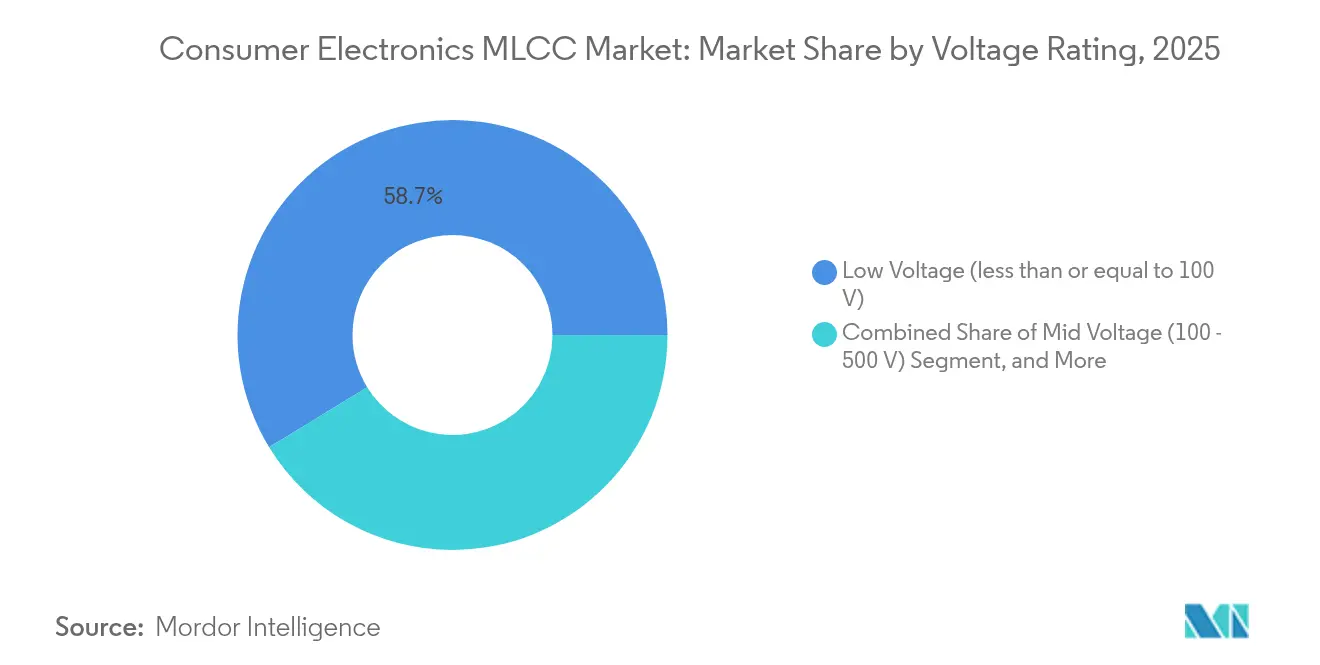
- By voltage rating, parts with a rating of less than or equal to 100 V captured a 58.74% share of the consumer electronics MLCC market size in 2025 and are poised for the fastest growth, with a 16.91% CAGR to 2031.
- By mounting style, surface-mount parts led with a 41.15% share in 2025 in the consumer electronics MLCC market, while metal-cap variants are expected to advance at a 16.58% CAGR to 2031.
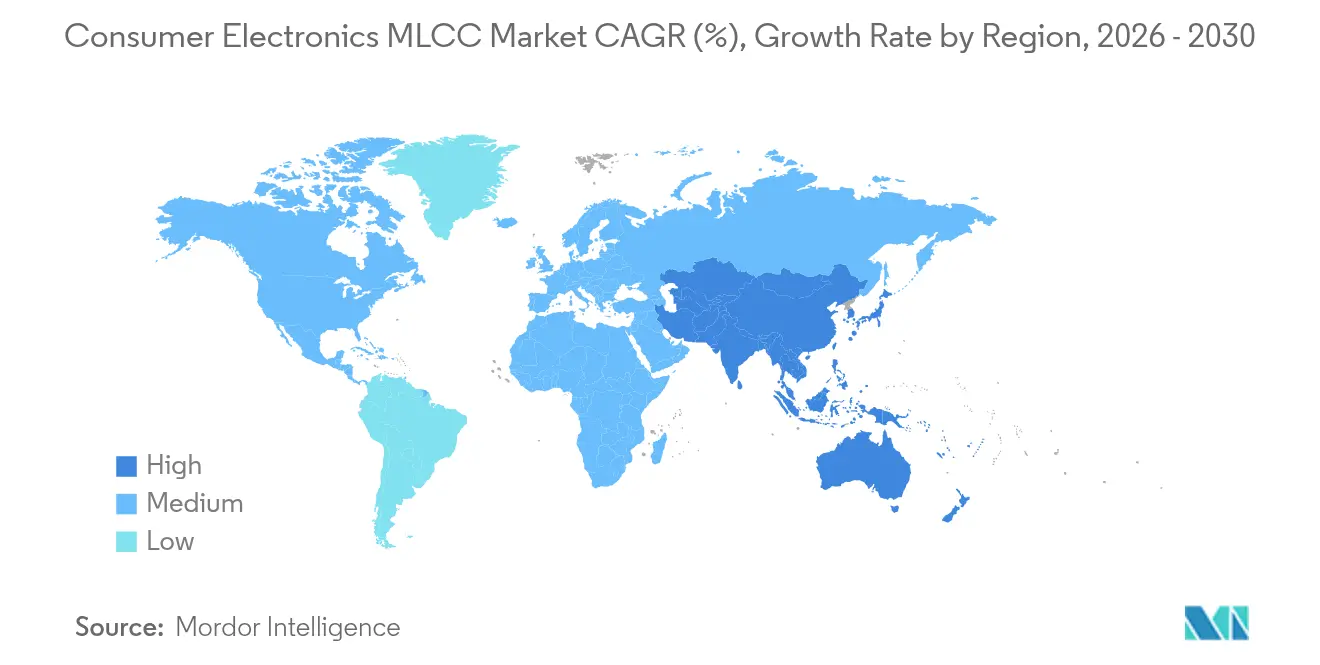
- By region, North America dominated with 56.95% share in 2025 in the consumer electronics MLCC market; Asia-Pacific is projected to clock the fastest 17.05% CAGR to 2031.
Note: Market size and forecast figures in this report are generated using Mordor Intelligence’s proprietary estimation framework, updated with the latest available data and insights as of 2026.
Global Consumer Electronics MLCC Market Trends and Insights
Drivers Impact Analysis*
| Driver | (~) % Impact on CAGR Forecast | Geographic Relevance | Impact Timeline |
|---|---|---|---|
| Mainstream mini-electronics boom in smartphones and wearables | +3.2% | Global, with concentration in Asia-Pacific manufacturing | Medium term (2-4 years) |
| 5G and Wi-Fi 7 radio architectures demanding ultra-low-ESL decoupling | +2.8% | North America and EU early adoption, Asia-Pacific volume production | Short term (≤ 2 years) |
| Shift to AI-centric edge-devices doubling MLCC content per board | +4.1% | Global, led by North America and China | Medium term (2-4 years) |
| Supply-chain consolidation toward high-cap X7R/X5R product lines | +2.3% | Asia-Pacific core, spill-over to global supply chains | Long term (≥ 4 years) |
| In-package land-side MLCC design wins for SiP modules | +1.9% | Global, with early gains in advanced packaging hubs | Long term (≥ 4 years) |
| Large language model handset inference driving >2× DDR-rail capacitance | +3.7% | Global, premium device segments first | Medium term (2-4 years) |
| Source: Mordor Intelligence | |||


Mainstream Mini-Electronics Boom in Smartphones and Wearables
Shrinking device profiles are escalating MLCC counts as brands chase thinner form factors without sacrificing functionality. Samsung’s AEC-Q200-qualified 1005 MLCC delivering 2.2 µF at 10 V exemplifies how automotive-grade reliability now flows into consumer designs.[2]Samsung Electro-Mechanics, “Product Catalogue 2025,” Samsungsem.com Kyocera’s 0201 device rated 10 µF unlocks a 40% volumetric-efficiency gain, letting smartwatch makers pack more sensors on limited board real estate. Component suppliers have validated 0603 parts at 100 µF, a leap that removes bulky tantalum capacitors from flagship phones. Through-2025, each premium smartphone is expected to integrate 1,500-2,000 MLCCs, with wearables rising to 300-400 units per device, cementing the consumer electronics MLCC market as a volume engine.
5G and Wi-Fi 7 Radio Architectures Demanding Ultra-Low-ESL Decoupling
Millimeter-wave 5G handsets rely on decoupling capacitors offering sub-100 pH ESL to stabilize multi-gigahertz power-amplifier switching. Wi-Fi 7 access points require 3-4× more high-frequency MLCCs than Wi-Fi 6 models, driving a price-premium segment that is now migrating into mainstream phones. Low-inductance 0402 MLCCs price 40–60% above standard equivalents, expanding supplier margins while accelerating R&D into stacked-electrode geometries that cut parasitics by half.
Shift to AI-Centric Edge Devices Doubling MLCC Content per Board
On-device large-language-model inference spikes instantaneous current demands, forcing dense MLCC arrays on LPDDR power rails. Samsung’s latest LPDDR5X memory module needs up to 20 decouplers per channel, versus 8-12 in non-AI variants. Neural-processing units toggling between 800 MHz and 2.5 GHz introduce harmonic noise across a broad spectrum, increasing reliance on broadband MLCC networks. The consumer electronics MLCC market thus scales in tandem with every AI-enabled handset and laptop launched in 2025.
Supply-Chain Consolidation Toward High-Cap X7R/X5R Product Lines
Tier-two vendors are exiting commodity low-capacitance lines to funnel capacity toward 0603 X7R parts spanning 47 µF – 100 µF. Yageo’s series of inorganic acquisitions underscores a pivot to application-specific, automotive-qualified MLCCs that deliver higher gross margins. Fewer than eight truly global MLCC suppliers now serve most consumer electronics OEMs, reshaping negotiation dynamics and raising the strategic value of secured allocation agreements.
Restraints Impact Analysis*
| Restraint | (~) % Impact on CAGR Forecast | Geographic Relevance | Impact Timeline |
|---|---|---|---|
| Persistent price volatility and lead-time extension | -2.1% | Global, with acute impact in spot markets | Short term (≤ 2 years) |
| DC-bias-induced derating eroding effective capacitance | -1.8% | Global, affecting high-voltage applications | Medium term (2-4 years) |
| Acoustic-noise compliance for thin OLED smartphones | -1.3% | Global, concentrated in premium device segments | Medium term (2-4 years) |
| ESG-linked barium-titanate sourcing restrictions | -2.4% | Global, with supply concentration in China | Long term (≥ 4 years) |
| Source: Mordor Intelligence | |||
Persistent Price Volatility and Lead-Time Extension
MLCC spot prices can swing 200-400% during supply squeezes, complicating production planning for mid-tier OEMs. Samsung Electro-Mechanics noted diverging trends in Q4 2024 as automotive MLCC shipments grew while handset demand softened, highlighting allocation stress. Lead times for niche parts often stretch past 26 weeks, nudging consumer brands to carry nine-month safety stocks and locking up working capital.
DC-Bias-Induced Derating Eroding Effective Capacitance
Class 2 X7R capacitors lose up to 70% of nominal value at 80% rated voltage; designers routinely oversize networks 3-4× to compensate. Elevated processor junction temperatures compound this derating, forcing larger BOM budgets and squeezing board area, especially in foldable phones.
*Our forecasts treat driver/restraint impacts as directional, not additive. The impact forecasts reflect baseline growth, mix effects, and variable interactions.
Segment Analysis
By Dielectric Type: Class 1 Supplies Precision RF Needs
Class 1 components captured 62.10% consumer electronics MLCC market share in 2025 on the strength of low-loss, temperature-stable C0G/NP0 dielectrics essential for 5 G RF synthesizers. The category will advance at a 17.12% CAGR as smartphones integrate more phased-array antennas. Class 2 X7R parts remain dominant in bulk decoupling but cede value share to higher-margin Class 1 offerings. OEM preference for automotive-grade C0G variants that meet AEC-Q200 is supporting premium pricing power across the consumer electronics MLCC market.
Supply reliability is improving as leading vendors pour cap-ex into Class 1 production lines with automated firing furnaces and AI process control. Still, raw-material purity and thin-electrode uniformity limit yield, keeping barriers high for late-entry rivals.


By Case Size: 0402 Becomes Mainstream Sweet Spot
While 0201 footprints held a commanding 55.68% of shipments in 2025, many OEMs are standardizing on 0402 for better assembly yields in high-volume factories. The 0402 segment is projected to outpace all other sizes at 16.83% CAGR, reflecting a trade-off between space saving and placement accuracy. The consumer electronics MLCC market size for 0402 parts will widen rapidly as automated lines achieve sub-25 µm placement tolerance. Larger 0603 to 1210 sizes remain prevalent in battery-side filtering where higher voltage ratings are mandatory.
By Voltage Rating: less than or equal to 100 V Parts Dominate Handset BOMs
Low-voltage MLCCs accounted for 58.74% share in 2025 and will deliver the fastest 16.91% CAGR through 2031 as nearly all mobile subsystems operate below 12 V. The consumer electronics MLCC market size tied to USB-C rapid-charge controllers alone is expanding as new 20 V / 5 A profiles require capacitance with low ESL and high ripple current capacity. Mid-voltage (100–500 V) parts serve GaN fast-charger modules, while above 500 V capacitors stay niche in OLED driver boards.
By Mounting Style: Metal-Cap Variants Post Quickest Gains
Surface-mount technology (SMT) delivered 41.15% revenue share in 2025, but metal-cap terminations will log a 16.58% CAGR as drop-test thresholds climb in premium phones. Metal-cap MLCCs cut board-level cracking by 80% in vibration tests, enticing handset makers who must pass stringent reliability audits. Radial-lead offerings retain a foothold in audiophile gear where through-hole soldering minimizes microphonics.
Geography Analysis
North America controlled 56.95% of 2025 revenue as flagship-phone penetration exceeded 85% and hyperscale data-center builds incorporated AI accelerator cards that quadruple MLCC counts per board. Close collaboration between Silicon-Valley chip designers and tier-one capacitor suppliers accelerates early adoption of sub-100 pH ESL parts, keeping the consumer electronics MLCC market firmly rooted in premium segments.
The Asia-Pacific region is projected to register a 17.05% CAGR from 2026 to 2031, reinforcing its role as both the largest manufacturing base and the fastest-growing demand center. Massive investments by Japanese and South Korean firms in Malaysia, the Philippines, and Vietnam are expanding the regional output of high-capacitance X7R/X5R lines, while Chinese OEMs continue to scale mid-range smartphones, ensuring volume stability. Government incentives for advanced packaging plants in Taiwan are also fueling in-package MLCC innovation.
Europe and the rest of the world trail on absolute volume but post steady gains from automotive electrification and industrial-automation overlap with high-end consumer electronics. German OEMs are increasingly specifying AEC-Q200 MLCCs in premium true-wireless earphones to differentiate themselves on reliability, while Middle East smartphone assembly hubs provide tax-advantaged final-unit shipments to Africa and Eastern Europe. Supply-chain diversification amid geopolitical friction gives regional second-sourcing programs extra momentum.

Competitive Landscape
The consumer electronics MLCC market is concentrated: Murata holds roughly 34% global share, Samsung Electro-Mechanics 24%, and TDK near 12%, forming an oligopoly that influences pricing cycles and allocation rules. Scale economies, proprietary dielectric chemistries, and closed-loop raw-material chains create formidable barriers for late entrants.
Strategic investments center on fully automated clean-room lines, AI-driven visual-inspection systems, and next-generation sintering furnaces capable of firing sub-1 µm dielectric layers. Murata’s JPY 46 billion Moriyama Innovation Center, due online in 2026, underscores a capacity race keyed to ultra-miniature high-capacitance parts. Samsung Electro-Mechanics is channeling KRW 500 billion into 0201 capacity, targeting foldable phones and edge AI laptops. TDK’s latest expansion in China doubles automotive-grade MLCC output, illustrating cross-sector leverage between infotainment modules and top-tier consumer devices.
Smaller specialists such as Walsin and Kyocera carve niches in ultra-low-ESL or land-side embedded MLCCs. Vertical integration moves by Yageo, including acquisition activity in 2024, hint at a medium-term shift toward a six-to-seven-player market. Consequently, OEM risk-mitigation strategies revolve around dual-sourcing critical footprints and signing multi-year capacity-reservation contracts.
Consumer Electronics MLCC Industry Leaders
Kyocera AVX Components Corporation (Kyocera Corporation)
Taiyo Yuden Co., Ltd
Yageo Corporation
Murata Manufacturing Co., Ltd.
Samsung Electro-Mechanics Co., Ltd.
- *Disclaimer: Major Players sorted in no particular order

Recent Industry Developments
- February 2025: Samsung Electro-Mechanics unveiled the first AEC-Q200 MLCC for LiDAR, delivering 2.2 µF in 1005 size at 10 V.
- January 2025: Murata completed its JPY 46 billion Moriyama Innovation Center aimed at automated MLCC manufacturing.
- December 2024: TDK invested USD 150 million to expand Chinese MLCC capacity for automotive overlap with premium consumer devices.
- October 2024: Yageo finalized the acquisition of Shibaura Electronics, cementing vertical integration in high-cap MLCCs.


Global Consumer Electronics MLCC Market Report Scope
Air Conditioner, Desktop PCs, Gaming Console, HDDs and SSDs, Laptops, Printers, Refrigerator, Smartphones, Smartwatches, Tablets, Television, Others are covered as segments by Device Type. 0 201, 0 402, 0 603, 1 005, 1 210, Others are covered as segments by Case Size. 10V to 30V, Above 30V, Less than 10V are covered as segments by Voltage. 10 μF to 100 μF, Less than 10 μF, More than 100 μF are covered as segments by Capacitance. Class 1, Class 2 are covered as segments by Dielectric Type. Asia-Pacific, Europe, North America are covered as segments by Region.| Class 1 |
| Class 2 |
| 201 |
| 402 |
| 603 |
| 1005 |
| 1210 |
| Other Case Sizes |
| Low Voltage (less than or equal to 100 V) |
| Mid Voltage (100 – 500 V) |
| High Voltage (above 500 V) |
| Metal Cap |
| Radial Lead |
| Surface Mount |
| North America | United States |
| Rest of North America | |
| Europe | Germany |
| United Kingdom | |
| Rest of Europe | |
| Asia-Pacific | China |
| India | |
| Japan | |
| South Korea | |
| Rest of Asia-Pacific | |
| Rest of the World |
| By Dielectric Type | Class 1 | |
| Class 2 | ||
| By Case Size | 201 | |
| 402 | ||
| 603 | ||
| 1005 | ||
| 1210 | ||
| Other Case Sizes | ||
| By Voltage | Low Voltage (less than or equal to 100 V) | |
| Mid Voltage (100 – 500 V) | ||
| High Voltage (above 500 V) | ||
| By MLCC Mounting Type | Metal Cap | |
| Radial Lead | ||
| Surface Mount | ||
| By Geography | North America | United States |
| Rest of North America | ||
| Europe | Germany | |
| United Kingdom | ||
| Rest of Europe | ||
| Asia-Pacific | China | |
| India | ||
| Japan | ||
| South Korea | ||
| Rest of Asia-Pacific | ||
| Rest of the World | ||


Market Definition
- MLCC (Multilayer Ceramic Capacitor) - A type of capacitor that consists of multiple layers of ceramic material, alternating with conductive layers, used for energy storage and filtering in electronic circuits.
- Voltage - The maximum voltage that a capacitor can safely withstand without experiencing breakdown or failure. It is typically expressed in volts (V)
- Capacitance - The measure of a capacitor's ability to store electrical charge, expressed in farads (F). It determines the amount of energy that can be stored in the capacitor
- Case Size - The physical dimensions of an MLCC, typically expressed in codes or millimeters, indicating its length, width, and height
| Keyword | Definition |
|---|---|
| MLCC (Multilayer Ceramic Capacitor) | A type of capacitor that consists of multiple layers of ceramic material, alternating with conductive layers, used for energy storage and filtering in electronic circuits. |
| Capacitance | The measure of a capacitor's ability to store electrical charge, expressed in farads (F). It determines the amount of energy that can be stored in the capacitor |
| Voltage Rating | The maximum voltage that a capacitor can safely withstand without experiencing breakdown or failure. It is typically expressed in volts (V) |
| ESR (Equivalent Series Resistance) | The total resistance of a capacitor, including its internal resistance and parasitic resistances. It affects the capacitor's ability to filter high-frequency noise and maintain stability in a circuit. |
| Dielectric Material | The insulating material used between the conductive layers of a capacitor. In MLCCs, commonly used dielectric materials include ceramic materials like barium titanate and ferroelectric materials |
| SMT (Surface Mount Technology) | A method of electronic component assembly that involves mounting components directly onto the surface of a printed circuit board (PCB) instead of through-hole mounting. |
| Solderability | The ability of a component, such as an MLCC, to form a reliable and durable solder joint when subjected to soldering processes. Good solderability is crucial for proper assembly and functionality of MLCCs on PCBs. |
| RoHS (Restriction of Hazardous Substances) | A directive that restricts the use of certain hazardous materials, such as lead, mercury, and cadmium, in electrical and electronic equipment. Compliance with RoHS is essential for automotive MLCCs due to environmental regulations |
| Case Size | The physical dimensions of an MLCC, typically expressed in codes or millimeters, indicating its length, width, and height |
| Flex Cracking | A phenomenon where MLCCs can develop cracks or fractures due to mechanical stress caused by bending or flexing of the PCB. Flex cracking can lead to electrical failures and should be avoided during PCB assembly and handling. |
| Aging | MLCCs can experience changes in their electrical properties over time due to factors like temperature, humidity, and applied voltage. Aging refers to the gradual alteration of MLCC characteristics, which can impact the performance of electronic circuits. |
| ASPs (Average Selling Prices) | The average price at which MLCCs are sold in the market, expressed in USD million. It reflects the average price per unit |
| Voltage | The electrical potential difference across an MLCC, often categorized into low-range voltage, mid-range voltage, and high-range voltage, indicating different voltage levels |
| MLCC RoHS Compliance | Compliance with the Restriction of Hazardous Substances (RoHS) directive, which restricts the use of certain hazardous substances, such as lead, mercury, cadmium, and others, in the manufacturing of MLCCs, promoting environmental protection and safety |
| Mounting Type | The method used to attach MLCCs to a circuit board, such as surface mount, metal cap, and radial lead, which indicates the different mounting configurations |
| Dielectric Type | The type of dielectric material used in MLCCs, often categorized into Class 1 and Class 2, representing different dielectric characteristics and performance |
| Low-Range Voltage | MLCCs designed for applications that require lower voltage levels, typically in the low voltage range |
| Mid-Range Voltage | MLCCs designed for applications that require moderate voltage levels, typically in the middle range of voltage requirements |
| High-Range Voltage | MLCCs designed for applications that require higher voltage levels, typically in the high voltage range |
| Low-Range Capacitance | MLCCs with lower capacitance values, suitable for applications that require smaller energy storage |
| Mid-Range Capacitance | MLCCs with moderate capacitance values, suitable for applications that require intermediate energy storage |
| High-Range Capacitance | MLCCs with higher capacitance values, suitable for applications that require larger energy storage |
| Surface Mount | MLCCs designed for direct surface mounting onto a printed circuit board (PCB), allowing for efficient space utilization and automated assembly |
| Class 1 Dielectric | MLCCs with Class 1 dielectric material, characterized by a high level of stability, low dissipation factor, and low capacitance change over temperature. They are suitable for applications requiring precise capacitance values and stability |
| Class 2 Dielectric | MLCCs with Class 2 dielectric material, characterized by a high capacitance value, high volumetric efficiency, and moderate stability. They are suitable for applications that require higher capacitance values and are less sensitive to capacitance changes over temperature |
| RF (Radio Frequency) | It refers to the range of electromagnetic frequencies used in wireless communication and other applications, typically from 3 kHz to 300 GHz, enabling the transmission and reception of radio signals for various wireless devices and systems. |
| Metal Cap | A protective metal cover used in certain MLCCs (Multilayer Ceramic Capacitors) to enhance durability and shield against external factors like moisture and mechanical stress |
| Radial Lead | A terminal configuration in specific MLCCs where electrical leads extend radially from the ceramic body, facilitating easy insertion and soldering in through-hole mounting applications. |
| Temperature Stability | The ability of MLCCs to maintain their capacitance values and performance characteristics across a range of temperatures, ensuring reliable operation in varying environmental conditions. |
| Low ESR (Equivalent Series Resistance) | MLCCs with low ESR values have minimal resistance to the flow of AC signals, allowing for efficient energy transfer and reduced power losses in high-frequency applications. |


Research Methodology
Mordor Intelligence has followed the following methodology in all our MLCC reports.
- Step 1: Identify Data Points: In this step, we identified key data points crucial for comprehending the MLCC market. This included historical and current production figures, as well as critical device metrics such as attachment rate, sales, production volume, and average selling price. Additionally, we estimated future production volumes and attachment rates for MLCCs in each device category. Lead times were also determined, aiding in forecasting market dynamics by understanding the time required for production and delivery, thereby enhancing the accuracy of our projections.
- Step 2: Identify Key Variables: In this step, we focused on identifying crucial variables essential for constructing a robust forecasting model for the MLCC market. These variables include lead times, trends in raw material prices used in MLCC manufacturing, automotive sales data, consumer electronics sales figures, and electric vehicle (EV) sales statistics. Through an iterative process, we determined the necessary variables for accurate market forecasting and proceeded to develop the forecasting model based on these identified variables.
- Step 3: Build a Market Model: In this step, we utilized production data and key industry trend variables, such as average pricing, attachment rate, and forecasted production data, to construct a comprehensive market estimation model. By integrating these critical variables, we developed a robust framework for accurately forecasting market trends and dynamics, thereby facilitating informed decision-making within the MLCC market landscape.
- Step 4: Validate and Finalize: In this crucial step, all market numbers and variables derived through an internal mathematical model were validated through an extensive network of primary research experts from all the markets studied. The respondents are selected across levels and functions to generate a holistic picture of the market studied.
- Step 5: Research Outputs: Syndicated Reports, Custom Consulting Assignments, Databases, and Subscription Platform


