Market Overview
| Study Period | 2019 - 2031 |
|---|---|
| Forecast Data Period | 2026 - 2031 |
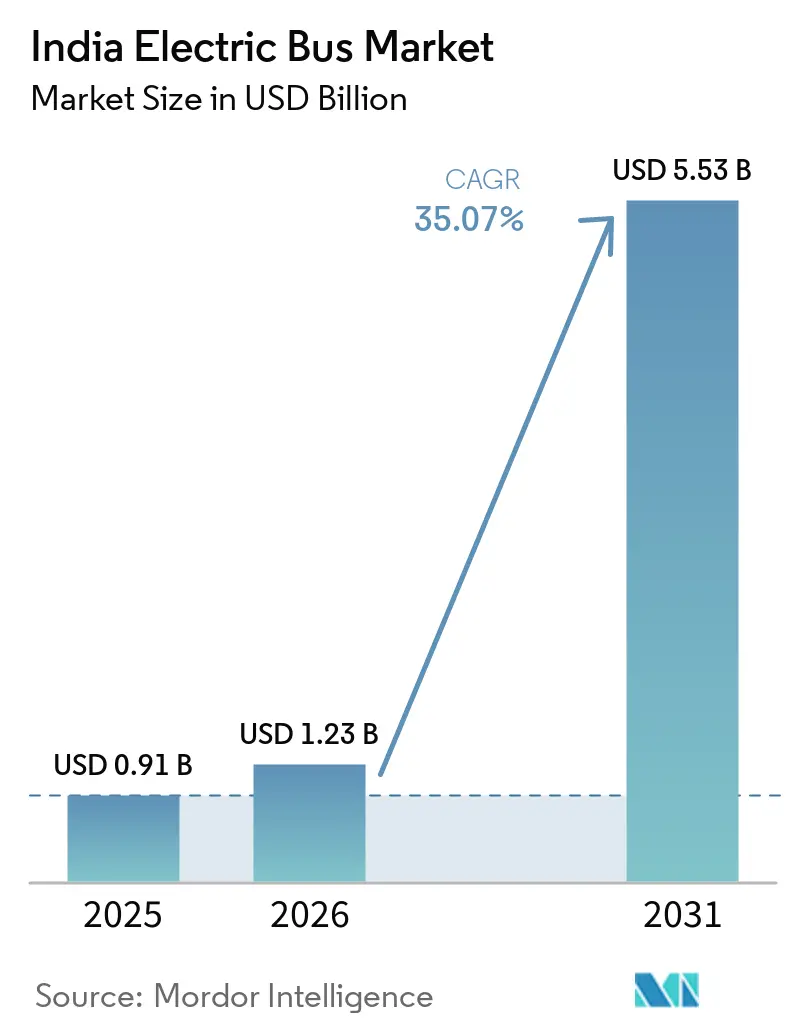
| Base Year Market Size (2025) | USD 0.91 Billion |
| Market Size (2026) | USD 1.23 Billion |
| Market Size (2031) | USD 5.53 Billion |
| Growth Rate (2026 - 2031) | 35.07% CAGR |
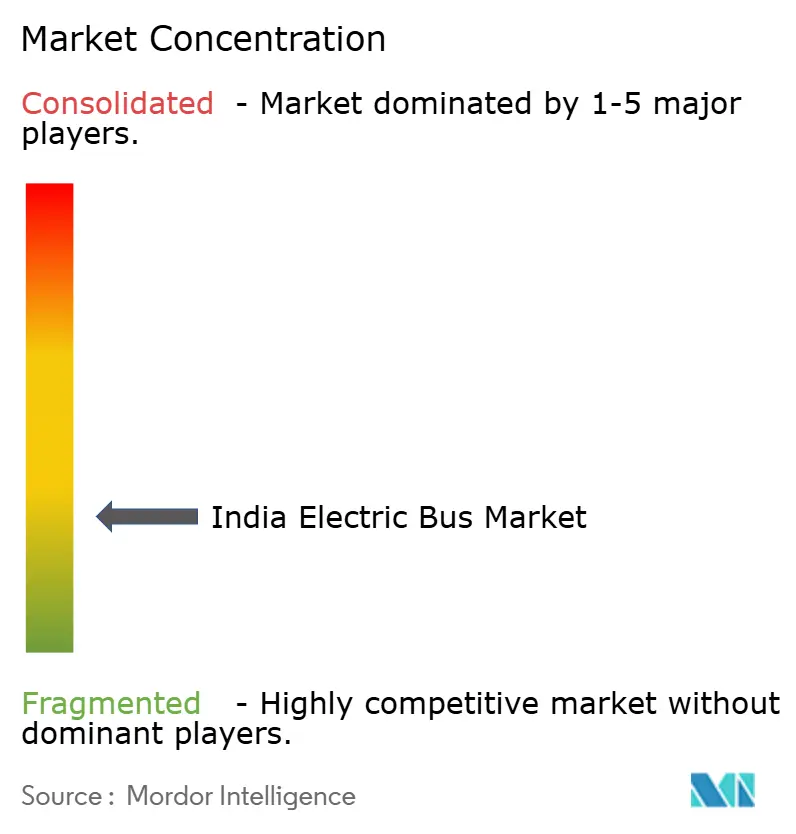
| Market Concentration | Low |
Major Players*Disclaimer: Major Players sorted in no particular order Image © Mordor Intelligence. Reuse requires attribution under CC BY 4.0. | |
India Electric Bus Market Analysis by Mordor Intelligence
The Indian electric bus market size is valued at USD 0.91 billion in 2025 and estimated to grow from USD 1.23 billion in 2026 to reach USD 5.53 billion by 2031, at a CAGR of 4.17% during the forecast period (2026-2031). Demand rises as the Payment Security Mechanism created under PM E-DRIVE unlocks deferred state transport payments, gross-cost contracts flatten bid prices, and sub-USD 100 per kWh lithium iron phosphate (LFP) batteries narrow total-cost-of-ownership gaps with diesel fleets. Fleet operators are also accelerating procurement to comply with a draft rule requiring zero-emission city bus fleets, while pilots using green hydrogen address range needs on corridors exceeding 400 km. Further upside stems from Make-in-India battery lines, including sodium-ion and nickel-manganese-cobalt (NMC), which localize supply, reduce import duties, and shorten lead times. Yet infrastructure gaps outside tier-1 cities, interstate toll asymmetry, and a shallow domestic silicon-carbide (SiC) component base temper the growth trajectory.
Key Report Takeaways
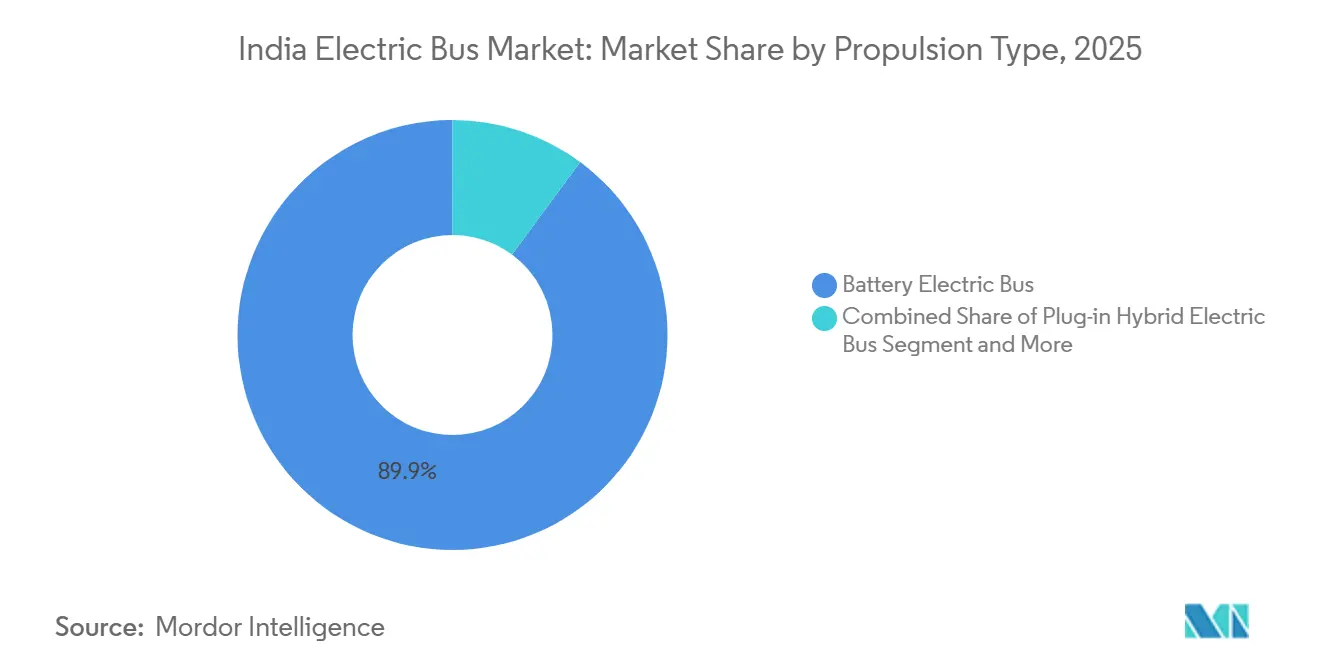
- By propulsion, battery electric buses led the Indian electric bus market with 89.87% of the market share in 2025; fuel cell electric buses are poised to expand at a 36.58% CAGR through 2031.
- By application, city and transit services commanded a 65.32% share of the Indian electric bus market size in 2025, while intercity and regional routes are expected to accelerate at a 37.31% CAGR through 2031.
- By battery chemistry, LFP captured 68.37% share in 2025, whereas NMC is forecast to record a 36.42% CAGR during 2026-2031.
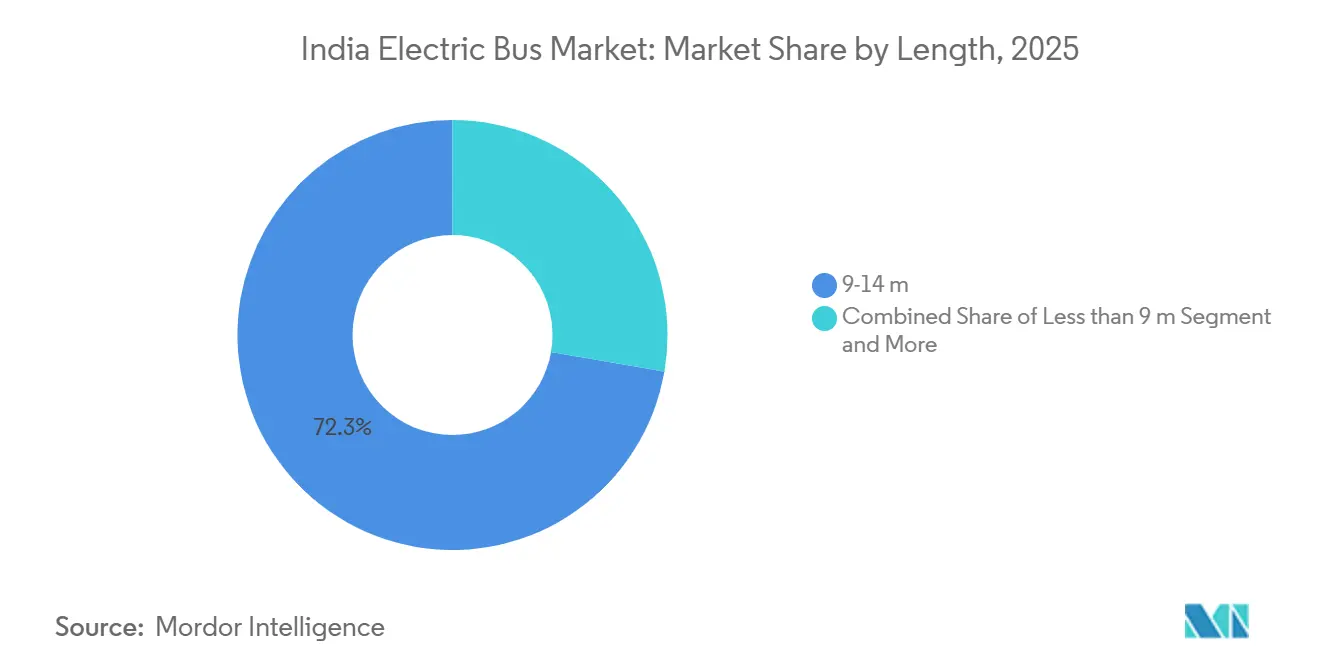
- By length, 9-14 m buses represented 72.29% of the Indian electric bus market in 2025; 14-18 m articulated models are projected to grow at a 37.87% CAGR.
- By motor architecture, permanent-magnet synchronous motors accounted for a 68.35% share in 2025; switched reluctance motors are expected to rise at a 37.18% CAGR due to rare-earth savings.
- By motor power, the 151-200 kW band held a 55.62% share in 2025, while 251-320 kW systems are expected to scale at a 35.92% CAGR for hill-route deployment.
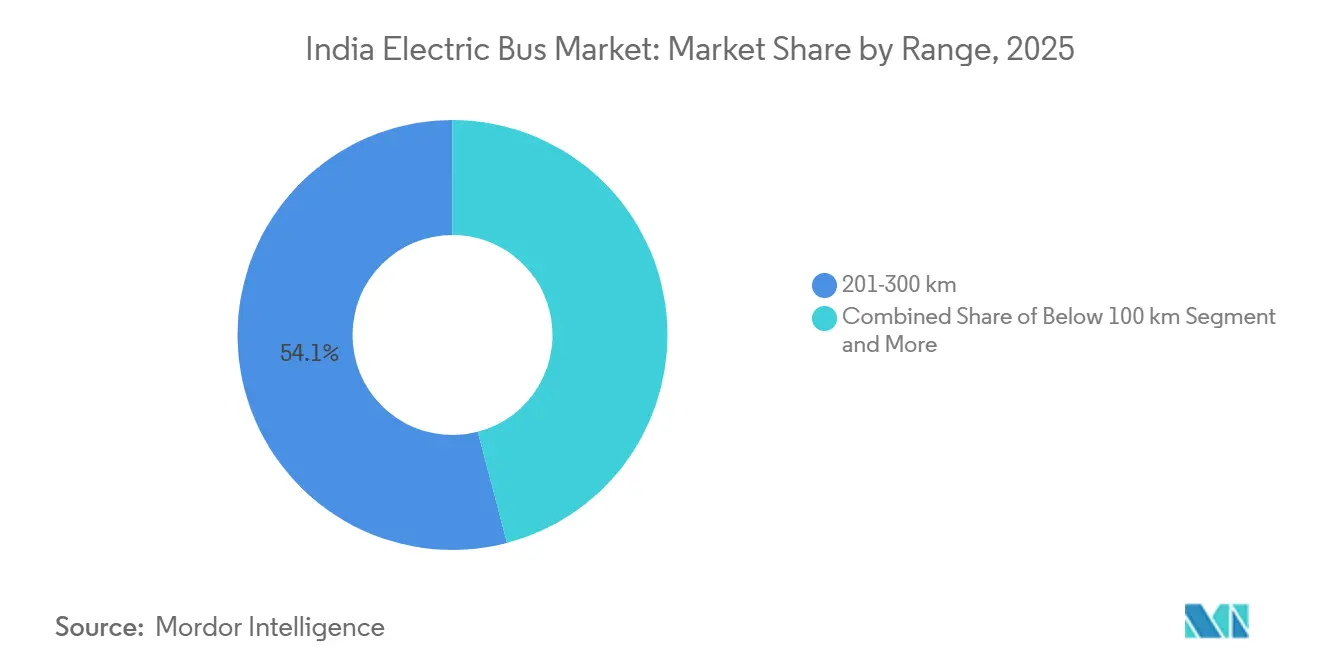
- By range, buses with a 201-300 km range made up 54.07% of the Indian electric bus market size in 2025; models with a range above 450 km are expected to grow at a 35.53% CAGR.
- By end use, public operators captured an 84.97% share in 2025; private fleets are forecast to grow at a 36.38% CAGR under operational leasing schemes.
- By region, South India held 48.76% of the Indian electric bus market share in 2025; North India is projected to expand at a 36.08% CAGR through 2031.
Note: Market size and forecast figures in this report are generated using Mordor Intelligence’s proprietary estimation framework, updated with the latest available data and insights as of 2026.
India Electric Bus Market Trends and Insights
Drivers Impact Analysis*
| Driver | (~) % Impact on CAGR Forecast | Geographic Relevance | Impact Timeline |
|---|---|---|---|
| LFP Battery Prices below USD 100/kWh | +7.1% | National, hubs in Gujarat, Tamil Nadu | Short term (≤ 2 years) |
| Zero-Emission City Bus Mandate by 2027 | +6.5% | Tier-1 and tier-2 cities nationwide | Medium term (2-4 years) |
| Accelerated FAME II and PM-eBus Disbursements | +6.2% | National, early gains in Karnataka, Tamil Nadu, Delhi | Short term (≤ 2 years) |
| State-Level Gross-Cost Contracts Rising | +5.8% | South (Karnataka, Telangana), West (Maharashtra), expanding North | Medium term (2-4 years) |
| Green-Hydrogen Blending Pilots for Long-Haul | +4.3% | North (Delhi-Chandigarh), West (Mumbai-Pune) | Long term (≥ 4 years) |
| Make-in-India Sodium-Ion Packs from 2026 | +3.9% | National, pilots in Gujarat, Karnataka | Long term (≥ 4 years) |
| Source: Mordor Intelligence | |||


Falling LFP Battery Prices below USD 100/kWh Threshold
Oversupply in major Asian markets, coupled with favorable currency movements, has driven down domestic battery pack prices. This trend is closing the lifetime cost gap between electric and diesel vehicles, especially on high-utilization routes. With new local manufacturing capacities emerging and bolstered by government incentive programs, prices are poised to drop further. This shift is accelerating fleet conversion decisions across several Indian states, supporting India electric bus market growth. Internal fleet committees, which had previously established cost thresholds for transitioning to electric, are now responding to these price trends with quicker replacement timelines. Yet, the recent volatility in raw material prices highlights persistent supply-chain risks, emphasizing the need for long-term procurement agreements.
Faster FAME II and PM-eBus Scheme Disbursements
Manufacturers have regained confidence, thanks to an escrow-based payment security mechanism. This system not only ensures timely payments but also clears long-standing dues, effectively restarting previously stalled procurement cycles [1]“Government launches payment security mechanism for e-bus program,”, Press Information Bureau, pib.gov.in. While national programs, such as PM-eBus Sewa, have greenlit extensive deployments in various cities, the pace of execution is crucial, mainly as disbursal rates trail behind initial commitments [2]“PM-eBus Sewa disbursement status,”, Ministry of Heavy Industries, heavyindustries.gov.in. The incentive structures are designed to favor mid-sized bus models, striking a balance between subsidies and costs. Moreover, the program's extension offers Original Equipment Manufacturers (OEMs) a more apparent planning horizon. Yet, the lack of a definitive roadmap beyond the current timeline raises eyebrows, suggesting a possible decline in future orders. In summary, steady subsidy flows are bolstering procurement confidence, laying a solid foundation for the burgeoning electric bus market in India.
State-level Gross-Cost Contracts Gaining Traction
Transport authorities are now bearing the brunt of demand risk, due to the rise of gross-cost contracting models. This shift allows operators to bid at rates significantly lower than those seen in traditional net-cost tenders. Several states have already set new benchmarks with this approach, leading other regions to follow suit. The gross-cost structure eliminates the necessity for operators to own depots, paving the way for pure-play fleet operators. This not only heightens competition but also speeds up fleet renewal, further driving India electric bus market growth. Authorities are customizing contracts based on route economics, as evident in hybrid strategies that merge gross costs for urban routes and net costs for intercity services. Furthermore, major tenders now feature long-term lock-in clauses, ensuring revenue certainty for operators. This bolstered bankability subsequently broadens their access to financing.
Green-Hydrogen Blending Pilots for Long-Haul Routes
Fuel-cell buses have proven their mettle for intercity routes, thanks to a recent pilot program that tackled range limitations. By tapping into the existing refueling infrastructure, the program slashed capital costs, sidestepping the need for new stations. Major OEMs are rolling out new prototypes, underscoring a heightened readiness to embrace hydrogen solutions. Yet, achieving cost parity with battery-electric counterparts poses a significant challenge. Furthermore, only a handful of states are hitting the renewable energy and electrolyzer utilization targets essential for competitive hydrogen production, limiting immediate growth prospects.
Restraint Impact Analysis*
| Restraint | (~) % Impact on CAGR Forecast | Geographic Relevance | Impact Timeline |
|---|---|---|---|
| Slow Depot Electrification Outside Tier-1 Cities | −3.5% | Tier-2 and tier-3 cities nationwide | Medium term (2-4 years) |
| Highway Charger Gap: 150–350 kW Scarcity | −2.9% | National highways, North-South corridors | Medium term (2-4 years) |
| Inter-state Toll-/Tax-waiver Asymmetry | −2.8% | Maharashtra-Gujarat, Karnataka-Tamil Nadu borders | Short term (≤ 2 years) |
| Weak Tier-2 Supply Chain for SiC Inverters | −2.1% | East and North-East India shortages | Long term (≥ 4 years) |
| Source: Mordor Intelligence | |||
Slow Depot Electrification Outside Tier-1 Cities
In cities like Rajkot and other similar urban areas, fleet utilization is hampered by a lack of fast-charging infrastructure at many tier-2 depots, especially when compared to major metropolitan hubs. In several states, project timelines are delayed and operational uncertainty is heightened due to grid connection approvals taking significantly longer than in regions with more advanced digital infrastructure. Capital costs for each charger consume a substantial portion of typical project budgets, putting financial pressure on smaller projects and deterring them from making incremental expansions. On another front, while the national energy services agency's depot-as-a-service initiative is making progress, its city-level adoption is hindered by complex revenue-sharing negotiations, resulting in a limited rollout.
Inter-state Toll-/Tax-waiver Asymmetry
Maharashtra's decision to fully exempt tolls stands in stark contrast to Gujarat's standard tolls. This discrepancy raises the total cost of ownership on crucial intercity routes and deters cross-border electric deployments. Karnataka and Tamil Nadu showcase similar disparities, complicating route economics for operators who register buses in one state but operate in another. Without a cohesive framework from the Goods and Services Tax Council, states wield unilateral control over road taxes, furthering fragmentation. In response, major private coach operators have delayed electric trials, awaiting more synchronized policies. As long as these disparities persist, new electric buses will predominantly operate within state lines, curtailing the broader intercity ambitions of India's electric bus market.
*Our forecasts treat driver/restraint impacts as directional, not additive. The impact forecasts reflect baseline growth, mix effects, and variable interactions.
Segment Analysis
By Propulsion: Fuel Cells Challenge Battery Dominance on Long Routes
Battery electric buses owned 89.87% of the Indian electric bus market in 2025 due to mature depot charging networks in metros and strong FAME II economics. Fuel cell electric buses, however, promise a single-tank range of 450 km, ideal for Delhi-Chandigarh or Mumbai-Pune services, and are forecast to register a 36.58% CAGR as hydrogen costs decline. Plug-in hybrids remain negligible, lacking subsidy support and carrying brand-equity penalties among zero-emission-focused public agencies.
Energy density and fast refueling are significant advantages of fuel-cell technology; however, high capital costs and a limited refueling network hinder its widespread adoption. Battery-electric buses currently dominate city fleets where charging infrastructure is well-developed. Nonetheless, range limitations on long intercity routes present an opportunity for hydrogen-based solutions. In the long term, propulsion strategies are expected to diverge, with battery-electric vehicles being preferred for urban operations and fuel cells for longer-distance travel. Both technologies face infrastructure-related challenges, which will play a critical role in shaping the evolution of the Indian electric bus market in the coming years.


By Application: Intercity Routes Drive Range Innovation
City and transit uses dominated with a 65.32% share in 2025, reflecting the urgent air-quality goals and the availability of overnight-charging infrastructure in Delhi, Bangalore, and Mumbai. Intercity and regional services, although smaller today, are expected to grow at a 37.31% annual rate as operators pilot articulated buses measuring 14-18m, offering premium express amenities. Airport shuttles and school buses form niche segments that nonetheless demonstrate business-case clarity due to fixed routes and high asset utilization.
The Indian electric bus market responds to differing duty cycles: city buses run 180-220 km daily with predictable depot returns, while intercity coaches cover ranges of 350-450 km and require 150-350 kW highway chargers. Operator interest is high, yet infrastructure scarcity remains the gating element, particularly along the Golden Quadrilateral. Until ultra-fast chargers proliferate, fleet owners will either add larger battery packs or defer electrification of long-haul routes.
By Battery Chemistry: LFP Dominance Faces NMC Upshift in Premium Segment
LFP maintained a 68.37% share in 2025, primarily due to its fire safety, long cycle life, and the achievement of a sub-USD 100 per kWh milestone in early 2025. NMC underpins 36.42% CAGR as intercity coaches chase 450 km ranges without overshooting weight ratings.
Lithium titanate is being utilized in high-throughput applications such as airport shuttles, while sodium-ion batteries are gaining traction as a cost-effective solution for city networks, particularly as domestic production lines become operational. Battery chemistry selection is increasingly tailored to specific duty cycles: LFP is preferred for urban routes, NMC for longer intercity travel, sodium-ion for colder climates, and lithium titanate for rapid-charge loops. This diversified approach helps address raw material volatility and adapts to changing subsidy structures, maintaining dynamic competition among battery chemistries in the Indian electric bus market.
By Length: Articulated Buses Reshape Urban Corridors
Standard 9-14 m low-floor buses secured 72.29% of 2025 deliveries, driven by optimal subsidy capture under FAME II and maneuverability on mixed-traffic lanes. Articulated 14-18 m models, though pricier, promise higher passenger capacity and will expand at 37.87% CAGR as high-density corridors like Bengaluru’s Outer Ring Road add dedicated lanes. Feeder routes below 9 m remain small but critical for last-mile coverage.
With bi-articulated pilot testing in Mumbai, policymakers will observe the trade-offs between road space and capacity multipliers. If bus rapid transit infrastructure scales, longer platforms could chip away at standard-length dominance, altering how the Indian electric bus market allocates manufacturing capacity.
By Motor Architecture: Rare-Earth Reduction Drives SRM Adoption
Permanent-magnet synchronous motors (PMSMs) held a 68.35% share in 2025 due to their higher efficiency; however, price spikes in neodymium motivate a shift toward switched reluctance motors (SRMs), forecasted to grow at a 37.18% CAGR through 2031.
Switched Reluctance Motors (SRMs) eliminate the need for magnets, reducing dependence on rare-earth materials and providing greater tolerance to high ambient temperatures. Induction motors remain a cost-effective option for price-sensitive fleets, although they offer lower efficiency compared to premium alternatives. Supply chain considerations, such as balancing the security of rare-earth materials with efficiency improvements, are expected to influence future drivetrain architecture decisions. Manufacturers capable of refining SRMs to reduce noise and vibration may achieve lower total costs compared to permanent magnet synchronous motors, potentially setting new benchmarks for electric bus drivetrains in India.
By Motor Power: High-Power Drivetrains Enable Hill Routes
Motors rated 151-200 kW captured 55.62% share in 2025, matching typical intracity weight and gradient profiles. Demand for 251-320 kW units is expected to increase by 35.92% annually as Himachal and Uttarakhand electrify hill routes that require sustained grade climbing. Sub-100 kW motors are used on buses with a length of under 9 m; above 320 kW systems remain experimental in bi-articulated pilots.
Motor-power allocation thus mirrors geography: plains favor mid-band efficiency, hills need torque headroom. Fleet tenders are increasingly specifying kilowatt minima tied to route profiles, sharpening specification discipline within the Indian electric bus market.
By Range: Ultra-Long Range Targets Intercity Premium
The 201-300 km band led with a 54.07% share in 2025, aligning with two-shift city operations and overnight charging. Buses exceeding 450 km will post a 35.53% CAGR, especially on Mumbai-Pune and Bangalore-Chennai express services, where single-charge operation minimizes dwell time. Sub-100 km ranges work for airport loops using opportunity charging.
Range selection ties closely to charger availability. Until highway infrastructure matures, operators either oversize battery packs or defer deployment. These trade-offs directly influence capital intensity across the Indian electric bus market.
By End Use: Private Fleets Embrace Operational Leasing
Public operators accounted for 84.97% of 2025 revenue, backed by FAME II subsidies and Payment Security assurances. Private fleets, however, are expected to outpace the market at a 36.38% CAGR via zero-capex operating leases bundled by GreenCell Mobility and others. Employee shuttles averaging 120-150 km daily prove financially attractive within five-year payback horizons.
As corporate ESG mandates tighten, private adoption accelerates, diversifying buyer profiles and cushioning public-sector demand swings. This diffusion further deepens the Indian electric bus market.
Geography Analysis
South India accounted for a 48.76% share of the Indian electric bus market in 2025, driven by Karnataka's extensive fleet and Tamil Nadu's full tax waiver, which have established the region as a leader in electric bus adoption. Bengaluru's articulated bus contracts highlight the region's cost-efficient gross-cost model, while Telangana has capitalized on its proximity to OEMs to reduce lead times.
North India is projected to grow at a CAGR of 36.08% through 2031. Key tenders in Delhi and Uttar Pradesh are advancing under the Payment Security framework. However, depot electrification in cities such as Lucknow and Kanpur faces delays, with progress dependent on faster grid approval processes to avoid schedule disruptions.
West India has witnessed significant deployments, but differences in toll policies between Maharashtra and Gujarat continue to hinder the development of cross-border electric routes. Eastern and North-Eastern states are in the early stages of adoption, with Kolkata and Assam conducting pilot projects. However, supply chain challenges are causing extended delivery timelines in these regions.
Competitive Landscape
The Indian electric bus market is moderately fragmented, with key players such as Tata Motors, Switch Mobility, and Olectra Greentech holding a notable market share. Tata Motors capitalizes on its extensive nationwide after-sales network, while Switch Mobility benefits from Ashok Leyland’s manufacturing expertise. Olectra’s collaboration with BYD ensures a reliable battery supply, as evidenced by recent large-scale deliveries.
Emerging players like PMI Electro Mobility and Mytrah Mobility are securing niche tenders by offering bundled depot charging solutions and long-term uptime guarantees, which help mitigate risks for financially constrained state transport undertakings. GreenCell Mobility’s operating-lease model is gaining traction among private businesses, helping address cash-flow challenges and expand the customer base.
Component manufacturers are also influencing market dynamics. Hitachi Energy’s upcoming SiC module production line and TGOOD Infracom’s high-capacity highway chargers are advancing supply-chain localization. Meanwhile, Log9 Materials is focusing on SRM drivetrains to reduce reliance on rare-earth materials. Global OEMs such as Volvo Buses recognize the market potential, but still face challenges in meeting phased manufacturing requirements, which mandate substantial local value addition and limit the feasibility of imported platforms.
India Electric Bus Industry Leaders
JBM Auto Limited
Olectra Greentech Ltd.
Switch Mobility (Ashok Leyland Limited)
Tata Motors Limited
PMI Electro Mobility
- *Disclaimer: Major Players sorted in no particular order

Recent Industry Developments
- September 2025: In a significant push towards electrifying public transport and promoting innovative urban mobility in India, the International Finance Corporation (IFC) has extended a financing package of USD 137 million. Out of this, USD 100 million is allocated to JBM ECOLIFE (JBM), a subsidiary of JBM Auto Limited and a leading manufacturer and operator of e-buses in India. Meanwhile, GreenCell Mobility (GreenCell), recognized as India's largest OEM-agnostic e-bus operator and backed by Eversource Capital, receives USD 37 million in mezzanine capital.
- August 2025: Tata Motors, India's largest commercial vehicle manufacturer, has signed a Memorandum of Understanding (MoU) with Green Energy Mobility Solutions Pvt. Ltd (GEMS). GEMS, the electric mobility division promoted by Universal Bus Services (UBS), will receive 100 Magna EV intercity coaches from Tata Motors.


India Electric Bus Market Report Scope
The India electric bus market report is segmented by propulsion (battery electric bus, and more), application (city/transit, and more), battery chemistry (LFP, and more), length (below 9m, and more), motor architecture (PMSM, and more), motor power (below 100kW, 100-150kW, and more), range (below 100km, and more), end use (public and private), and region. The market forecasts are provided in terms of value (USD) and volume (units).
By Propulsion
| Battery Electric Bus (BEB) |
| Plug-in Hybrid Electric Bus (PHEB) |
| Fuel Cell Electric Bus (FCEB) |
By Application
| City / Transit |
| Intercity / Regional |
| Coach / Tourist |
| School Bus |
| Airport |
| Others |
By Battery Chemistry
| Lithium Iron Phosphate (LFP) |
| Nickel Manganese Cobalt (NMC) / Nickel Cobalt Aluminum (NCA) |
| Lithium Titanate (LTO) |
| Others (Sodium-ion, emerging/pilots) |
By Length
| Below 9 m |
| 9-14 m |
| 14-18 m |
| Above 18 m |
By Motor Architecture
| Permanent Magnet Synchronous Motor (PMSM) |
| Induction Motor / Asynchronous AC |
| Switched Reluctance Motor (SRM) |
| Others |
By Motor Power
| Below 100 kW |
| 100-150 kW |
| 151-200 kW |
| 201-250 kW |
| 251-320 kW |
| Above 320 kW |
By Range
| Below 100 km |
| 101-200 km |
| 201-300 km |
| 301-450 km |
| Above 450 km |
By End Use
| Public |
| Private |
By Region / State
| North India | New Delhi |
| Uttar Pradesh | |
| Rest of North India | |
| West India | Maharashtra |
| Gujarat | |
| Rest of West India | |
| South India | Karnataka |
| Tamil Nadu | |
| Telangana | |
| Rest of South India | |
| East and North-East | West Bengal |
| Assam | |
| Rest of East and North-East |
| By Propulsion | Battery Electric Bus (BEB) | |
| Plug-in Hybrid Electric Bus (PHEB) | ||
| Fuel Cell Electric Bus (FCEB) | ||
| By Application | City / Transit | |
| Intercity / Regional | ||
| Coach / Tourist | ||
| School Bus | ||
| Airport | ||
| Others | ||
| By Battery Chemistry | Lithium Iron Phosphate (LFP) | |
| Nickel Manganese Cobalt (NMC) / Nickel Cobalt Aluminum (NCA) | ||
| Lithium Titanate (LTO) | ||
| Others (Sodium-ion, emerging/pilots) | ||
| By Length | Below 9 m | |
| 9-14 m | ||
| 14-18 m | ||
| Above 18 m | ||
| By Motor Architecture | Permanent Magnet Synchronous Motor (PMSM) | |
| Induction Motor / Asynchronous AC | ||
| Switched Reluctance Motor (SRM) | ||
| Others | ||
| By Motor Power | Below 100 kW | |
| 100-150 kW | ||
| 151-200 kW | ||
| 201-250 kW | ||
| 251-320 kW | ||
| Above 320 kW | ||
| By Range | Below 100 km | |
| 101-200 km | ||
| 201-300 km | ||
| 301-450 km | ||
| Above 450 km | ||
| By End Use | Public | |
| Private | ||
| By Region / State | North India | New Delhi |
| Uttar Pradesh | ||
| Rest of North India | ||
| West India | Maharashtra | |
| Gujarat | ||
| Rest of West India | ||
| South India | Karnataka | |
| Tamil Nadu | ||
| Telangana | ||
| Rest of South India | ||
| East and North-East | West Bengal | |
| Assam | ||
| Rest of East and North-East | ||


Market Definition
- Vehicle Type - The category includes Medium and Heavy Duty Buses.
- Vehicle Body Type - This include Bus category.
- Fuel Category - The category exclusively covers electric propulsion systems, including various types such as HEV (Hybrid Electric Vehicles), PHEV (Plug-in Hybrid Electric Vehicles), BEV (Battery Electric Vehicles), and FCEV (Fuel Cell Electric Vehicles).
| Keyword | Definition |
|---|---|
| Electric Vehicle (EV) | A vehicle which uses one or more electric motors for propulsion. Includes cars, buses, and trucks. This term includes all-electric vehicles or battery electric vehicles and plug-in hybrid electric vehicles. |
| BEV | A BEV relies completely on a battery and a motor for propulsion. The battery in the vehicle must be charged by plugging it into an outlet or public charging station. BEVs do not have an ICE and hence are pollution-free. They have a low cost of operation and reduced engine noise as compared to conventional fuel engines. However, they have a shorter range and higher prices than their equivalent gasoline models. |
| PEV | A plug-in electric vehicle is an electric vehicle that can be externally charged and generally includes all-electric vehicles as well as plug-in hybrids. |
| Plug-in Hybrid EV | A vehicle that can be powered either by an ICE or an electric motor. In contrast to normal hybrid EVs, they can be charged externally. |
| Internal combustion engine | An engine in which the burning of fuels occurs in a confined space called a combustion chamber. Usually run with gasoline/petrol or diesel. |
| Hybrid EV | A vehicle powered by an ICE in combination with one or more electric motors that use energy stored in batteries. These are continually recharged with power from the ICE and regenerative braking. |
| Commercial Vehicles | Commercial vehicles are motorized road vehicles designed for transporting people or goods. The category includes light commercial vehicles (LCVs) and medium and heavy-duty vehicles (M&HCV). |
| Passenger Vehicles | Passenger cars are electric motor– or engine-driven vehicles with at least four wheels. These vehicles are used for the transport of passengers and comprise no more than eight seats in addition to the driver’s seat. |
| Light Commercial Vehicles | Commercial vehicles that weigh less than 6,000 lb (Class 1) and in the range of 6,001–10,000 lb (Class 2) are covered under this category. |
| M&HDT | Commercial vehicles that weigh in the range of 10,001–14,000 lb (Class 3), 14,001–16,000 lb (Class 4), 16,001–19,500 lb (Class 5), 19,501–26,000 lb (Class 6), 26,001–33,000 lb (Class 7) and above 33,001 lb (Class 8) are covered under this category. |
| Bus | A mode of transportation that typically refers to a large vehicle designed to carry passengers over long distances. This includes transit bus, school bus, shuttle bus, and trolleybuses. |
| Diesel | It includes vehicles that use diesel as their primary fuel. A diesel engine vehicle have a compression-ignited injection system rather than the spark-ignited system used by most gasoline vehicles. In such vehicles, fuel is injected into the combustion chamber and ignited by the high temperature achieved when gas is greatly compressed. |
| Gasoline | It includes vehicles that use gas/petrol as their primary fuel. A gasoline car typically uses a spark-ignited internal combustion engine. In such vehicles, fuel is injected into either the intake manifold or the combustion chamber, where it is combined with air, and the air/fuel mixture is ignited by the spark from a spark plug. |
| LPG | It includes vehicles that use LPG as their primary fuel. Both dedicated and bi-fuel LPG vehicles are considered under the scope of the study. |
| CNG | It includes vehicles that use CNG as their primary fuel. These are vehicles that operate like gasoline-powered vehicles with spark-ignited internal combustion engines. |
| HEV | All the electric vehicles that use batteries and an internal combustion engine (ICE) as their primary source for propulsion are considered under this category. HEVs generally use a diesel-electric powertrain and are also known as hybrid diesel-electric vehicles. An HEV converts the vehicle momentum (kinetic energy) into electricity that recharges the battery when the vehicle slows down or stops. The battery of HEV cannot be charged using plug-in devices. |
| PHEV | PHEVs are powered by a battery as well as an ICE. The battery can be charged through either regenerative breaking using the ICE or by plugging into some external charging source. PHEVs have a better range than BEVs but are comparatively less eco-friendly. |
| Hatchback | These are compact-sized cars with a hatch-type door provided at the rear end. |
| Sedan | These are usually two- or four-door passenger cars, with a separate area provided at the rear end for luggage. |
| SUV | Popularly known as SUVs, these cars come with four-wheel drive, and usually have high ground clearance. These cars can also be used as off-road vehicles. |
| MPV | These are multi-purpose vehicles (also called minivans) designed to carry a larger number of passengers. They carry between five and seven people and have room for luggage too. They are usually taller than the average family saloon car, to provide greater headroom and ease of access, and they are usually front-wheel drive. |


Research Methodology
Mordor Intelligence follows a four-step methodology in all its reports.
- Step-1: Identify Key Variables: To build a robust forecasting methodology, the variables and factors identified in Step-1 are tested against available historical market numbers. Through an iterative process, the variables required for market forecast are set and the model is built based on these variables.
- Step-2: Build a Market Model: Market-size estimations for the historical and forecast years have been provided in revenue and volume terms. Market revenue is calculated by multiplying the sales volume with their respective average selling price (ASP). While estimating ASP factors like average inflation, market demand shift, manufacturing cost, technological advancement, and varying consumer preference, among others have been taken into account.
- Step-3: Validate and Finalize: In this important step, all market numbers, variables, and analyst calls are validated through an extensive network of primary research experts from the market studied. The respondents are selected across levels and functions to generate a holistic picture of the market studied.
- Step-4: Research Outputs: Syndicated Reports, Custom Consulting Assignments, Databases & Subscription Platforms.


