Busbar Protection Market Size and Share
Market Overview
| Study Period | 2020 - 2030 |
|---|---|
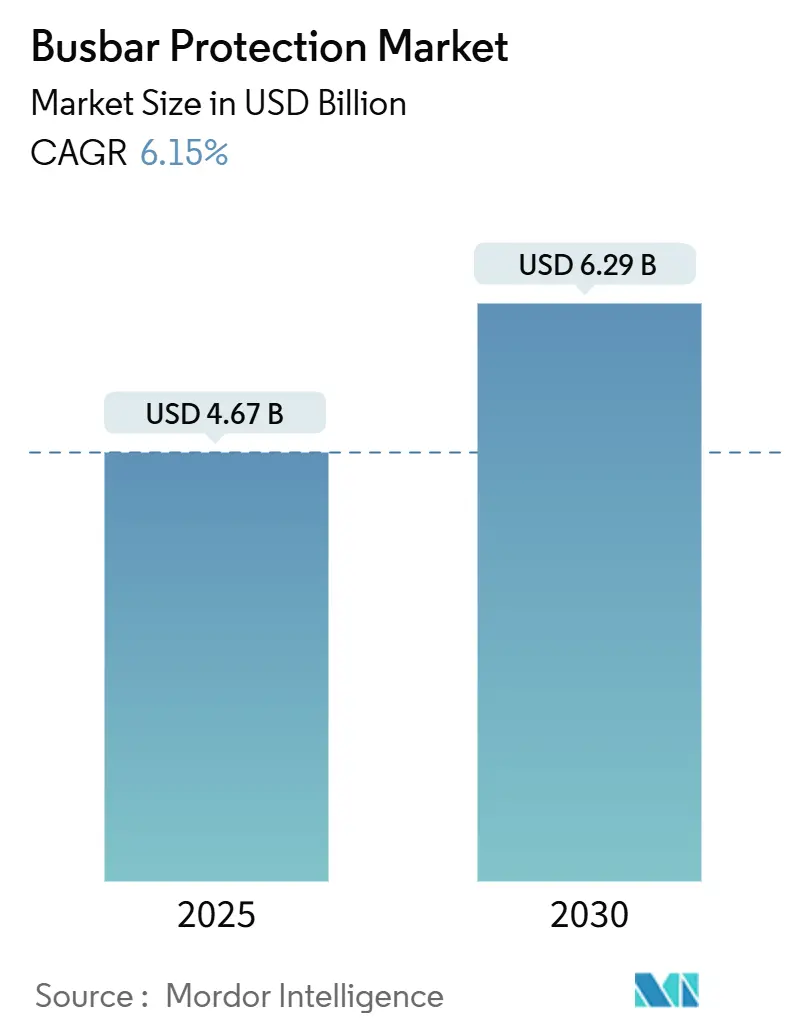
| Market Size (2025) | USD 4.67 Billion |
| Market Size (2030) | USD 6.29 Billion |
| Growth Rate (2025 - 2030) | 6.15% CAGR |
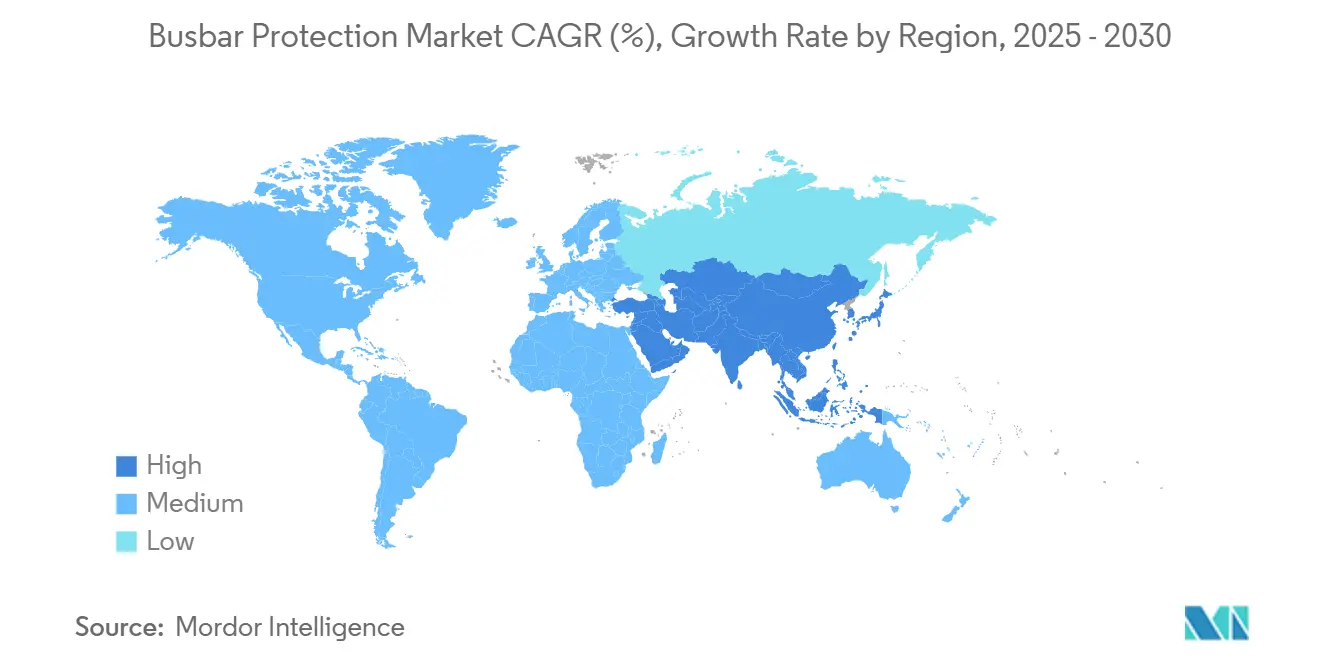
| Fastest Growing Market | Asia Pacific |
| Largest Market | Asia Pacific |
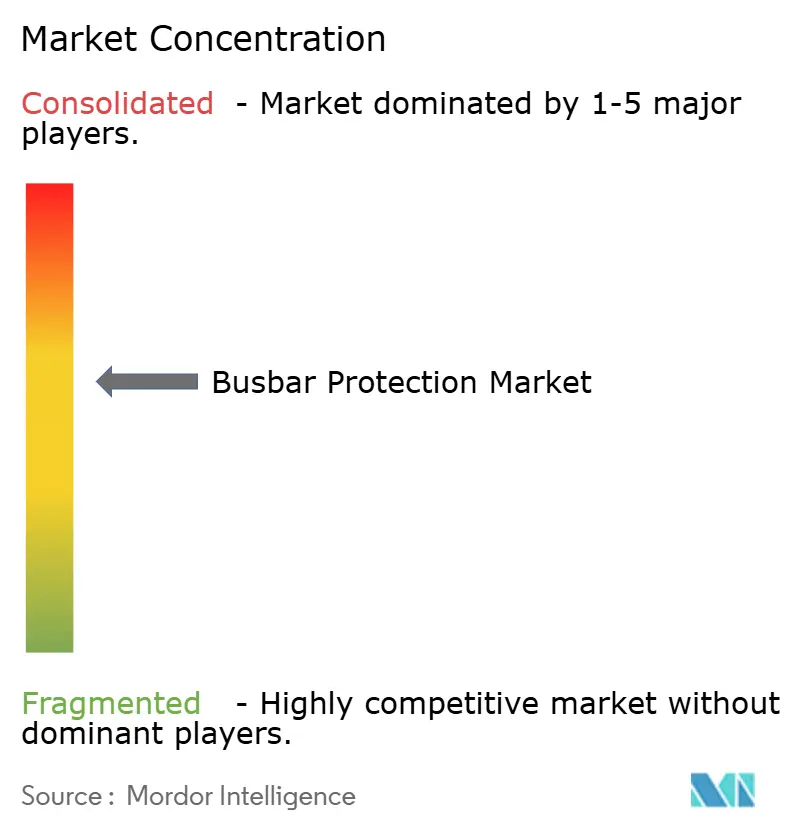
| Market Concentration | Medium |
Major Players *Disclaimer: Major Players sorted in no particular order Image © Mordor Intelligence. Reuse requires attribution under CC BY 4.0. | |
Busbar Protection Market Analysis by Mordor Intelligence
The Busbar Protection Market size is estimated at USD 4.67 billion in 2025, and is expected to reach USD 6.29 billion by 2030, at a CAGR of 6.15% during the forecast period (2025-2030).
Rising investment in digital substations, rapid electrification of transport infrastructure, and the shift from electromechanical relays toward IEC 61850-9-2 sampled-value architectures collectively underpin the current growth trajectory. Utilities are upgrading aging assets while accommodating inverter-based resources that disrupt conventional differential schemes, a dynamic that pushes spending toward adaptive, software-defined protection solutions.[1]IEEE Power & Energy Society, “Adaptive Busbar Protection in Inverter-Rich Grids,” ieeexplore.ieee.org Medium-voltage installations dominate because distribution grids face the greatest pressure for modernization, yet high-voltage projects show a faster uptake as HVDC multi-terminal interconnectors expand. Vendors now differentiate on cybersecurity, AI-enabled diagnostics, and lifecycle service capability rather than pure hardware ratings, opening space for digital-native entrants alongside legacy equipment majors. The Asia-Pacific region retains the largest regional footprint, thanks to large-scale grid extension projects, and its momentum remains strong as governments tie stimulus funds to reliability and safety upgrades.
Key Report Takeaways
- By technology, low-impedance differential schemes commanded a 60.5% market share of the busbar protection market in 2024; high-impedance schemes are projected to grow at a 7.8% CAGR through 2030.
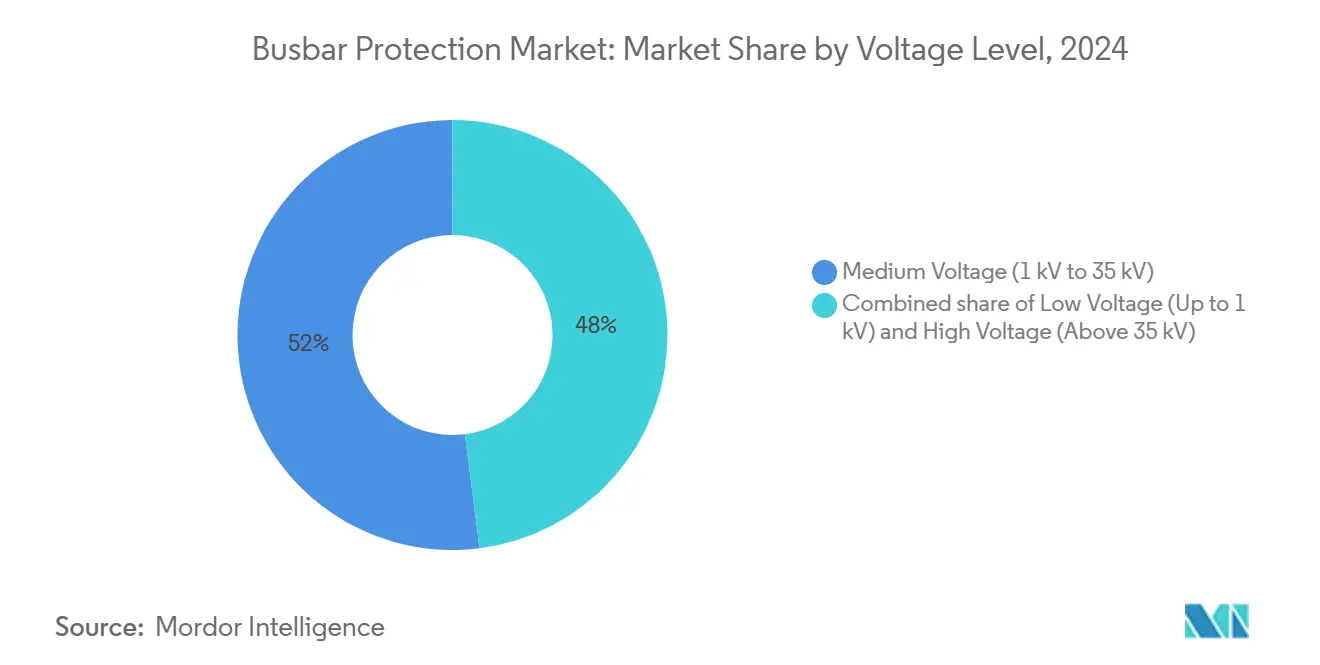
- By voltage level, medium-voltage systems captured 52.0% revenue share in 2024, while high-voltage projects are advancing at a 7.5% CAGR to 2030.
- By application, transmission and distribution substations accounted for a 42.6% share of the busbar protection market size in 2024; railway electrification is expected to expand at a 7.3% CAGR through 2030.
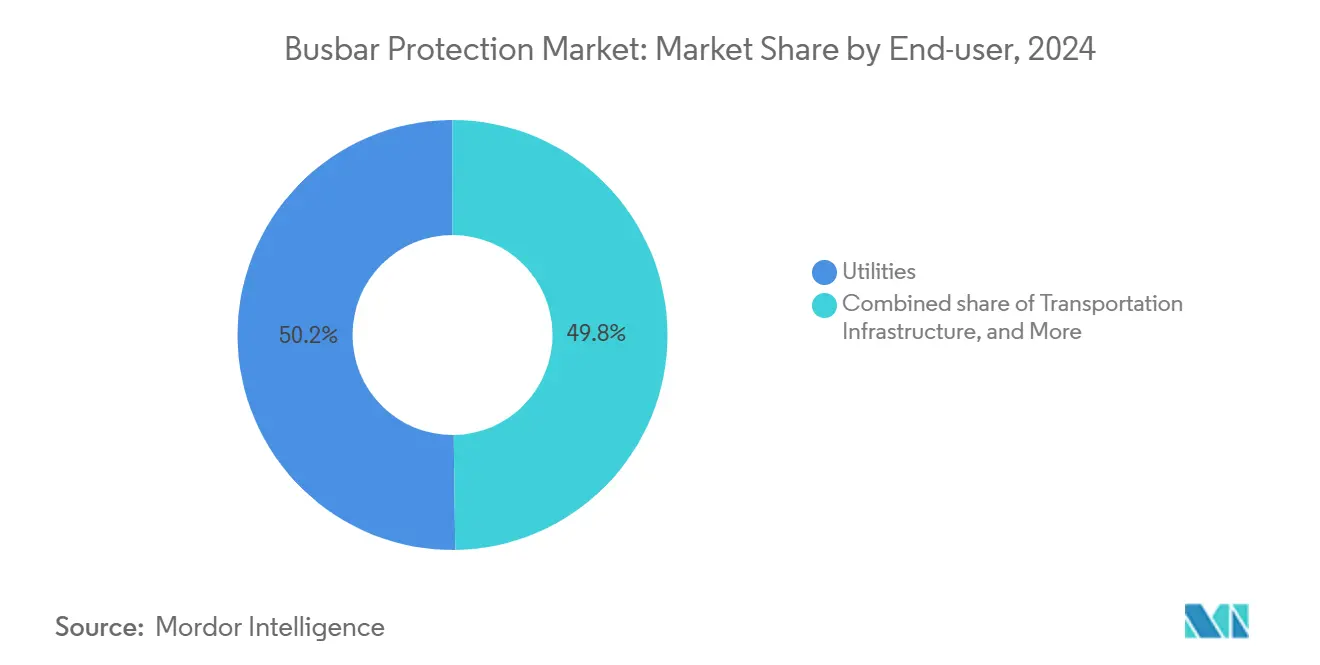
- By end-user, utilities held 50.2% of total demand in 2024, whereas transportation infrastructure recorded the highest CAGR at 7.9% between 2025 and 2030.
- By Geography, Asia-Pacific dominated with a 40.9% share of 2024 revenue and sustains a 6.7% CAGR over the forecast horizon.
Global Busbar Protection Market Trends and Insights
Drivers Impact Analysis*
| Driver | (~) % Impact on CAGR Forecast | Geographic Relevance | Impact Timeline |
|---|---|---|---|
| Rising focus on grid reliability & safety | +1.8% | North America, Europe, Global | Medium term (2-4 years) |
| Surge in substation automation & digital substations | +2.1% | Asia-Pacific core, spill-over to North America | Long term (≥ 4 years) |
| Expansion of T&D infrastructure in developing economies | +1.4% | Asia-Pacific, Middle East & Africa, South America | Long term (≥ 4 years) |
| Growth of HVDC multi-terminal interconnectors | +0.9% | Europe, China, Global | Medium term (2-4 years) |
| Deployment of campus/industrial looped micro-grids | +0.7% | North America, Europe, developed APAC markets | Short term (≤ 2 years) |
| Cyber-secure IEC 61850-9-2 Sampled Value mandates | +0.6% | Global, regulatory-driven adoption | Medium term (2-4 years) |
| Source: Mordor Intelligence | |||
Rising Focus on Grid Reliability & Safety
Utilities now view busbar protection as a frontline defense against cascading outages that stem from aging assets and climate-induced extreme events. The February 2024 Texas winter storm highlighted how relay misoperations can propagate blackouts, prompting regulators to mandate redundant schemes in critical substations.[2]Schneider Electric, “Reliability Upgrades After the 2024 Texas Storm,” se.com Vendors respond by embedding predictive analytics that track insulation degradation, contact resistance, and thermal stress, enabling proactive maintenance rather than time-based replacement. Integration of dissolved-gas analysis with relay event data provides a multi-factor health index for transformers, substantiating the push toward centralized protection and condition monitoring. Reliability is no longer framed solely around fault-clearing speed; adaptive algorithms now adjust settings in real-time, ensuring selectivity is preserved during network reconfiguration. Utilities, therefore, budget for software subscriptions and cloud analytics alongside conventional hardware.
Surge in Substation Automation & Digital Substations
Fiber-optic process buses reduce copper cabling by up to 80% and synchronize measurements with microsecond accuracy, forming the backbone of digital substations that replace discrete relays with centralized processors.[3]Hitachi Energy, “Digital Substations and Process Bus Benefits,” hitachienergy.com The Virtual Protection and Control Alliance, launched in 2024, accelerates vendor cooperation on hardware-agnostic protection logic that can be redeployed through over-the-air updates. ABB’s SSC600 exemplifies this architecture by virtualizing 30 relay functions on one platform and cutting lifecycle costs by 15% while boosting diagnostic coverage. Digitalization enables wide-area schemes that coordinate across multiple substations, mitigating the risk of regional blackouts. As more utilities tie automation projects to decarbonization goals, demand for busbar protection solutions that integrate seamlessly with process interface units and SCADA platforms is set to accelerate.
Expansion of T&D Infrastructure in Developing Economies
Emerging markets are building substations at an unprecedented rate to connect remote renewable energy sources and serve urbanizing populations. Modular busbar protection panels, designed for quick field assembly, enable utilities to scale capacity in lockstep with load growth while preserving capital flexibility. In Asia and Africa, inverter-based generators contribute lower fault currents, compelling the adoption of adaptive differential algorithms that can distinguish legitimate faults from control-system transients. Microgrid rollouts in industrial parks increase demand, as protection must ensure seamless islanding and reconnection. Battery energy storage further complicates the protection landscape, driving sales of solutions that detect DC faults and manage bidirectional flow. Many developing utilities are leapfrogging older relay generations, opting directly for digital-native products with built-in analytics and remote firmware management.
Growth of HVDC Multi-Terminal Interconnectors
Multi-terminal HVDC links underpin cross-border renewable power trading but create protection challenges that AC schemes cannot meet. Fault currents emanate from multiple converters with distinct control dynamics, making communication-assisted differential protection and traveling-wave detection standard in ±800 kV projects. Offshore wind farms that land power via HVDC require marine-grade busbar protection panels capable of sub-cycle clearing despite harsh humidity and vibration. Because most projects adopt multi-vendor supply chains, interoperability of sampled-value streams and GOOSE messages becomes a procurement criterion. Research teams are refining algorithms that filter converter switching noise while retaining fast fault discrimination, improving overall system stability.
Restraints Impact Analysis*
| Restraint | (~) % Impact on CAGR Forecast | Geographic Relevance | Impact Timeline |
|---|---|---|---|
| High upfront cost & system complexity | -1.2% | Global, strongest in developing markets | Short term (≤ 2 years) |
| Integration challenges with legacy infrastructure | -0.8% | North America, Europe | Medium term (2-4 years) |
| Power-electronics-induced protection mis-operations | -0.6% | Global, renewable-heavy grids | Medium term (2-4 years) |
| Scarcity of multi-vendor interoperability labs | -0.4% | Global, standardization-dependent | Long term (≥ 4 years) |
| Source: Mordor Intelligence | |||
High Upfront Cost & System Complexity
Digital busbar protection systems, which combine differential relays, process interface units, GPS clocks, and redundant Ethernet switches, result in a significant increase in capital outlay compared to electromechanical alternatives. Retrofit projects incur parallel costs for hybrid copper-and-fiber wiring, site acceptance testing, and operator retraining. Traditional tender evaluations often focus on unit price, which seldom reflects the total benefit of centralized architectures, leaving finance teams skeptical. Engineering teams also face a steep learning curve when transitioning from fixed-setting relays to IEC 61850 platforms, which lengthens commissioning timelines. Cost sensitivity in parts of South America, Africa, and Southeast Asia is therefore expected to slow the near-term rollout, despite long-term savings.
Integration Challenges with Legacy Infrastructure
SCADA front-ends installed in the early 2000s exchange slow serial messages and cannot ingest high-velocity sampled-value streams from modern digital relays, forcing utilities to build separate networks or install protocol converters. Mixing brands aggravates the issue because proprietary data models can hinder GOOSE peer-to-peer messaging. Cybersecurity risk increases when formerly air-gapped analog systems gain IP connectivity, prompting costly upgrades to firewalls and intrusion detection systems. Firmware management becomes another pain point: many legacy devices lack remote update capability, so field crews must schedule outages for manual upgrades. Stepwise modernization prolongs project timelines and inflates engineering hours.
*Our forecasts treat driver/restraint impacts as directional, not additive. The impact forecasts reflect baseline growth, mix effects, and variable interactions.
Segment Analysis
By Technology: Low-Impedance Schemes Dominate While High-Impedance Gains Traction
Low-impedance differential schemes accounted for 60.5% of 2024 revenue within the busbar protection market share, underscoring their continued popularity in high-fault-level transmission substations where speed and sensitivity are critical. These schemes rely on matched CT ratios and sophisticated restraint algorithms to clear internal faults in less than 1.5 cycles, preventing equipment damage and stabilizing neighboring feeders. Utilities favor them for retrofit projects because most conventional wiring can be reused. High-impedance schemes, however, are registering a 7.8% CAGR as utilities rich in renewables shift toward solutions that minimize false trips under low-infeed conditions. They depend on balance resistors and voltage thresholds, making them inherently secure against external disturbances but historically slower.
Machine-learning progress shrinks the trade-off. Vendors now embed neural networks that analyze waveform signatures to distinguish inrush or switching transients from genuine faults, thereby enhancing dependability without compromising security. Low-impedance platforms incorporate pattern-recognition models that filter out harmonics generated by the converter. High-impedance relays gain adaptive threshold tuning based on real-time system impedance. The convergence of both technologies within a single software container enables operators to remotely toggle logic sets, tailoring protection to seasonal grid conditions. Such versatility strengthens vendor lock-in but also gives asset managers finer control of risk.
By Voltage Level: Medium-Voltage Remains Largest While High-Voltage Accelerates
In 2024, medium-voltage installations, ranging from 1 kV to 35 kV, accounted for 52.0% of the total busbar protection market size as utilities reinforced their distribution grids with feeder automation and fault-location analytics.[4]Frontiers in Energy Research, “Protection Challenges at Medium Voltage,” frontiersin.org Rapid rooftop solar uptake and community batteries create bidirectional current flow, making adaptive protection at these voltages a foundational consideration. The high-voltage class, above 35 kV, is expected to grow at a 7.5% CAGR through 2030, driven by countries adding bulk transmission and long-haul HVDC corridors. These projects require higher CT accuracy, dual-redundant trip coils, and transfer-trip interfaces that integrate with wide-area control schemes.
Low-voltage installations, typically below 1 kV, serve commercial buildings, data centers, and industrial switchboards. While growth is steady, innovation centers on arc-flash mitigation and remote diagnostics to reduce maintenance windows. Unified protection platforms that span all three voltage classes help engineers standardize spares and training. Vendors that deliver scalable firmware capable of handling 480 V switchgear and ±800 kV DC links using the same configuration tool are gaining a competitive edge.


By Application: Substation Core Dominates While Railway Systems Surge
Transmission and distribution substations accounted for a 42.6% slice of the 2024 busbar protection market size, cementing their role as critical nodes in power system reliability. Grid codes in most regions require duplicated protection zones with independent power supplies, reinforcing baseline demand. Railway electrification, however, represents the fastest-growing application, with a 7.3% CAGR, aligned with global policy shifts toward electric transportation. Traction substations must handle regenerative braking currents that reverse power flow, and busbar protection relays now integrate specialised logic to differentiate these events from internal faults.
Renewable plants—especially utility-scale solar and wind—use collector buses that connect multiple inverter strings. Because fault current is limited and rides through low-voltage events, differential relays must detect subtle deviations in phase and magnitude. Data centers treat downtime as existential; hence, they deploy fully redundant busbar protection, sometimes across separate utility feeds. Marine platforms add a further niche where salt fog, vibration, and temperature cycling drive the need for ruggedisation.
By End-user: Utilities Lead While Transport Infrastructure Rises Fast
Utilities held 50.2% of global revenue in 2024, primarily due to their ownership of bulk substations and their overarching mandate for grid stability. Regulatory scrutiny obliges them to meet deterministic trip times and redundancy criteria, ensuring a steady replacement cycle. Transportation infrastructure—including metros, high-speed rail, and EV charging corridors—delivers a 7.9% CAGR to 2030. These projects often bundle energy storage and active load management, pushing the need for advanced logic capable of supervising multi-directional flows.
Industrial customers continue to invest steadily as they digitize their factory power rooms to prevent unplanned outages that could jeopardize production targets. Renewable developers are increasingly specifying IEC 61850-native relays, enabling balance-of-plant automation to leverage high-speed GOOSE signals. Mission-critical facilities, such as data centers and hospitals, require predictive analytics dashboards that integrate with facility management systems, enabling the transformation of protection status into actionable maintenance tickets.
Geography Analysis
The Asia-Pacific region contributed 40.9% of 2024 revenue and is projected to grow at a 6.7% CAGR to 2030, as China, India, and Southeast Asian nations increase transmission capacity, electrify transportation, and integrate renewables. China’s State Grid is deploying ±800 kV HVDC lines that span over 3,000 km, each terminal requiring redundant busbar protection panels capable of handling 31.5 kA fault currents. India’s Green Energy Corridor projects accelerate the adoption of digital substations, while Japan focuses on earthquake-resilient switchyards with fiber-optic process buses that reduce physical mass and enhance seismic endurance.
North America commands a significant share due to the Bipartisan Infrastructure Law, which allocates USD 2.2 billion for grid modernization, a portion earmarked for protection upgrades. Utilities must comply with NERC CIP cybersecurity frameworks, which now extend to relay firmware, propelling demand for secure boot, encryption, and user authentication features. The burgeoning data center cluster across Virginia, Texas, and Arizona prefers centralized busbar protection that supports predictive maintenance to sustain four-nines availability. Canada’s hydro-rich provinces overhaul switchyards dating from the 1970s, seeking differential schemes robust against transformer inrush.
Europe advances steadily through the integration of renewables and interconnector projects under the Ten-Year Network Development Plan. Baltic-Nordic HVDC links drive sales of DC differential protection. Germany’s Energiewende encourages the distribution of automation, which in turn necessitates medium-voltage bus upgrades. The United Kingdom fast-tracks EV charging corridors that impose new fault-level patterns, prompting the need for adaptive settings groups. The European Green Deal’s ban on SF₆-filled equipment after 2031 promotes the development of new gas-free switchgear that ships with embedded digital protection, creating a replacement wave.

Competitive Landscape
Market concentration is moderate. Siemens, ABB, and Schneider Electric maintain entrenched positions through comprehensive portfolios and global service footprints, while niche companies such as Schweitzer Engineering Laboratories secure projects by offering in-depth engineering support and rapid firmware customization. Competitive advantage is migrating from pure hardware metrics toward cybersecurity credentials, AI-driven diagnostics, and multi-protocol interoperability.
Strategic moves include ABB launching the SSC600-SW, a virtual appliance that enables utilities to run differential protection on commodity servers, thereby reducing the total cost of ownership and aligning with broader IT-OT convergence. Schneider Electric introduced EV charging protection through Schneider Charge Pro, which bundles adaptive load-balancing relays with energy management software. Acquisitions continue: Power Grid Components bought Vizimax in May 2024 to add traveling-wave technology, and Eaton took a stake in Jiangsu Huineng Electric to deepen Asia-Pacific supply capacity.
The Virtual Protection and Control Alliance fosters an ecosystem in which independent software vendors can certify logic blocks for vendor-neutral execution, pressuring incumbents to open proprietary toolchains. AI start-ups now partner with OEMs to embed predictive models that flag CT saturation or breaker wear before failures occur, challenging traditional service revenue streams.
Busbar Protection Industry Leaders
Siemens AG
Schneider Electric SE
General Electric
Schweitzer Engineering Laboratories (SEL)
Hitachi Energy Ltd
- *Disclaimer: Major Players sorted in no particular order

Recent Industry Developments
- January 2025: Schneider Electric launched Schneider Charge Pro, an energy-efficient EV charging solution with integrated busbar protection and dynamic load management.
- December 2024: Legrand acquired Power Bus Way to enhance busbar and protection integration for commercial projects.
- August 2024: ABB purchased SEAM Group, adding testing and commissioning services that bolster its lifecycle offering for protection solutions.
- March 2024: Schneider Electric has committed USD 140 million to expand U.S. manufacturing of medium-voltage switchgear, supporting the demand for critical infrastructure.


Global Busbar Protection Market Report Scope
| Low-Impedance Differential |
| High-Impedance Differential |
| Low Voltage (Up to 1 kV) |
| Medium Voltage (1 kV to 35 kV) |
| High Voltage (Above 35 kV) |
| Fault Detection |
| Fast Isolation |
| Selective Tripping |
| Backup Coordination |
| Transmission and Distribution Substations |
| Switchgear Systems |
| Renewable Energy Plants |
| Power Generation Stations |
| Railway Electrification Systems |
| Data Centers and Critical Infra |
| Marine and Offshore Platforms |
| Others |
| Utilities |
| Industrial Facilities |
| Renewable Energy Developers |
| Commercial Buildings and Campuses |
| Data Centers and IT Infrastructure |
| Transportation Infrastructure |
| Defense and Maritime |
| Others |
| North America | United States |
| Canada | |
| Mexico | |
| Europe | Germany |
| United Kingdom | |
| France | |
| Italy | |
| NORDIC Countries | |
| Russia | |
| Rest of Europe | |
| Asia-Pacific | China |
| India | |
| Japan | |
| South Korea | |
| ASEAN Countries | |
| Rest of Asia-Pacific | |
| South America | Brazil |
| Argentina | |
| Rest of South America | |
| Middle East and Africa | Saudi Arabia |
| United Arab Emirates | |
| South Africa | |
| Egypt | |
| Rest of Middle East and Africa |
| By Technology | Low-Impedance Differential | |
| High-Impedance Differential | ||
| By Voltage Level | Low Voltage (Up to 1 kV) | |
| Medium Voltage (1 kV to 35 kV) | ||
| High Voltage (Above 35 kV) | ||
| By Function (Qualitative Analysis only) | Fault Detection | |
| Fast Isolation | ||
| Selective Tripping | ||
| Backup Coordination | ||
| By Application | Transmission and Distribution Substations | |
| Switchgear Systems | ||
| Renewable Energy Plants | ||
| Power Generation Stations | ||
| Railway Electrification Systems | ||
| Data Centers and Critical Infra | ||
| Marine and Offshore Platforms | ||
| Others | ||
| By End-user | Utilities | |
| Industrial Facilities | ||
| Renewable Energy Developers | ||
| Commercial Buildings and Campuses | ||
| Data Centers and IT Infrastructure | ||
| Transportation Infrastructure | ||
| Defense and Maritime | ||
| Others | ||
| By Geography | North America | United States |
| Canada | ||
| Mexico | ||
| Europe | Germany | |
| United Kingdom | ||
| France | ||
| Italy | ||
| NORDIC Countries | ||
| Russia | ||
| Rest of Europe | ||
| Asia-Pacific | China | |
| India | ||
| Japan | ||
| South Korea | ||
| ASEAN Countries | ||
| Rest of Asia-Pacific | ||
| South America | Brazil | |
| Argentina | ||
| Rest of South America | ||
| Middle East and Africa | Saudi Arabia | |
| United Arab Emirates | ||
| South Africa | ||
| Egypt | ||
| Rest of Middle East and Africa | ||


Key Questions Answered in the Report
What growth rate is expected for busbar protection through 2030?
Global revenue is projected to rise at a 6.15% CAGR between 2025 and 2030.
Which region currently leads demand?
Asia-Pacific captured 40.9% of 2024 revenue and retains the largest footprint.
Which technology dominates shipments?
Low-impedance differential schemes hold 60.5% of 2024 sales, driven by high sensitivity needs.
How rapidly are railway applications expanding?
Railway electrification protection demand is growing at a 7.3% CAGR through 2030.
What factor most restrains adoption?
High initial cost and system complexity reduce near-term uptake, especially in developing markets.
Page last updated on:


