Market Overview
| Study Period | 2020 - 2031 |
|---|---|
| Forecast Data Period | 2026 - 2031 |
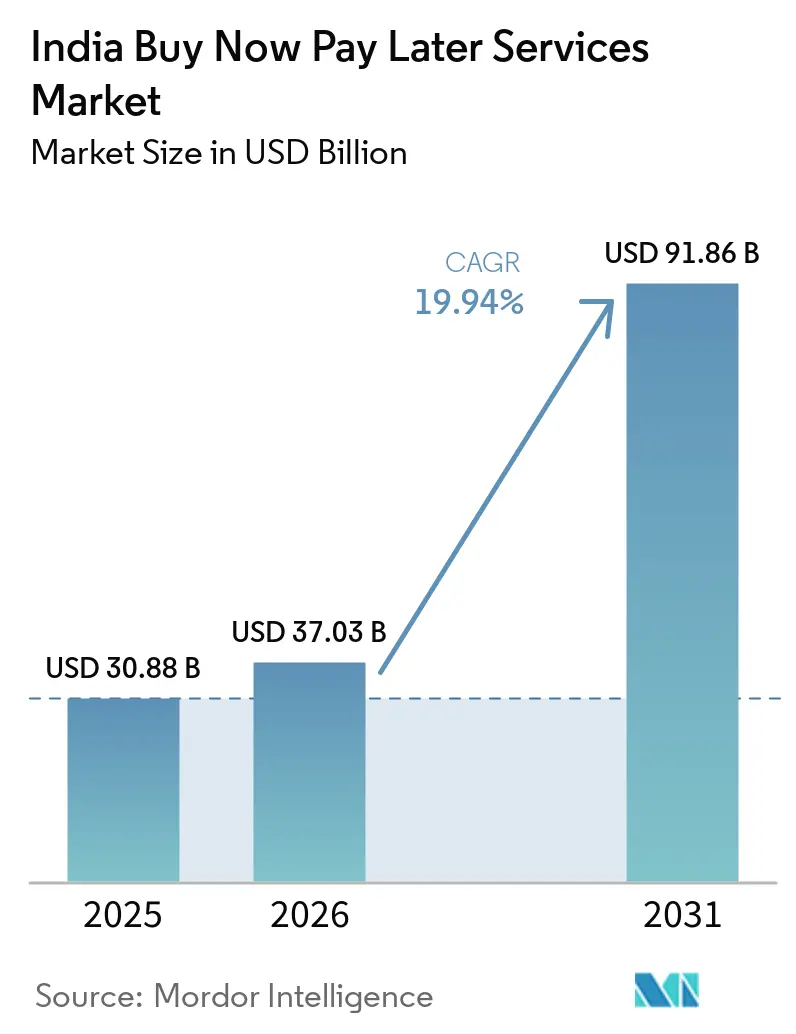
| Base Year Market Size (2025) | USD 30.88 Billion |
| Market Size (2026) | USD 37.03 Billion |
| Market Size (2031) | USD 91.86 Billion |
| Growth Rate (2026 - 2031) | 19.94% CAGR |
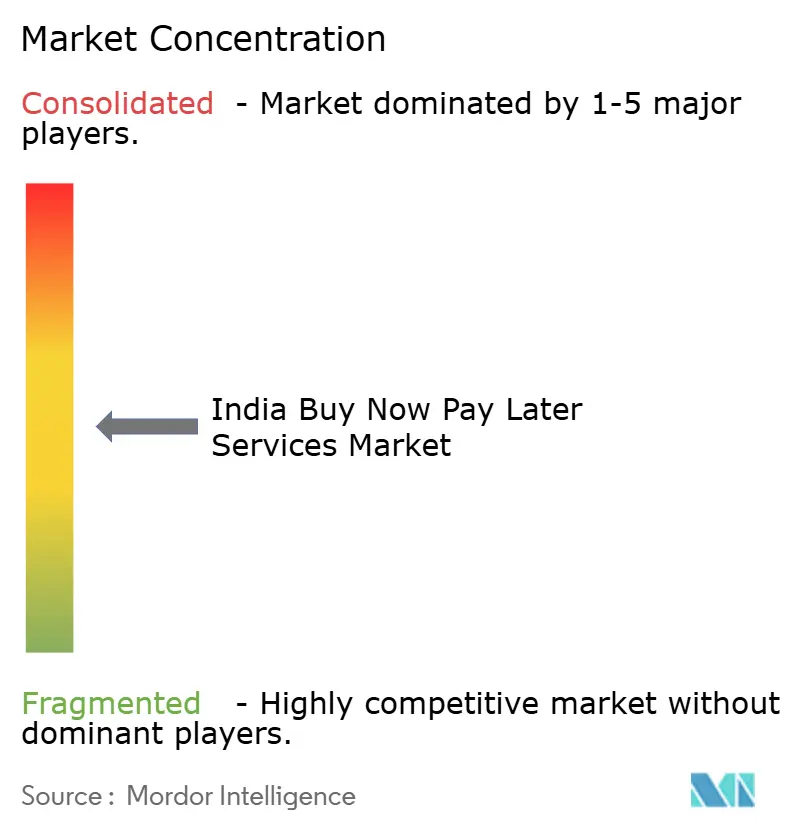
| Market Concentration | Medium |
Major Players *Disclaimer: Major Players sorted in no particular order Image © Mordor Intelligence. Reuse requires attribution under CC BY 4.0. | |
India Buy Now Pay Later Services Market Analysis by Mordor Intelligence
India buy now pay later (BPNL) services market size in 2026 is estimated at USD 37.03 billion, growing from 2025 value of USD 30.88 billion with 2031 projections showing USD 91.86 billion, growing at 19.94% CAGR over 2026-2031. This trajectory places the India buy now pay later (BPNL) services at the center of a structural realignment in consumer credit, driven by UPI-enabled instant underwriting, a 95% credit-card-unserved population, and a more balanced regulatory stance that now favors compliant innovation. Fintechs still set the pace on customer experience, yet banks are scaling quickly by embedding buy now pay later (BPNL) rails into existing debit ecosystems, creating a dual-track competitive model. Tier II and Tier III cities supply new growth, fueled by vernacular apps and rising smartphone penetration, while healthcare and education purchases unlock fresh use cases that lift average transaction values. Delinquencies in short-term loans and tighter default-loss rules curb near-term profitability, but the India buy now pay later (BPNL) services market continues to outpace global peers in both user additions and merchant integrations.
Key Report Takeaways
- By channel, online transactions led with 82.90% revenue share in 2025 in the buy now pay later (BPNL) services market, while point-of-sale buy now pay later (BPNL) is forecasted to grow at a 24.08% CAGR through 2031.
- By end-use industry, consumer electronics held 34.60% of the India buy now pay later (BPNL) services market share in 2025; healthcare & wellness is advancing at a 25.58% CAGR through 2031.
- By age group, Generation Z commanded a 39.40% share of the India buy now pay later (BPNL) services market size in 2025 and is projected to expand at 23.18% CAGR between 2026-2031.
- By provider type, fintechs retained a 64.10% share in the 2025 India buy now pay later (BPNL) services market, whereas banks are expected to record the fastest growth at a 24.71% CAGR through 2031.
Note: Market size and forecast figures in this report are generated using Mordor Intelligence’s proprietary estimation framework, updated with the latest available data and insights as of 2026.
India Buy Now Pay Later Services Market Trends and Insights
Drivers Impact Analysis*
| Driver | (~) % Impact on CAGR Forecast | Geographic Relevance | Impact Timeline |
|---|---|---|---|
| Rapid UPI-driven instant credit underwriting | +5.8% | National; strongest in Tier II & III cities | Medium term (2–4 years) |
| Low credit-card penetration | +4.2% | National; higher in semi-urban and rural areas | Long term (≥ 4 years) |
| Merchant push to reduce COD returns | +3.1% | National; concentrated in e-commerce hubs | Short term (≤ 2 years) |
| Account Aggregator-enabled real-time data | +3.9% | National | Medium term (2–4 years) |
| Embedded BNPL for healthcare & education | +2.5% | Urban first, expanding to Tier II cities | Medium term (2–4 years) |
| Smartphone and vernacular-app adoption | +2.1% | Tier II, III cities and rural areas | Medium term (2–4 years) |
| Source: Mordor Intelligence | |||
Rapid UPI-driven instant credit underwriting in Tier II & Tier III cities
The convergence of UPI and pre-sanctioned credit lines lets shoppers in smaller cities access checkout finance within seconds, eliminating paperwork and raising eligibility for “new-to-credit” users. Companies such as HDFC Bank and ICICI Bank now overlay PayLater accounts on standard QR payments, while super.money processed 124.83 million UPI-credit transactions in January 2025 alone[1]super.money, “super.money Acquires BharatX to Expand UPI Credit,” super.money. The outcome is a wider India buy now pay later (BPNL) services market customer base, higher ticket sizes, and stronger merchant acceptance in locations that previously lacked formal credit infrastructure.
Low credit-card penetration fueling alternative credit
With card penetration at only 5% of adults, the Indian BNPL market fills a systemic gap rather than merely offering convenience. Adoption could reach 100 million users by 2026 as consumers opt for instalments that sidestep interest-heavy revolving debt. Seamless UPI routing removes onboarding friction and positions BNPL as the de facto digital credit rail for discretionary as well as essential purchases.
Merchants push to cut COD returns and lift average order value
Cash-on-delivery still dominates rural commerce, creating refund risks and working-capital drag. When merchants embed BNPL through partners like Simpl and Cashfree Payments, cart abandonment falls by 51% and order value rises by 30%, improving gross margins and encouraging wider adoption. This reinforcement loop accelerates transaction growth within the India BNPL market and rewards providers that integrate deeply into checkout flows.
RBI Account Aggregator & India Stack enable real-time data
Consent-based data sharing reduces the historic 7-day approval lag to minutes, expanding underwriting to thin-file customers. The Open Credit Enablement Network standardizes lender–fintech connectivity, lowering acquisition costs and ensuring regulatory visibility. Faster approvals translate into higher conversion, anchoring a sustainable demand curve for the Indian BNPL market[2]Reserve Bank of India, “Risk-Weight Framework for Consumer Microfinance,” rbi.org.in.
Restraints Impact Analysis*
| Restraint | (~) % Impact on CAGR Forecast | Geographic Relevance | Impact Timeline |
|---|---|---|---|
| RBI curbs on prepaid credit lines tighten models | -3.20% | National | Short term (≤ 2 years) |
| Rising short-tenor loan delinquencies hurt unit economics | -2.60% | Tier II & Tier III cities | Medium term (2-4 years) |
| Consumer Data-Privacy Concerns over Alt-Data Harvesting | -1.5% | Urban centers initially | Medium term (2-4 years) |
| FinTech Funding Winter Restricts Loan-Book Expansion | -1.8% | National | Short term (≤ 2 years) |
| Source: Mordor Intelligence | |||
RBI curbs on prepaid credit lines tighten operating models
Draft guidelines now treat BNPL balances as formal loans, forcing non-banks to partner with regulated entities, raise capital, and overhaul disclosures[3]Reserve Bank of India, “Guidelines on Default Loss Guarantee in Digital Lending,” rbi.org.in. Compliance outlays climb, eligibility narrows, and some providers pause expansion until revised frameworks stabilize.
Rising short-tenor loan delinquencies impact unit economics
Early repayment stress has widened provisioning gaps after regulators excluded default-loss guarantees from credit-loss buffers. NBFCs sourcing loans from fintechs report profit compression, which could limit loan-book growth unless underwriting models tighten and risk-based pricing improves.
*Our forecasts treat driver/restraint impacts as directional, not additive. The impact forecasts reflect baseline growth, mix effects, and variable interactions.
Segment Analysis
By Channel: Physical checkout finance accelerates omnichannel convergence
Point-of-sale buy now pay later (BPNL) services is projected to grow at 24.08% CAGR, reflecting shoppers’ preference for instantaneous QR-code credit at neighborhood stores. In 2025, the online route still held 82.90% of India buy now pay later (BPNL) services market revenue, but in-store momentum signals deeper integration between digital wallets and physical merchants. UPI-linked credit lines let buyers split payments without submitting new KYC forms, lowering friction and extending reach beyond e-commerce.
The India buy now pay later (BPNL) services market size for in-store purchases is projected to surge as payment processors embed instalment buttons inside existing POS software, allowing merchants to auto-offer tenure options on high-value items. As offline and online boundaries blur, providers focus on uniform user journeys that preserve repayment reminders, loyalty perks, and credit limits across multiple touchpoints. This omnichannel approach limits customer churn and raises lifetime value.


By End-Use Industry: Healthcare financing unlocks untapped demand
Consumer electronics retained 34.60% of the 2025 India buy now pay later (BPNL) services market share, since instalments align with average handset or appliance outlays. Yet, healthcare & wellness, growing at 25.58% CAGR, now pulls BNPL into essential spending where immediate liquidity gaps are critical. Hospitals and clinics integrate instant credit APIs, reducing admissions delays caused by upfront deposit requirements.
India's BNPL market size for healthcare procedures is forecast to multiply as providers package repayment schedules around insurance reimbursement cycles. Momentum in elective surgeries and wellness subscriptions signals durable demand, prompting specialized BNPL start-ups to partner with hospital networks and diagnostic chains. Diversification into healthcare cushions providers from discretionary-spend cycles tied to electronics or fashion.
By Age Group: Generation Z sets adoption tempo
Generation Z held 39.40% of total users in 2025 and registers a 23.18% CAGR, reflecting mobile-first habits and mistrust of revolving credit. This cohort’s threefold higher propensity to choose buy now pay later (BPNL) services supports consistent transaction growth in the Indian buy now pay later (BPNL) services market. Use cases span from online fashion drops to offline gadgets, driven by gamified repayment dashboards.
Millennials follow as heavy-ticket shoppers and prefer buy now pay later (BPNL) services for home upgrades and travel plans. Older cohorts adopt selectively, typically for medical or utility spends where staggered payments ease budget shocks. Providers tailor communication in regional languages, boosting penetration in semi-urban clusters where digital confidence is rising.

By Provider: Banks leverage compliance edge to close gap
Fintechs still accounted for 64.10% of India buy now pay later (BPNL) services market size in 2025, underpinned by agile UX and rapid merchant onboarding. Nevertheless, banks are advancing at 24.71% CAGR by embedding BNPL inside familiar net-banking and debit channels. UPI-linked PayLater products move bank customers from swipe-based to scan-based credit, encouraging cross-selling of deposits and insurance.
Co-lending partnerships dominate; fintechs manage front-end acquisition and analytics, while banks fund balances and absorb regulatory exposure. The India buy now pay later (BPNL) service industry, therefore, evolves toward platform alliances rather than single-stack disruption, creating blended offerings that pair intuitive interfaces with low-cost balance-sheet capital.
Geography Analysis
The India buy now pay later services market presents a layered regional profile. Metropolitan cities currently contribute the highest absolute transaction volumes, yet semi-urban centers post faster growth, helped by a 414% rise in credit-card spend from 2019 to 2024 versus 96% in metros. Improved broadband, government identity programs, and aggressive e-commerce expansion encourage merchants in Indore, Coimbatore, and Guwahati to integrate checkout instalments.
Tier II and Tier III cities now house 72% of internet users; vernacular apps streamline onboarding, and family-owned stores begin to prefer QR-code buy now pay later services over ledger credit. The India buy now pay later services market size linked to these cities is forecast to widen as fintechs mine alternative data, such as utility payments, to calibrate risk for first-time borrowers. Aggregator hubs in Jaipur and Lucknow also attract fintech operations talent, distributing service centers beyond Bengaluru and Mumbai.
Rural markets remain nascent yet strategic. Limited card acceptance and seasonal cash flows create demand for micro-instalments aligned with harvest cycles. Banks pilot buy now pay later services products bundled with savings accounts, while NBFCs tap Account Aggregator feeds to vet applicants who previously held no formal credit footprint. As telecom operators extend 4G coverage, rural adoption is set to add incremental volume to the India buy now pay later services market without materially elevating risk due to smaller but more frequent ticket sizes.
Competitive Landscape
The India buy now pay later services market remains moderately fragmented, with fintechs, banks, and large e-commerce firms vying for niche control rather than outright dominance. Capital Float’s tie-up with Razorpay covers more than 100,000 online merchants and raises average order value by 30%, illustrating the value of partnership scale. Entry barriers are dropping for customer-facing interfaces, which intensifies marketing spend but shifts differentiation toward underwriting sophistication and lifecycle engagement.
White-space opportunities appear in healthcare, education, and B2B procurement, where ticket sizes and repayment calendars differ from retail norms. Start-ups that harness consent-based payroll and GST data offer risk-based pricing that traditional scorecards miss. The India buy now pay later services market also witnesses vertical plays, such as travel portals embedding pay-later buttons that integrate with loyalty miles, driving retention without outright subsidies.
Regulation shapes competitive positioning. Providers with bank sponsorships or captive NBFC arms adapt faster to default-loss caps and reporting requirements, easing investor concerns about credit-cost volatility. As operational resilience gains weight, consolidation is likely: under-capitalized players may exit or merge once fintech funding recovers. The next phase of the India BNPL industry will likely revolve around federated ecosystems that balance seamless UX with regulator-approved back-end processes.
India Buy Now Pay Later Services Industry Leaders
Paytm Postpaid
LazyPay
Amazon Pay Later
MobiKwik ZIP
ZestMoney
- *Disclaimer: Major Players sorted in no particular order

Recent Industry Developments
- May 2025: SMFG India Credit and Credit Saison India reported profit declines after mandatory provisioning changes on fintech-sourced loans.
- March 2025: RBI’s reduced risk weights encourage NBFCs to prefer bank loans over short-term commercial paper.
- February 2025: super.money acquired BharatX to integrate buy now pay later (BPNL) into UPI, processing 124.83 million transactions in January 2025.
- December 2024: Axis Bank, HDFC Bank, ICICI Bank, and SBI launched new digital pay-later and savings products aimed at rural and green consumer segments.


Research Methodology Framework and Report Scope
Market Definitions and Key Coverage
Our study defines the India buy-now-pay-later (BNPL) services market as all consumer-facing, short-tenor credit products that let shoppers split a purchase into interest-free installments, whether transacted online or at a point-of-sale terminal, and issued by fintech specialists, banks, or co-branded platforms. The geographic scope is the Republic of India, and values reflect the total loan value generated in a calendar year.
Scope Exclusion: Traditional credit-card EMI programs and B2B trade-credit lines sit outside this assessment.
Segmentation Overview
- By Channel
- Online
- Point-of-Sale (In-store)
- By End-Use Industry
- Consumer Electronics
- Fashion & Apparel
- Healthcare & Wellness
- Home Improvement
- Travel & Leisure
- Media & Entertainment
- Other End-Use Industries
- By Age Group
- Generation Z (18-28 Years)
- Millennials (29-44 Years)
- Generation X (45-60 Years)
- Baby Boomers (61-79 Years)
- Silent Generation (80 Years and Above)
- By Provider
- Fintechs
- Banks
- Others
Detailed Research Methodology and Data Validation
Primary Research
Mordor analysts conducted interviews with BNPL product heads at large fintechs and private banks, risk officers at non-bank lenders, and merchants across Tier 1-3 cities. We also surveyed Gen Z and millennial users to test adoption assumptions, refine average ticket sizes, and cross-check delinquency estimates.
Desk Research
We began with central-bank payments statistics, National Payments Corporation of India UPI dashboards, Reserve Bank of India circulars on digital lending, and Ministry of Commerce e-commerce updates, which ground the market's transaction pool. Industry associations such as the Payments Council of India and FICCI contributed adoption metrics, while leading newspapers and investor filings revealed provider loan books. Paid databases, such as Dow Jones Factiva for news runs and D&B Hoovers for company financials, supplied further validation. The sources listed are illustrative only; numerous additional documents informed the analysis.
Market-Sizing & Forecasting
A top-down model converts national e-commerce and card-less digital payment value into a BNPL demand pool using measured penetration rates, then corroborates totals with bottom-up snapshots from provider loan books and sampled average selling price × volume checks. Key variables include smartphone penetration, UPI transaction velocity, credit-card issuance per 1,000 adults, RBI directive timelines, and delinquency swing factors, each forecast through multivariate regression. Where bottom-up disclosures are sparse, gaps are bridged by channel checks with processors and merchant aggregators before weights are finalized.
Data Validation & Update Cycle
Outputs pass anomaly screens against external payment metrics, peer ratios, and year-on-year trend bounds. Two analyst reviews precede sign-off. We refresh every twelve months, with interim updates when policy or funding events materially move the market.
Why Mordor's India Buy Now Pay Later Services Baseline Earns Decision-Maker Trust
Published estimates often differ because firms pick unlike transaction scopes, apply varying average ticket sizes, or lock models to outdated policy scenarios.
Key gap drivers in this market are whether in-store deferred-payment volumes are counted, how canceled loans are netted out, the currency year used for UPI feeds, and the cadence at which provider disclosures are refreshed. Mordor's baseline aligns scope firmly with RBI definitions, applies live FX and inflation factors, and is re-benchmarked annually, which many publishers skip.
Benchmark comparison
| Market Size | Anonymized source | Primary gap driver |
|---|---|---|
| USD 30.88 B (2025) | Mordor Intelligence | - |
| USD 15.37 B (2024) | Regional Consultancy A | Excludes in-store BNPL and assumes static UPI growth |
| USD 21.95 B (2025) | Global Consultancy B | Uses provider GMV only, omits failed payment roll-backs |
Taken together, the comparison shows that Mordor's disciplined scope setting, variable selection, and yearly refresh cycle deliver a balanced, transparent baseline our clients can rely on.


Key Questions Answered in the Report
What is the projected value of the India buy now pay later (BPNL) services market by 2031?
The India buy now pay later (BPNL) services market is forecast to reach USD 91.86 billion by 2031, growing at a 19.94% CAGR.
Which channel is expanding fastest within the India buy now pay later (BPNL) services market?
Point-of-sale buy now pay later (BPNL) services at physical stores is the fastest-growing channel, with a 24.08% CAGR expected between 2026 and 2031.
Why is Generation Z the largest user group for buy now pay later (BPNL) services in India?
Generation Z prefers mobile-first, interest-free instalments and faces limited access to traditional credit cards, leading to a 39.40% user share and a 23.18% CAGR growth rate.
How are banks competing with fintechs in the India buy now pay later (BPNL) services industry?
Banks embed pay-later features into existing UPI and debit products, leverage low-cost capital, and partner with fintechs for acquisition, enabling a 24.71% CAGR in their BNPL portfolios.
What regulatory change has most affected buy now pay later (BPNL) services profitability in 2025?
The RBI’s decision to exclude default-loss guarantees from provisioning calculations has increased credit costs for NBFC-fintech collaborations, pressuring margins.
Which end-use segment offers the highest growth opportunity for buy now pay later (BPNL) services providers?
Healthcare & wellness leads with a 25.58% CAGR as hospitals and clinics adopt instalment payments for high-ticket procedures.
Page last updated on:


