Market Overview
| Study Period | 2020 - 2031 |
|---|---|
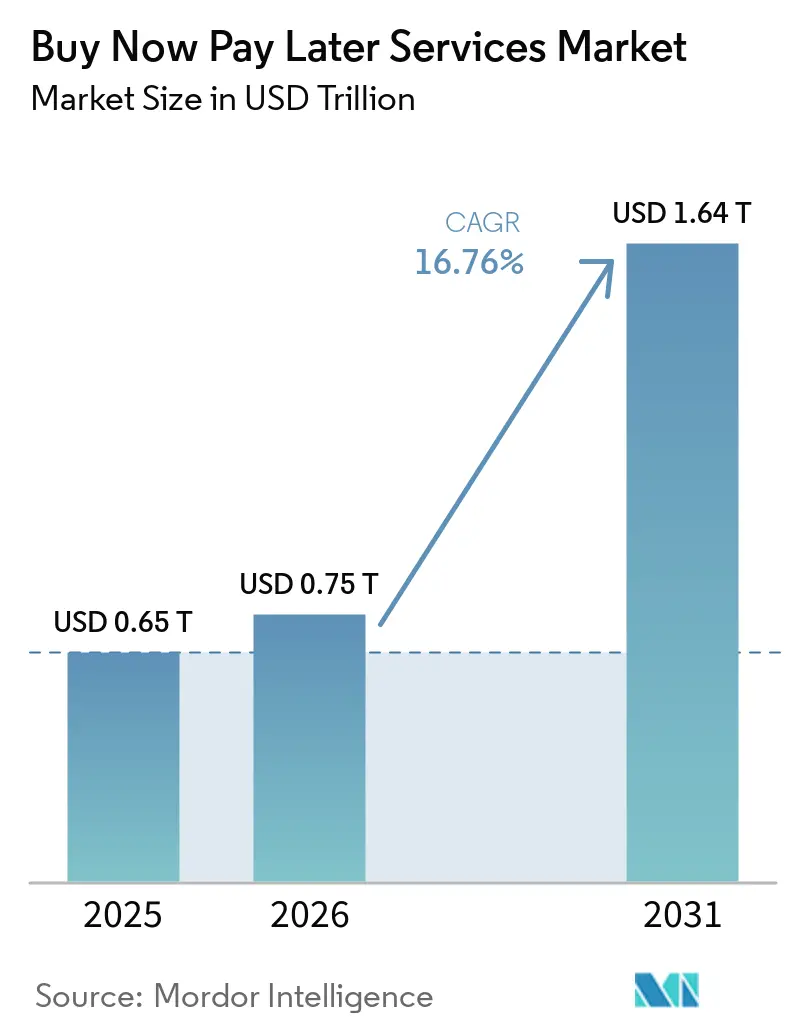
| Market Size (2026) | USD 0.75 Trillion |
| Market Size (2031) | USD 1.64 Trillion |
| Growth Rate (2026 - 2031) | 16.76% CAGR |
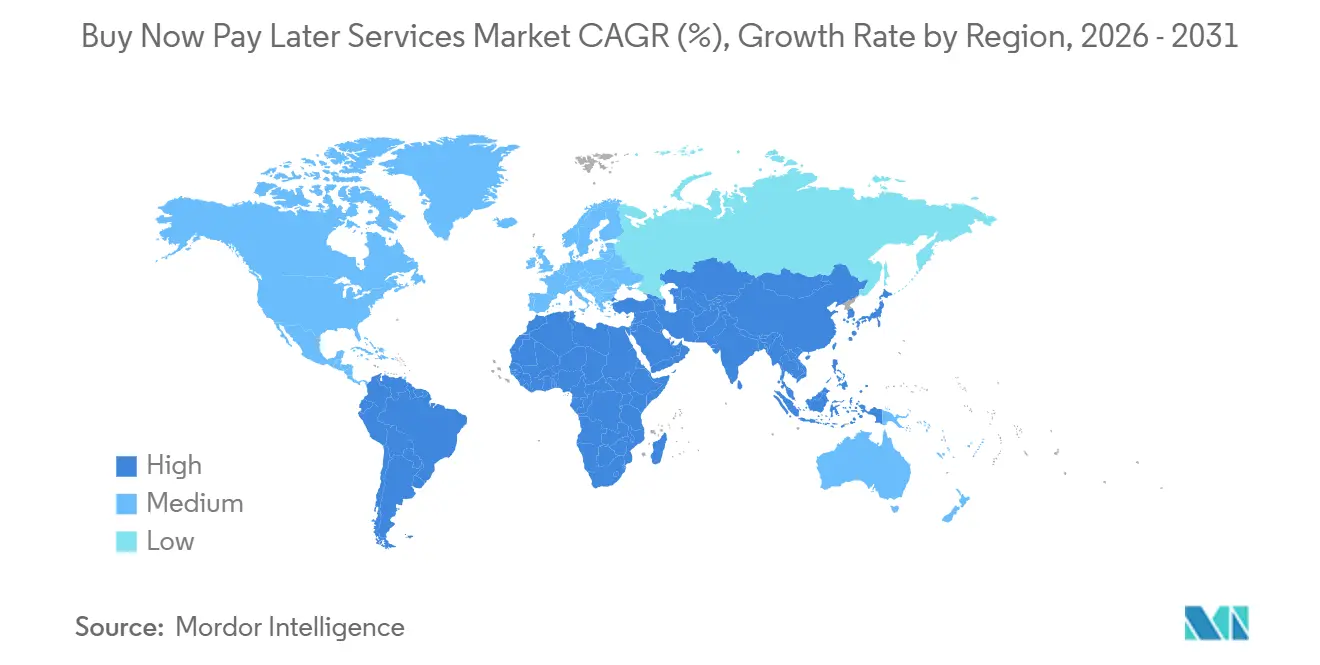
| Fastest Growing Market | Asia Pacific |
| Largest Market | Asia Pacific |
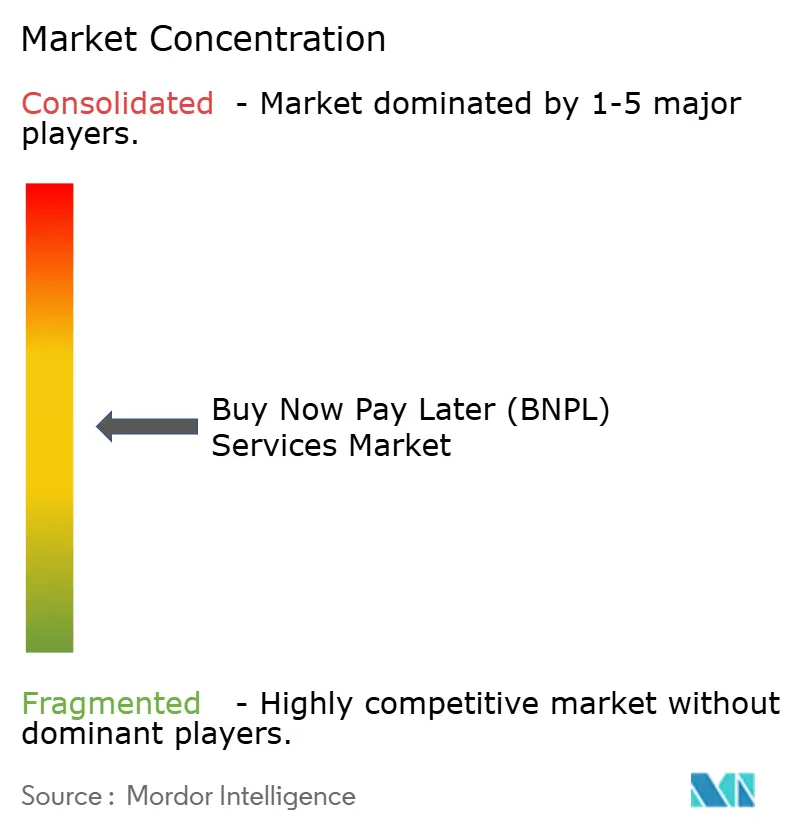
| Market Concentration | Medium |
Major Players *Disclaimer: Major Players sorted in no particular order Image © Mordor Intelligence. Reuse requires attribution under CC BY 4.0. | |
Buy Now Pay Later Services Market Analysis by Mordor Intelligence
The Buy Now Pay Later Services Market size was valued at USD 0.65 trillion in 2025 and is estimated to grow from USD 0.75 trillion in 2026 to reach USD 1.64 trillion by 2031, at a CAGR of 16.76% during the forecast period (2026-2031).
Momentum reflects a shift from a niche checkout add-on to a scaled consumer credit utility that merchants use to lift conversion and average order value while keeping user experience simple at checkout. Tighter underwriting and reporting practices introduced in 2025 help stabilize portfolio performance as leading providers scale, while capital-light funding through forward-flow and similar structures strengthens growth capacity in core markets. Network and issuer collaborations extend acceptance to more points of sale beyond merchant-by-merchant onboarding, which supports omnichannel use cases that bring the buy now pay later services market deeper into everyday spending routines. Regulatory clarity is advancing in major jurisdictions, with the United Kingdom implementing full supervision in 2026, which sets consistent affordability checks and redress mechanisms and raises the sector’s baseline for consumer protections.
Key Report Takeaways
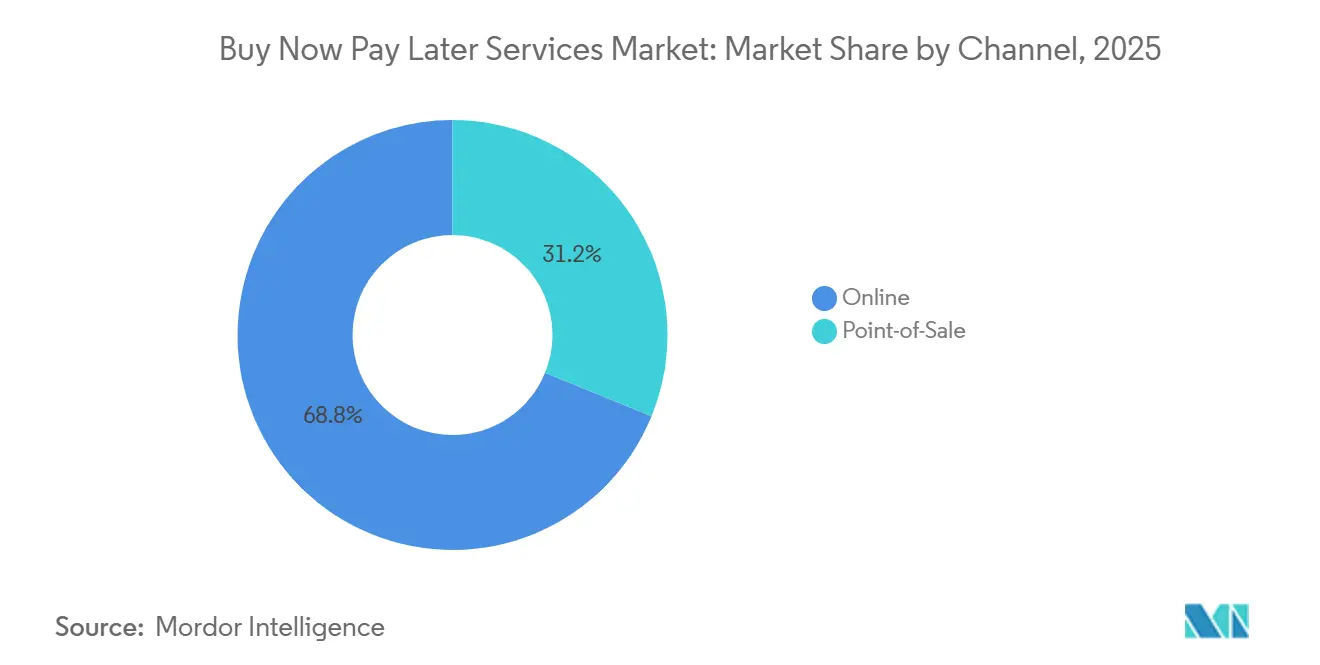
- By channel, online led with 68.84% of the buy now pay later services market share in 2025, while point-of-sale is projected to expand at 24.36% CAGR through 2031 within the buy now pay later services market.
- By end-use industry, retail accounted for 70.42% of the buy now pay later services market share in 2025, and healthcare and wellness are forecast to grow at a 21.73% CAGR to 2031 in the buy now pay later services market.
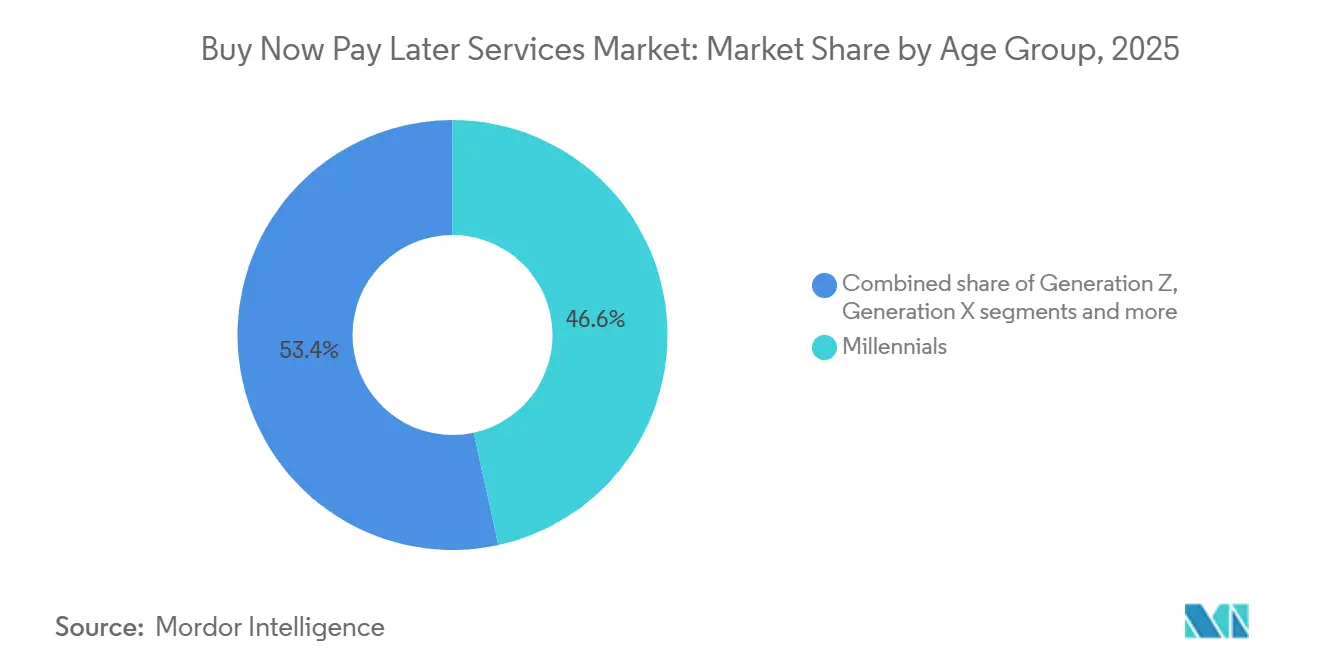
- By age group, Millennials held 46.58% of the buy now pay later services market share in 2025, while Generation Z is expected to post the fastest growth at 24.74% CAGR to 2031.
- By provider, fintechs commanded 58.96% of the buy now pay later services market share in 2025, and banks are projected to grow at a 21.19% CAGR through 2031 in the buy now pay later services market.
- By geography, Asia-Pacific held 35.71% of the BNPL market share in 2025, and it is expected to record the fastest regional growth at 19.48% CAGR to 2031.
Note: Market size and forecast figures in this report are generated using Mordor Intelligence’s proprietary estimation framework, updated with the latest available data and insights as of 2026.
Global Buy Now Pay Later Services Market Trends and Insights
Drivers Impact Analysis*
| Driver | (~) % Impact on CAGR Forecast | Geographic Relevance | Impact Timeline |
|---|---|---|---|
| Rapid embedded-checkout adoption boosts BNPL attach rates | +3.2% | Global, with North America and Europe leading in integration density | Short term (≤ 2 years) |
| BNPL lifts merchant conversion and AOV at scale | +4.1% | Global, strongest in high-ticket categories (electronics, furniture, fashion) | Medium term (2-4 years) |
| Omnichannel expansion (virtual cards, tokens) extends in-store reach | +2.8% | Asia-Pacific core, spillover to North America and Europe | Medium term (2-4 years) |
| Sharper underwriting lowers loss rates without throttling growth | +2.3% | North America, Europe, Australia | Medium term (2-4 years) |
| Private credit, forward-flow, and securitization reopen funding capacity | +3.6% | Global, concentrated in the United States, the United Kingdom, and Germany | Long term (≥ 4 years) |
| Network and issuer partnerships unlock non-integrated acceptance | +2.1% | Global, early gains in the United States, Canada, and select European markets | Long term (≥ 4 years) |
| Source: Mordor Intelligence | |||
Rapid Embedded-Checkout Adoption Boosts BNPL Attach Rates
Embedded checkout has become a standard pattern for presenting installments natively at the point of payment, which reduces friction and reduces the time from selection to approval. Merchant adoption accelerates as API-first providers shorten deployment cycles and unify approval routing across multiple lenders in a single flow, making BNPL activation a low-effort conversion lever. In 2025, embedded finance capabilities that include buy now pay later spread across United States service providers, reflecting a shift from pilot programs to core checkout infrastructure [1]The Galileo FT Editorial Team, “The Next Frontier: Why Embedded B2B Finance Is Breaking Out in 2026,” galileo-ft.com. High attach rates are supported by instant virtual card issuance and tokenization, which preserve authorization speed and reduce decline risk at checkout. Conversion improvements documented by central bank research confirm that BNPL visibility at checkout can raise completed purchases by significant margins, which keeps the buy now pay later services market central to merchant growth planning. As more enterprise platforms offer BNPL natively, attach rates rise without additional clicks or redirects, reinforcing the role of installments in everyday digital shopping journeys across categories.
BNPL Lifts Merchant Conversion and Average Order Value at Scale
The commercial appeal for merchants is grounded in uplift to conversion and average order value when installments are presented clearly at checkout. Consumer surveys show a majority of shoppers are more likely to buy when BNPL is available, which aligns with observed increases in basket sizes across electronics, furniture, and fashion, where ticket values are higher. Empirical evidence from central bank research indicates that merchants offering BNPL can see conversion improvements of up to 30% and meaningful gains in order values, a pattern that repeats during high-traffic retail periods [2]Federal Reserve Bank of Richmond, “Buy Now, Pay Later: Recent Developments and Implications,” richmondfed.org. On a scale, these gains compound across frequent, mid-value purchases, sustaining higher revenue per customer for enterprises with broad SKU assortments. As providers refine how offers surface in the cart and on product pages, merchants improve uplift without adding checkout steps or complexity. These dynamics support durable merchant adoption across both pure-play online retailers and omnichannel brands that want a single conversion-enhancing payment method across channels.
Omnichannel Expansion Through Virtual Cards and Tokenization Extends In-Store Reach
Installments are moving beyond native e-commerce checkout into stores through virtual cards, physical cards, and contactless acceptance at terminals, which expands the buy now pay later services market into card-present settings. Leading providers rolled out Tap to Pay and related features across multiple markets in late 2025, making Pay in 3 or similar short-term options available at terminals that support contactless flows. Card products linked to BNPL accounts add persistent in-store reach, and active user counts expanded sharply through 2025 as shoppers used debit-first cards to access financing after purchase when needed. Network tokenization and issuer-side capabilities unlock acceptance at merchants without direct integrations, which reduces onboarding friction and speeds geographic scaling. Retail peak periods highlight the value of in-person flexibility since larger baskets are common in stores for categories like home improvement and electronics. As omnichannel checkout flows converge, virtual card rails and tokenization keep authorization latency low, enabling consistent experiences that strengthen consumer repeat usage across contexts.
Private Credit, Forward-Flow Agreements, and Securitization Reopen Funding Capacity
Funding models shifted to balance-sheet-light structures that reduce capital intensity and allow steady originations even as interest rates and liquidity conditions change. In 2025, leading providers executed large forward-flow arrangements that purchase newly originated receivables on a rolling basis, adding multi-year capacity to fund short-term installments in core markets. Additional facilities were executed to finance longer-duration products, helping diversify revenue and improve unit economics for interest-bearing offerings at scale. Diversified capacity also includes programs in partnership with insurers and asset managers to fund consumer loan volume year over year. Off-balance-sheet purchases of receivables by asset managers further validate BNPL credit as an investable asset class and allow originators to recycle capital into new growth. With multiple structures live across the United States and Europe, providers can better match funding to product mix, which supports stable expansion of the buy now pay later services market.
Restraints Impact Analysis*
| Restraint | (~) % Impact on CAGR Forecast | Geographic Relevance | Impact Timeline |
|---|---|---|---|
| Tightening BNPL regulation raises compliance costs and friction | -2.4% | United Kingdom, EU member states, New York, Australia | Short term (≤ 2 years) |
| Cost of capital and liquidity cycles pressure unit margins | -1.8% | Global, heightened in markets with rising interest rates | Medium term (2-4 years) |
| Merchant discount fee pushback and return-liability sensitivity | -1.3% | North America and Europe core | Short term (≤ 2 years) |
| Platform-gatekeeper shifts (wallets, OS) reduce direct BNPL visibility | -1.1% | Global, concentrated in mobile-first markets (Asia-Pacific, North America) | Long term (≥ 4 years) |
| Source: Mordor Intelligence | |||
Tightening BNPL Regulation Raises Compliance Cost and Friction
New rules in major markets require affordability checks, clearer disclosures, and access to formal redress, which increases compliance investment and can reduce approval rates at the edges. The United Kingdom confirmed full supervision with requirements that include proportionate creditworthiness assessment and Financial Ombudsman access, with implementation beginning in mid-2026 [3]Financial Conduct Authority, “New protections confirmed for Buy Now Pay Later borrowers,” fca.org.uk. In the European Union, the Consumer Credit Directive II expands consumer credit protections to BNPL, with member state adoption by late 2025 and application in 2026, which will standardize rules across cross-border commerce. Australia’s extension of its credit framework to BNPL in 2025 brings licensing and responsible lending obligations, raising operating thresholds for non-bank providers. These frameworks align BNPL with established consumer protections, which favors providers with strong compliance infrastructure and diversified funding. As oversight expands, product design and marketing will need to adapt to ensure transparency and suitability for different consumer profiles. The net effect is slower onboarding for marginal applicants and higher unit costs in the near term, yet stronger long-run sustainability for the buy now pay later services market.
Merchant Discount Fee Pushback and Return-Liability Sensitivity
Merchants focus on the total economics of BNPL, including discount fees, refund workflows, and the handling of returns, which is especially salient in categories with naturally higher return rates. Providers are testing pricing models and direct API integrations that can improve merchant economics while preserving conversion lift. Banks that offer installment plans over existing acquiring relationships provide an additional route to lower-fee options in some cases, which influences how large merchants allocate volume between fintechs and issuer programs. As regulation aligns BNPL with traditional credit standards, dispute resolution and consumer redress requirements bring more structure to refunds and chargebacks. Merchants that depend heavily on installments diversify providers to manage operational continuity risk, especially around returns and customer support. The result is more active vendor management and pricing negotiation as retailers institutionalize BNPL within payments stacks.
*Our forecasts treat driver/restraint impacts as directional, not additive. The impact forecasts reflect baseline growth, mix effects, and variable interactions.
Segment Analysis
By Channel: Physical Retail Catches Digital’s Momentum
Online commanded 68.84% share in 2025, while point-of-sale is projected to grow at 24.36% CAGR through 2031, signaling an omnichannel shift within the buy now pay later services market. Online’s lead reflects wide embedded checkout availability across large commerce platforms, where activating installments now requires minimal engineering lift and creates immediate conversion benefits. Merchants continue to prioritize speed and clarity at checkout, and BNPL’s clear installment framing supports basket building in discretionary and semi-essential categories. In late 2025, providers enabled contactless in-store acceptance across multiple markets, which narrowed capability gaps between digital and physical checkout. Physical cards tied to BNPL accounts also expanded active users by Q4 2025, supporting everyday spending and raising the frequency of installment use over debit flows. These channels are converging as virtual cards, tokenization, and instant issuance power low-latency authorizations at terminals without complex retailer-specific integrations.
Point-of-sale growth is reinforced by consistent conversion lift seen when BNPL is present in checkout, which sustains merchant demand for in-store acceptance, along with online. Regulatory clarity in the United Kingdom will apply equal protections to online and in-store BNPL from mid-2026, which sets a consistent consumer experience across channels. For merchants, a unified flow with one provider or a small set of providers reduces support costs and simplifies reconciliation. Partnerships across networks and issuers open more card-present acceptance points while embedded APIs at e-commerce platforms speed digital activations, which together anchor the BNPL market size trajectory for both channels. As more brands target seamless omnichannel, POS installments are set to mature alongside online acceptance, with consistent risk controls and funding in place.


By End-Use Industry: Healthcare Surges as Essentials Eclipse Discretionary
Retail accounted for 70.42% of the 2025 sector share, while healthcare and wellness are expected to grow at a 21.73% CAGR through 2031, reflecting a rebalancing toward essential spend within the buy now pay later services market. Retail remains the largest use case given deep roots in fashion, beauty, and electronics, where clear installment options reduce purchase hesitation and lift basket size. Travel and mobility partnerships with leading airlines and platforms broaden addressable use cases for ticketing and bookings across large user bases. As more merchants standardize BNPL as a preferred payment method, the mix of transactions continues to span discretionary and semi-essential categories that benefit from short-term cash flow flexibility. Embedded checkout and merchant-native marketing of installments deepen adoption without compromising checkout speed.
Healthcare and wellness expansion is tied to affordability needs and transparent repayment schedules that help households manage medical, dental, and wellness services. In Saudi Arabia, a large share of users applies BNPL to education and medical expenses, which signals demand for essential spending flexibility in markets where adoption is scaling. Providers with specialized offers for healthcare, veterinary services, and elective procedures are well-positioned as patient financing aligns with predictable installment plans and clear disclosures. Merchants and clinics benefit from higher conversion on larger invoices when financing is offered upfront, which keeps essential categories central to the buy now pay later services market. Platform partnerships and seamless patient journeys will shape acceptance in 2026, while responsible lending standards ensure appropriate use cases for medically necessary services.
By Age Group: Gen Z’s BNPL-First Behavior Accelerates
Millennials held a 46.58% share in 2025, and Generation Z is projected to record the fastest growth at 24.74% CAGR to 2031, reinforcing the demographic tailwinds in the buy now pay later services market. Millennials prioritize cash flow management and convenience, and they respond to clear, fee-transparent schedules that reduce revolving balance risk associated with traditional credit cards. They also interact with BNPL across a wide swath of purchase categories, which broadens the set of merchants that prioritize installments in their payment mix. Younger shoppers are early adopters of mobile-first interfaces and agent-mediated commerce, which concentrates usage among Gen Z as new shopping surfaces emerge. As BNPL data began reporting at scale to credit bureaus in 2025, responsible usage patterns can support future credit access, which improves long-run financial outcomes for these cohorts.
Generation X and older cohorts participate at a slower but steady pace, often concentrating usage in higher-ticket or planned purchases where installments deliver budget certainty. Clear disclosures and hardship support policies remain important for first-time or vulnerable users, and upcoming United Kingdom rules formalize those standards in mid-2026. As merchants and providers fine-tune messaging and reminders, cross-generational engagement improves without sacrificing responsible use. The buy now pay later services industry will continue to segment features and limits by age group and observed repayment to balance access and risk. These demographic dynamics shape marketing, underwriting, and product design choices through 2031.
By Provider: Banks Challenge Fintech Dominance
Fintechs held a 58.96% share in 2025, while banks are expected to grow at a 21.19% CAGR through 2031 as card issuers embed installments and add plan management inside their apps in the buy now pay later services market. A handful of scaled fintechs hold the majority of global BNPL lending, supported by direct merchant integrations, large consumer bases, and funding partnerships. Leading providers executed sizable forward-flow agreements in 2025 to fund Pay in 4 receivables and longer-tenor products, which support sustainable originations without balance sheet strain. Additional capacity from insurers and asset managers extends funding for multi-year periods to support consumer loan volumes.
Banks are scaling their own installment features at checkout and post-purchase, using existing acceptance networks to reduce merchant onboarding time and align fees with acquiring economics. Partnerships with large retailers and e-commerce platforms expand reach while keeping user experiences native to issuer apps. Fintechs also broadened acceptance across merchant platforms in late 2025, including expansions with major furniture and fashion retailers in North America, the United Kingdom, and Canada. These combined moves accelerate mainstream coverage and keep the buy now pay later services market size on a firm upward path through 2031. As regulatory oversight expands, institutions with mature compliance operations may gain incremental share where licensing and capital requirements are higher.
Geography Analysis
Asia-Pacific led with a 35.71% share in 2025 and is expected to post the fastest regional growth at 19.48% CAGR to 2031, reflecting the region’s mobile-first payments, super-app distribution, and QR acceptance density inside the buy now pay later services market. Southeast Asia’s high mobile wallet usage rates create fertile ground for embedded installments, such as networks and issuers' scale tokenization and merchant acceptance. In the Gulf, adoption benefits from supportive frameworks and strong merchant ecosystems, while user registration and essential spend use cases in markets like Saudi Arabia keep engagement growing. As provider partnerships and issuer programs extend coverage in-store and online, Asia-Pacific retains both scale and speed among global regions.
North America maintains a concentrated set of large fintechs and bank programs supported by a robust capital market appetite for receivables, which stabilizes funding for short-term and longer-tenor plans. In late 2025 and early 2026, providers expanded capacity and partnerships that sustain multi-year originations and enterprise integrations across major retail categories. United States growth remains healthy, though more measured than Asia-Pacific, reflecting a higher baseline of penetration and ongoing alignment with evolving state and federal standards. Expanded credit bureau furnishing in 2025 improves risk visibility and portfolio health, which supports consistent scaling in the BNPL market.
Europe advances under harmonized regulations as the Consumer Credit Directive II is adopted and applied from 2026, which sets consistent rules for affordability checks and consumer rights across member states. The United Kingdom’s mid-2026 oversight program drives comprehensive consumer protection and authorization pathways for providers. Several leading providers increased regional capacity and introduced new features in late 2025 and 2026, expanding both their merchant networks and consumer banking capabilities. As adoption expands across the continent, issuer partnerships and tokenized acceptance improve coverage, reinforcing Europe’s role as a core region in the buy now pay later services market.

Competitive Landscape
The buy now pay later services market is moderately fragmented, with a small group of scaled specialists and large banks holding significant shares, but no single dominant leader in 2026. At the top end, leading fintechs account for a large majority of total BNPL lending and continue to expand through merchant integrations, consumer apps, and card-linked experiences. Providers executed large forward-flow and structured finance arrangements in 2025 to increase funding capacity for Pay in 4 receivables and longer-duration products, adding stability to originations. Additional capacity from asset managers and insurers further diversified funding and supported multi-year consumer loan volume plans. Product innovation continues around post-purchase plan creation, contactless in-store acceptance, and banking services inside consumer apps that extend value beyond checkout.
Strategic moves in Q4 2025 and early 2026 focused on omnichannel and international expansion. Providers introduced Tap to Pay across multiple markets to unify online and in-store experiences and enable installment payments at terminals with contactless capabilities. Partnerships with leading merchants and platforms in furniture, fashion, and general retail expanded acceptance and introduced installments to broader customer sets in the United Kingdom and Canada, alongside the United States. Technology investments included agent-friendly payment protocols and peer-to-peer features within consumer apps, which broaden provider roles from payment option to full-service digital banking for everyday spending. As these capabilities come online, providers gain a larger share of wallet in the buy now, pay later services market.
Regulation shapes competitive positioning by setting licensing and consumer protection baselines that favor larger, well-capitalized firms with mature compliance organizations. The United Kingdom’s oversight and Europe’s harmonized rules clear uncertainty and level standards across borders for affordability checks and redress. Funding strength, embedded coverage in merchants and platforms, and robust consumer app engagement will be decisive as banks scale offerings and fintechs deepen omnichannel acceptance. Partnerships that leverage issuer rails and tokenization help all players reach more merchants faster, solidifying the presence of installments in digital and physical checkout flows. With capital programs in place and regulatory pathways clearer, the field remains competitive yet disciplined as it scales responsibly into 2031.
Buy Now Pay Later Services Industry Leaders
PayPal Holdings Inc.
Klarna
Afterpay (Block)
Affirm
Zip Co
- *Disclaimer: Major Players sorted in no particular order

Recent Industry Developments
- March 2026: Klarna, a global digital bank and payments provider, expanded its embedded resale integration with eBay to six new markets like Australia, Belgium, Canada, Ireland, Poland, and Switzerland—enhancing circular commerce and enabling seamless resale of financed pre-owned goods via streamlined app functionality.
- March 2026: Klarna partnered with Stripe to enhance its agentic commerce capabilities, enabling seamless integration of Klarna payments into AI-driven shopping platforms. This collaboration reflects the evolving e-commerce landscape, where payment systems must adapt to support AI-influenced purchasing securely and flexibly.
- February 2026: Affirm extended its collaboration with Wayfair to offer its transparent financial solutions in the United Kingdom and Canada, enabling approved shoppers to split payments without hidden fees, late charges, or compounding interest, ensuring customer-centric flexibility.
- September 2025: PayPal and Blue Owl Capital have formalized a two-year agreement, enabling Blue Owl's managed funds to acquire approximately USD 7 billion in United States Pay in 4 buy now, pay later receivables, while PayPal retains responsibility for underwriting, servicing, and customer-facing operations.


Research Methodology Framework and Report Scope
Market Definitions and Key Coverage
Our study defines the global buy-now-pay-later (BNPL) services market as the total gross merchandise value of consumer purchases settled through short-term, interest-free or low-interest installment plans that are issued at checkout, both online and in store, and settled directly by specialized fintechs or licensed banks. This definition embraces every retail and service vertical, from fashion to elective healthcare, wherever the payment promise is split into four or more scheduled installments.
Exclusions include revolving credit cards, payroll-linked salary advances, traditional installment loans exceeding three years, and pure B2B invoice-financing products, which sit outside our scope.
Segmentation Overview
- By Channel
- Online
- Point-of-Sale (In-store)
- By End-Use Industry
- Consumer Electronics
- Fashion & Apparel
- Healthcare & Wellness
- Home Improvement
- Travel & Leisure
- Media & Entertainment
- Other End-Use Industries
- By Age Group
- Generation Z (18-28 Years)
- Millennials (29-44 Years)
- Generation X (45-60 Years)
- Baby Boomers (61-79 Years)
- Silent Generation (80 Years and Above)
- By Provider
- Fintechs
- Banks
- Others
- By Region
- North America
- United States
- Canada
- Mexico
- South America
- Brazil
- Argentina
- Chile
- Peru
- Rest of South America
- Europe
- United Kingdom
- Germany
- France
- Spain
- Italy
- Benelux (Belgium, Netherlands, and Luxembourg)
- Nordics (Sweden, Norway, Denmark, Finland, and Iceland)
- Rest of Europe
- Asia-Pacific
- China
- India
- Japan
- South Korea
- Australia
- South-East Asia (Singapore, Indonesia, Malaysia, Thailand, Vietnam, and Philippines)
- Rest of Asia-Pacific
- Middle East and Africa
- United Arab Emirates
- Saudi Arabia
- South Africa
- Nigeria
- Rest of Middle East and Africa
- North America
Detailed Research Methodology and Data Validation
Primary Research
Mordor analysts spoke with BNPL executives, retail finance heads, payment-gateway integrators, and consumer-protection officials across North America, Europe, the Gulf, and Asia-Pacific. These interviews validated penetration ratios, average ticket sizes, and regulatory assumptions that were only partially visible in documents.
Desk Research
We began with payment statistics from central banks and regulators such as the Federal Reserve, the European Banking Authority, and the Reserve Bank of Australia, then layered consumer-finance surveys issued by the CFPB and the World Bank. Trade bodies including the Electronic Transactions Association and ecommerce chambers supplied channel-level penetration clues, while customs data helped spot point-of-sale roll-outs across emerging markets. Company filings, IPO prospectuses, and investor decks were screened through D&B Hoovers and Dow Jones Factiva to capture merchant fees, loss rates, and late-fee policies. These publicly available and paid-database insights formed the documentary backbone; many additional secondary sources were referenced for data checks and narrative clarity.
Market-Sizing & Forecasting
We apply a top-down reconstruction of BNPL-eligible spend. Retail and services turnover by country is multiplied by digital-checkout share and then by verified BNPL penetration to yield 2024 baselines. Select bottom-up roll-ups of provider volumes in the United States, Australia, and India serve as plausibility guardrails before figures are finalized. Key model variables include smartphone adoption, merchant discount rates, default ratios, regulatory fee caps, and average installment length; shifts in these levers guide scenario testing. Forecasts to 2030 rely on multivariate regressions blended with ARIMA smoothing, with coefficient ranges vetted by our primary-research panel. Gap pockets in bottom-up data are filled through region-specific ASP × volume heuristics.
Data Validation & Update Cycle
Outputs face multi-layer variance checks, peer review, and senior sign-off. Models refresh each year, yet interim recalculations are triggered by material events, for example, a new interchange cap or a major provider exit, so clients receive the latest vetted baseline before every delivery.
Why Mordor's Buy Now Pay Later (BNPL) Market Baseline Commands Reliability
Published estimates often diverge because firms pick different value bases, channels, and refresh rhythms.
Key gap drivers include whether the figure tracks gross transaction value or provider revenue, the inclusion of in-store finance, and how quickly new verticals such as healthcare are folded in. Mordor's disciplined scope, yearly refresh, and dual-track validation narrow these gaps.
Benchmark comparison
| Market Size | Anonymized source | Primary gap driver |
|---|---|---|
| USD 0.64 Trn (2025) | Mordor Intelligence | |
| USD 11.87 Bn (2025) | Global Consultancy A | Measures provider fee income only and omits in-store programs |
| USD 37.19 Bn (2024) | Industry Consultancy B | Limits scope to online retail and reports revenue, not merchandise value |
Taken together, the comparison shows that once differences in value basis, channel mix, and update cadence are neutralized, Mordor's balanced, transparent approach offers decision-makers the most reproducible starting point.


Key Questions Answered in the Report
What is the global size and growth outlook for the buy now pay later services market to 2031?
The buy now pay later services market size is USD 0.65 trillion in 2025, USD 0.75 trillion in 2026, and is forecast to reach USD 1.64 trillion by 2031 at 16.76% CAGR over 2026-2031.
Which region leads adoption and growth in the buy now, pay later services market?
Asia-Pacific leads with 35.71% share in 2025 and is expected to grow at 19.48% CAGR through 2031, supported by mobile-first payments and super-app distribution.
Which channels are driving growth in the buy now, pay later services market?
Online holds 68.84% share in 2025, while point-of-sale is projected to grow at 24.36% CAGR to 2031 as contactless features and virtual cards extend in-store reach.
Who are the most influential provider groups in the buy now, pay later services market?
Fintechs hold a 58.96% share in 2025, while banks are the fastest-growing provider cohort at 21.19% CAGR as they embed installments in card programs.
Which end-use category is growing fastest in the buy now, pay later services market?
Healthcare and wellness are projected to grow at a 21.73% CAGR through 2031 as essential services use cases expand alongside retail's scale.
How will regulation affect the buy now, pay later services market?
United Kingdom, EU, and Australia frameworks increase compliance costs and require affordability checks, which may slow marginal approvals near term but improve long-run sustainability.
Page last updated on:


