In Silico Clinical Trials Market Size and Share
Market Overview
| Study Period | 2020 - 2031 |
|---|---|
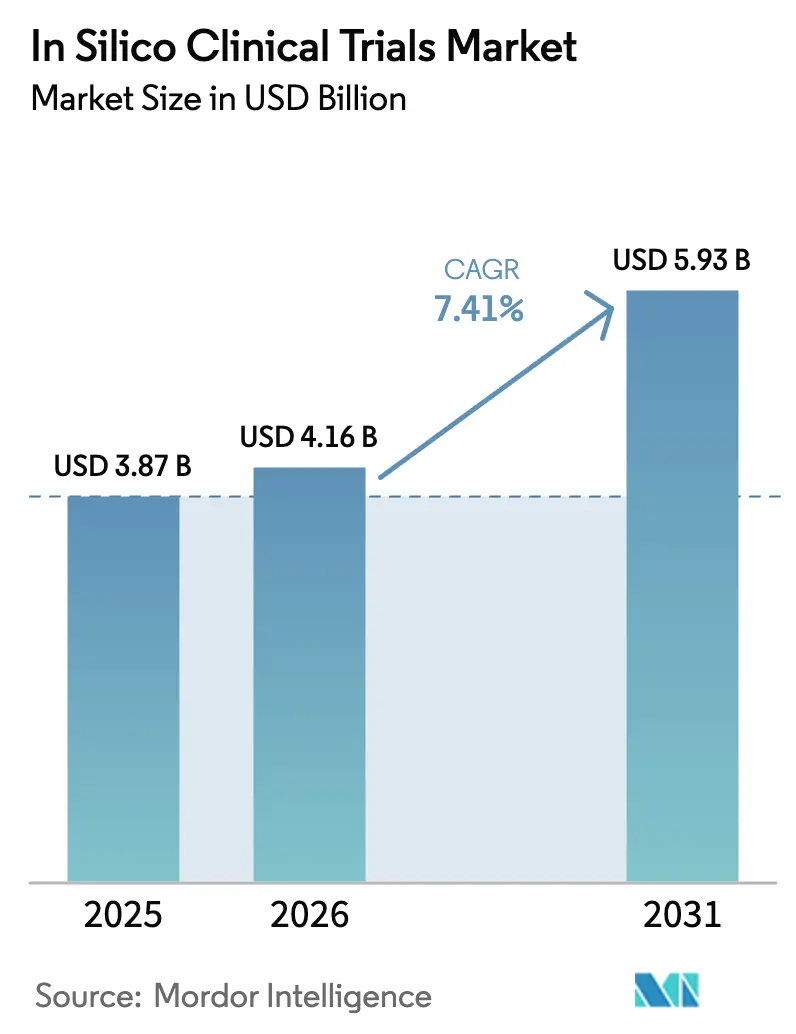
| Market Size (2026) | USD 4.16 Billion |
| Market Size (2031) | USD 5.93 Billion |
| Growth Rate (2026 - 2031) | 7.41% CAGR |
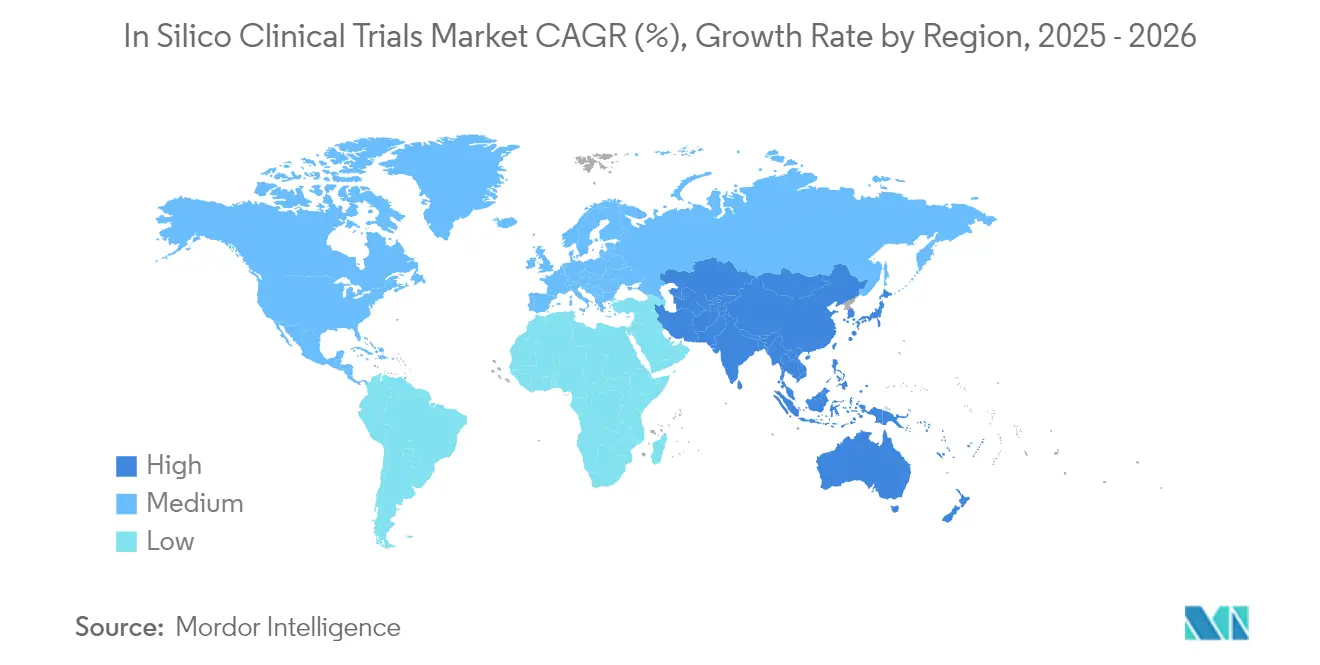
| Fastest Growing Market | Asia-Pacific |
| Largest Market | North America |
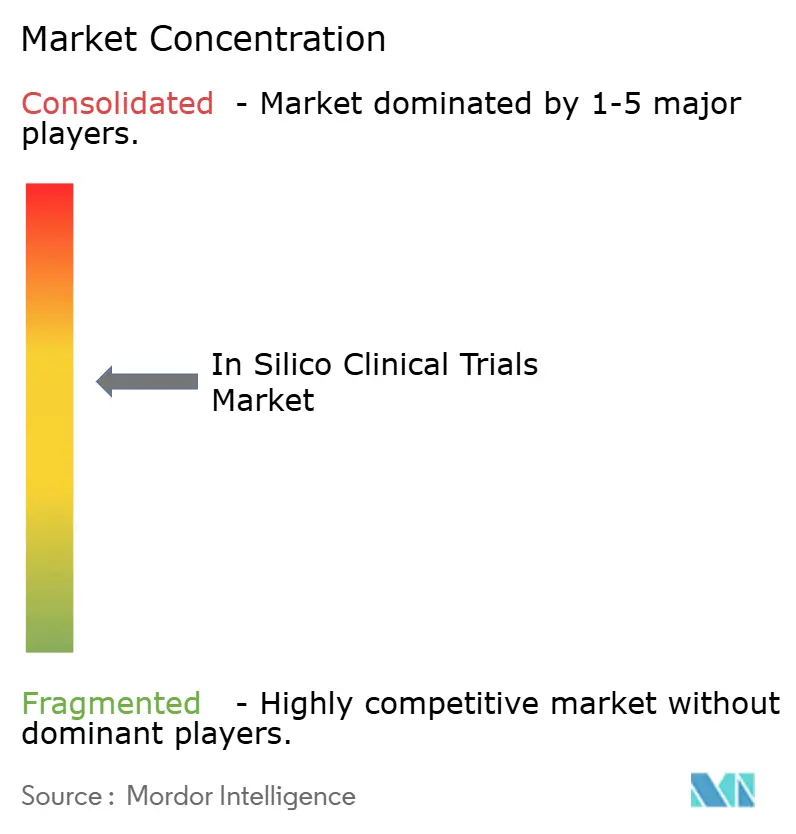
| Market Concentration | Medium |
Major Players *Disclaimer: Major Players sorted in no particular order Image © Mordor Intelligence. Reuse requires attribution under CC BY 4.0. | |
In Silico Clinical Trials Market Analysis by Mordor Intelligence
In-silico clinical trial market size in 2026 is estimated at USD 4.16 billion, growing from 2025 value of USD 3.87 billion with 2031 projections showing USD 5.93 billion, growing at 7.41% CAGR over 2026-2031. Regulatory agencies on both sides of the Atlantic have begun to accept virtual evidence packets, enabling sponsors to replace or complement animal studies with high-fidelity computational models[1]U.S. Food and Drug Administration, “Modernization of Animal Testing for Biologics,” fda.gov. Cost pressures across pharmaceutical pipelines further accelerate adoption, because validated digital twins shorten development cycles and lower protocol amendments. The sustainability agenda, including the United States move to phase out animal testing for certain biologics, reinforces the shift toward simulated trials. Greater cloud, GPU and high-performance computing accessibility now lets mid-sized biotechnology firms run complex multi-omics models once reserved for large pharma. Precision-medicine programs that rely on patient-specific digital replicas provide an additional tail-wind, particularly in oncology and neurology where response variability is high.
Key Report Takeaways
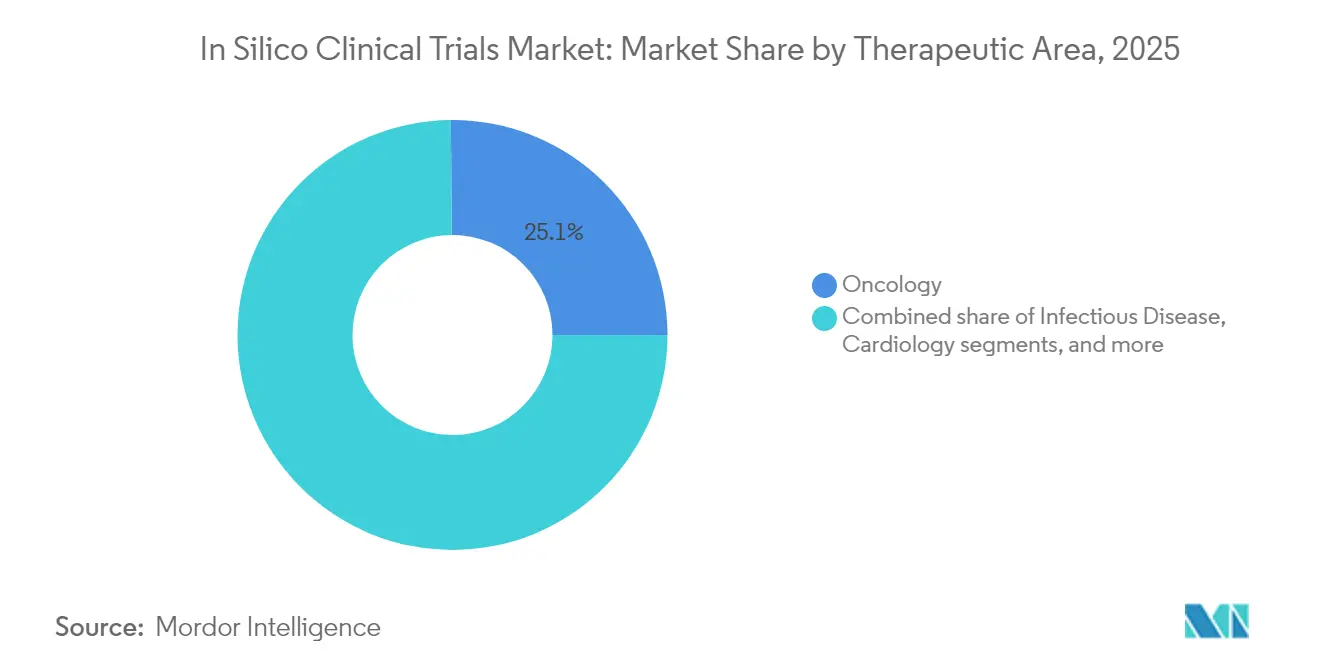
- By therapeutic area, oncology commanded 25.12% of the in-silico clinical trial market share in 2025, while neurology is projected to expand at a 15.11% CAGR through 2031.
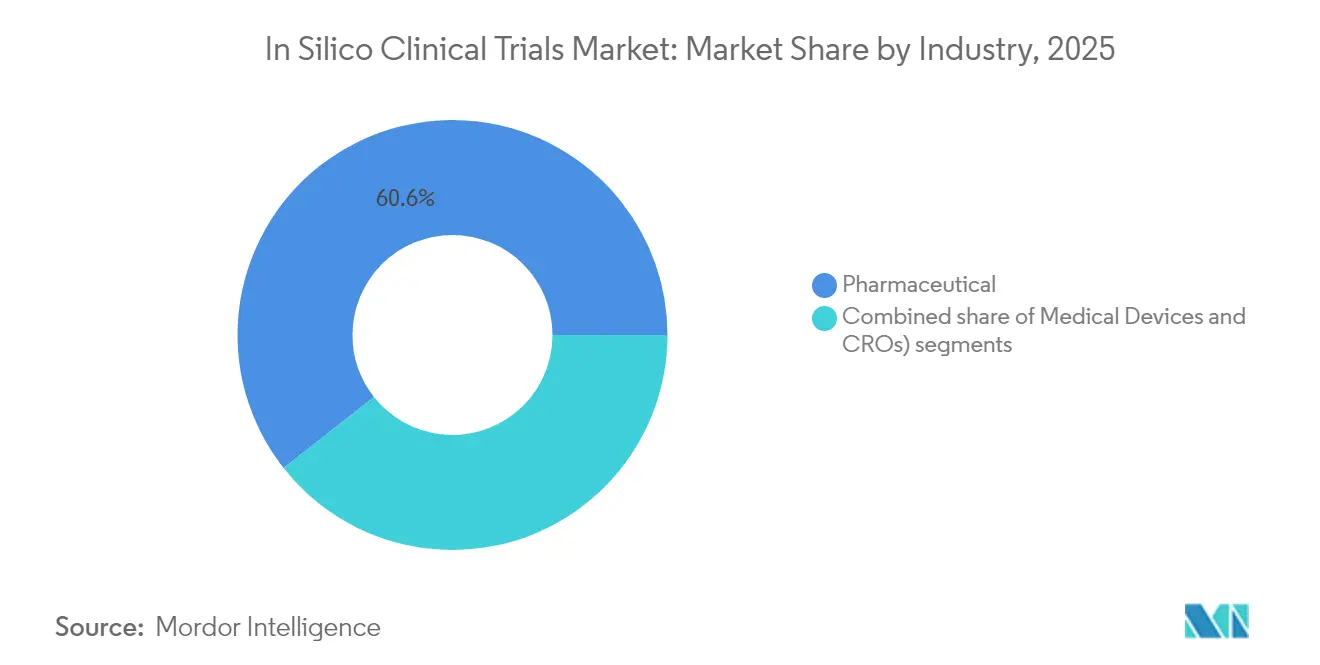
- By industry, the pharmaceutical segment held 60.62% share of the in-silico clinical trial market size in 2025; the medical-device segment is set to rise at a 13.96% CAGR to 2031.
- By phase, Phase II applications accounted for 34.32% of the in-silico clinical trial market size in 2025, whereas Phase I is poised for the fastest 13.52% CAGR to 2031 nature.com.
- By geography, North America led with 46.21% share of the in-silico clinical trial market in 2025, while Asia-Pacific is forecast to grow at 12.45% CAGR during the outlook period.
Note: Market size and forecast figures in this report are generated using Mordor Intelligence’s proprietary estimation framework, updated with the latest available data and insights as of 2026.
Global In Silico Clinical Trials Market Trends and Insights
Drivers Impact Analysis*
| Driver | % Impact on CAGR Forecast | Geographic Relevance | Impact Timeline |
|---|---|---|---|
| Regulatory endorsement of in-silico evidence | +2.0% | North America and Europe lead; global ripple effect | Medium term (2-4 years) |
| Rising R&D cost pressure across pharma and med-tech | +1.8% | Strongest in United States; evident worldwide | Short term (≤ 2 years) |
| Pandemic-induced digital transformation in clinical development | +1.3% | Global, with rapid uptake in Asia-Pacific | Short term (≤ 2 years) |
| Accelerating adoption of precision medicine and digital twins | +1.6% | North America and Europe core; expanding in Asia-Pacific | Medium term (2-4 years) |
| Growing HPC and cloud-computing accessibility | +0.9% | Developed markets worldwide | Long term (≥ 4 years) |
| Sustainability mandates and 3R animal-reduction policies | +1.2% | Europe first mover; North America following; APAC emerging | Medium term (2-4 years |
| Source: Mordor Intelligence | |||


Regulatory Endorsement of In-Silico Evidence
The United States Food and Drug Administration recently broadened its computational modeling guidance, confirming that verified virtual evidence can support device 510(k) and biologic IND filings. European lawmakers echo the approach through the European Health Data Space Regulation, which enables cross-border data flows essential for large-scale virtual cohorts. Early applicants that submitted AI-generated dossiers reported shorter review cycles, signalling that regulators view model-based submissions as resource-efficient. Industry now invests in end-to-end validation workflows anchored in ASME V&V 40 principles, providing a repeatable route to credibility. As multiple jurisdictions converge on harmonised rules, sponsors gain confidence to allocate larger budgets to in-silico trial design.
Rising R&D Cost Pressure Across Pharma and Med-Tech
Total R&D expense required to bring a single novel drug to market has climbed above USD 1 billion, a 14-fold increase versus the 1960s. Companies respond by redirecting funds toward digital twin platforms that can simulate dose-response curves across thousands of virtual patients, cutting wet-lab screening cycles by up to 70%. Large pharma-device partnerships such as Charles River Laboratories and Sanofi demonstrate cost avoidance through virtual control groups, reducing animal use while maintaining statistical power. Medical-device manufacturers follow suit because computational stress testing eliminates multiple prototype iterations. Combined, these economics add more than a full percentage point to operating margins for early adopters.
Pandemic-Induced Digital Transformation in Clinical Development
COVID-19 compressed a decade of digital-trial innovation into two years, normalising remote data capture and hybrid site-less designs. The installed base of electronic patient-reported outcome tools and connected sensors now feeds real-time data streams into simulation engines, closing the loop between virtual models and physical outcomes. Governments in Japan and Singapore updated telehealth and e-consent rules, making it easier for sponsors to draw on region-wide patient pools. This infrastructure acts as a launch-pad for fully computational arms, because clean, structured data are readily available for model training and external validation.
Accelerating Adoption of Precision Medicine and Digital Twins
Stanford Medicine achieved an 85% predictive accuracy rate when simulating neuronal responses with an AI-enabled brain digital twin. Oncology institutions translate the same framework to tumour-specific avatars that test combination therapy safety before first-in-patient dosing. Mayo Clinic reports that cardiovascular digital twins reduce hospital readmissions by modelling device-tissue interactions ahead of surgery. As multi-omics datasets merge with electronic health records, sponsors gain a systems-biology view that drives targeted therapy development, underscoring why precision medicine is a structural driver.
Growing HPC and Cloud Computing Accessibility
Global cloud providers now offer exascale GPU clusters on a pay-per-use basis, letting small biotechnology firms run 100-million-cell agent-based simulations in days rather than months. Open-source libraries standardise model exchange formats, and marketplace APIs integrate seamlessly with eClinical software. The democratisation of compute capacity removes a historical entry barrier and supports the long-term growth trajectory.
Sustainability Mandates and 3R Animal-Reduction Policies
Europe’s 3R legislative agenda, reinforced by Germany’s 2024 Medical Data Integration Center initiative, obliges life-science companies to prioritise non-animal testing alternatives[2]ALTEX, “EU Progress on 3R Alternatives,” altex.org. AstraZeneca reported a 25% decrease in clinical trial carbon emissions after embedding virtual arms into Phase II oncology studies. These public commitments spur peers to adopt digital twins to meet environmental targets.
Restraints Impact Analysis*
| Restraint | % Impact on CAGR Forecast | Geographic Relevance | Impact Timeline |
|---|---|---|---|
| Limited standardization of modeling methodologies | -1.4% | Global, fragmented rules across agencies | Medium term (2-4 years) |
| Data privacy and interoperability challenges | -1.1% | Europe leads privacy focus; worldwide interoperability gap | Short term (≤ 2 years) |
| Insufficient validation frameworks across regions | -1.0% | Varies by regulator; acute in emerging markets | Medium term (2-4 years) |
| Talent shortage in quantitative systems pharmacology | -0.8% | Global, most severe in small-to-mid biotech | Long term (≥ 4 years) |
| Source: Mordor Intelligence | |||
Limited Standardisation of Modelling Methodologies
Regulatory agencies encourage verification but have yet to agree on a single global framework. Sponsors therefore build parallel validation packages for the FDA, EMA and Japan’s PMDA, inflating timelines. While ASME V&V 40 and the TRIPOD+AI guideline provide structure, implementation varies by therapeutic area, forcing bespoke parameter checks for each filing. Smaller biotechnology firms find the resource burden heavy, which slows broader market penetration until harmonised assessment tools mature.
Data Privacy and Interoperability Challenges
GDPR interprets clinical-trial consent narrowly, creating uncertainty over secondary use of patient data in models. Hospitals employ heterogeneous record formats that undermine data pooling, prompting costly ETL pipelines. Federated-learning pilots in oncology demonstrate secure alternatives, yet high compute overhead and complex governance frameworks still deter many sponsors. Continued evolution of common models such as OMOP and FHIR will be required before seamless cross-border data flow becomes routine.
*Our forecasts treat driver/restraint impacts as directional, not additive. The impact forecasts reflect baseline growth, mix effects, and variable interactions.
Segment Analysis
By Therapeutic Area: Oncology Leadership Drives Innovation
Oncology held 25.12% of the in-silico clinical trial market in 2025, reflecting its dependence on multi-drug regimens that benefit from dose-optimisation in silico. The segment gains additional momentum from tumour genetic heterogeneity, which requires large synthetic cohorts to achieve statistical power. The in-silico clinical trial market size for oncology is projected to reach USD 1.71 billion by 2031, tracking a 6.78% CAGR as digital twins guide adaptive designs. Neurology is the fastest-growing discipline at a 15.11% CAGR, driven by Stanford’s visual-cortex digital twin that enables unlimited virtual experimentation. Beyond these two areas, infectious-disease models use AI to repurpose antivirals quickly, cardiology twins refine device implantation strategies, and metabolic-disease avatars personalise insulin and GLP-1 dosing.
Demand for virtual oncology stacks encourages CROs to develop oncology-specific libraries of immuno-genomic profiles, reducing time to model calibration. Neurology providers leverage data from brain-organoid experiments to increase biological fidelity, making virtual neuro-pharmacology more predictive. Together, these two therapeutic areas set the pace for future regulatory templates and commercial reimbursement frameworks.


By Industry: Pharmaceutical Dominance Meets Device Innovation
Pharmaceutical companies captured 60.62% of the in-silico clinical trial market share in 2025, reflecting long-standing PK-PD modelling expertise and budgets that support proprietary platform builds. The in-silico clinical trial market size for medical-device developers is forecast to expand at 13.96% CAGR to 2031 as virtual bench tests replace physical prototypes for orthopaedic implants and cardiovascular stents. CRO partnerships proliferate because smaller biotech firms prefer outsourcing model development and regulatory write-ups. De-risked cost structures and faster first-patient-in timelines make in-silico proposals attractive during Series A fundraising rounds.
Device companies gain particular value when testing patient-specific implants. The FDA’s approval of the restor3d Total Talus Replacement, created from patient CT data, confirms that computational design meets safety thresholds. As CAD programs merge with finite-element models and clinical data, in-silico validation becomes a mainstream route to clearance.
By Phase: Early-Stage Innovation Accelerates
Phase II applications constituted 34.32% of deployments in 2025, because virtual cohorts excel at powering efficacy-driven dose selection. Sponsors report that synthetic control arms reduce enrolment by 20% without compromising significance. Phase I usage is rising fastest at 13.52% CAGR, buoyed by AI-designed compounds that carry pre-computed toxicity profiles into first-in-human studies. The in-silico clinical trial market size dedicated to Phase I could surpass USD 579 million by 2031 as regulators phase out animal testing for monoclonal antibodies. Phase III and IV efforts remain exploratory, mainly focusing on long-term safety extrapolation and post-market device surveillance with real-world data feeds.
Acceleration at the earliest phase reflects a philosophical shift toward design-make-test cycles that minimise late-stage attrition. Quantum computing prototypes promise further gains by solving highly complex Schrödinger equations faster, paving the way for ultra-high-resolution safety modelling.
Geography Analysis
North America retained 46.21% share in 2025 thanks to clear FDA guidance, extensive venture capital and strong supercomputing infrastructure. Recursion, Tempus and Insilico Medicine each raised nine-figure rounds to scale drug-discovery digital twins, reflecting investor confidence. The agency’s plan to discontinue animal tests for certain biologics accelerates local demand, and academic hubs from Boston to the Bay Area serve as technology incubators. Canada supports the ecosystem with national AI superclusters that subsidise compute credits for health-tech startups.
Asia-Pacific is the fastest-growing region, expected to log a 12.45% CAGR through 2031. China’s central government prioritises AI drug discovery under its latest Five-Year Plan, and Insilico Medicine secured USD 110 million Series E funding to expand Shanghai-based operations. Japan’s PMDA issued guidance that aligns with FDA model-validation tenets, streamlining dual submissions for global sponsors. Korea and Taiwan leverage robust electronic health-record penetration to furnish de-identified data for real-world model tuning. Overall, favourable reimbursement reforms and large treatment-naïve patient pools make the region an attractive site for hybrid trials that merge digital twins with streamlined physical arms.
Europe advances steadily, supported by the European Health Data Space initiative that will open anonymised registries across member states. Germany’s Medical Data Integration Center now connects 34 university hospitals, giving researchers access to a federated repository for cardiac, oncology and rare disease datasets. Sustainability and 3R ambitions add non-economic drivers; the Netherlands already mandates virtual evidence for high-risk device revisions when validated models exist. UK regulators, post-Brexit, pilot an agile review service for AI-augmented dossiers, aiming to recapture clinical-research leadership. Together these moves solidify Europe as the second-largest regional cluster for in-silico clinical trial adoption.

Competitive Landscape
The market shows moderate concentration, with an active M&A cycle aimed at building integrated discovery-to-validation stacks. Recursion’s USD 688 million merger with Exscientia combined complementary phenotypic-screening and generative-chemistry engines to create a vertically integrated platform. Platform players pursue dual strategies: securing exclusive pharma partnerships while maintaining a SaaS model for long-tail biotech customers. Entry barriers rise around validated data assets more than proprietary algorithms, so firms with large multimodal datasets enjoy durable advantages.
Strategic partnerships dominate competitive dynamics. Tempus AI’s purchase of Deep 6 AI enhances natural-language processing to locate protocol-eligible patients in electronic records, reducing recruitment lags. Harbour BioMed works with Insilico Medicine to apply generative AI to antibody discovery, a template other mid-cap biopharma companies follow to extend pipelines without internal modelling teams. CROs expand in-silico offerings, with Worldwide Clinical Trials partnering with Medidata to couple eSource capture with virtual-patient simulators. These alliances indicate a shift from siloed technology to ecosystem playbooks.
Disruptors target niche pain points. Quantum-simulation startups provide femtosecond-scale molecular-dynamics models that promise to solve edge-case toxicity issues. Federated-learning vendors tackle privacy roadblocks by letting hospitals train models locally while sharing only gradients. As the regulatory landscape clarifies, differentiation will rely on documented model accuracy and audit trails rather than black-box novelty. Over time, the field is likely to coalesce around a handful of credentialed platforms interoperating through open standards.
In Silico Clinical Trials Industry Leaders
Dassault Systèmes
Certara
InSilicoTrials Technologies
Novadiscovery
Insilico Medicine
- *Disclaimer: Major Players sorted in no particular order

Recent Industry Developments
- March 2025: Tempus AI acquired Deep 6 AI to integrate real-time EMR analytics and enhance clinical-trial patient matching.
- February 2025: Harbour BioMed partnered with Insilico Medicine to accelerate AI-powered antibody discovery across immunology and oncology pipelines.
- January 2025: Absci and Owkin announced a generative-AI alliance covering target selection and molecule design in immuno-oncology.
- December 2024: Insilico Medicine received a USD 10 million milestone payment from Exelixis for AI-designed USP1 inhibitor XL309 entering Phase I trials.
- August 2024: Recursion closed its USD 688 million merger with Exscientia, forming a consolidated AI-driven drug-discovery platform.


Research Methodology Framework and Report Scope
Market Definitions and Key Coverage
Our study defines the in-silico clinical trials market as all revenue generated when sponsors or contract partners deploy software platforms or specialized service contracts that build, validate, and run virtual patient cohorts to test safety or efficacy during clinical Phases I through IV. The modeled tools blend mechanistic models, agent-based simulations, and AI-driven digital twins that help shrink cycle times and trim R&D risk.
Scope Exclusion: pure in-silico drug-discovery suites and pre-clinical-only modeling workflows fall outside the boundary we investigate.
Segmentation Overview
- By Therapeutic Area
- Oncology
- Infectious Disease
- Cardiology
- Neurology
- Diabetes
- Other Therapeutic Areas
- By Industry
- Pharmaceutical
- Medical Devices
- Contract Research Organisations (CROs)
- By Phase
- Phase I
- Phase II
- Phase III
- Phase IV & Post-Market
- Geography
- North America
- United States
- Canada
- Mexico
- Europe
- Germany
- United Kingdom
- France
- Italy
- Spain
- Rest of Europe
- Asia-Pacific
- China
- Japan
- India
- Australia
- South Korea
- Rest of Asia-Pacific
- Middle East & Africa
- GCC
- South Africa
- Rest of Middle East & Africa
- South America
- Brazil
- Argentina
- Rest of South America
- North America
Detailed Research Methodology and Data Validation
Primary Research
Mordor analysts interviewed software providers, CRO methodologists, and sponsor digital-trial leads across North America, Europe, and Asia. These discussions clarified license fee bands, validated cohort-build timelines, and surfaced region-specific regulatory pinch points that publications rarely flag.
Desk Research
We began with public datasets such as ClinicalTrials.gov, the European Clinical Trials Register, and recent FDA Computational Modeling guidance that anchor trial counts and reveal regulatory momentum. Trade groups including PhRMA and MedTech Europe offer annual R&D benchmarks, while open-access journals in systems biology chart failure-rate curves that signal adoption speed. Company filings and press releases gathered through Dow Jones Factiva, plus revenue snapshots from D&B Hoovers, let us cross-check contract values and segment splits.
A follow-up scan converts raw signals into model-ready series; import-export manifests on Volza show device makers embracing simulation, and Questel patent families map the cadence of algorithm innovation. The sources listed here are illustrative, and many additional databases and gray literature feeds informed our desk work.
Market-Sizing & Forecasting
We blend one top-down frame with selective bottom-up checks. The top-down layer starts with the global count of active Phase I-IV studies, multiplies by average simulation spend per trial, and adjusts for penetration rates by industry and therapy area. Supplier roll-ups, sampled contract ledgers, and channel checks act as bottom-up sense tests that refine totals. Key variables include sponsor R&D outlays, FDA and EMA guidance milestones, oncology trial volumes, and digital-twin patent filings. A multivariate regression projects these drivers to 2030, with scenario analysis gauging fast and slow regulatory uptake.
Data Validation & Update Cycle
Model outputs pass anomaly scans against historic spend corridors and peer estimates before senior review. Reports refresh every twelve months, and we trigger interim updates after material events, ensuring clients receive our latest view.
Why Mordor's In Silico Clinical Trials Baseline Commands Reliability
Published estimates diverge because firms choose distinct scopes, pricing ladders, and refresh cycles, and we openly map each choice so users can trace every figure.
Key gap drivers include the inclusion of discovery software by some publishers, the medical-device-only focus of others, and frozen exchange rates that ignore recent currency swings.
Benchmark comparison
| Market Size | Anonymized source | Primary gap driver |
|---|---|---|
| USD 3.87 B | Mordor Intelligence | - |
| USD 3.85 B | Global Consultancy A | excludes pharmaceutical simulation spend and relies on historical average growth |
| USD 3.77 B | Trade Journal B | omits Asia-Pacific revenue and holds exchange rates at research start |
The comparison shows that Mordor's disciplined scope selection, variable tracking, and annual refresh provide a balanced, transparent baseline that decision-makers can depend on.


Key Questions Answered in the Report
How large is the in-silico clinical trial space today and where is it heading?
The segment was valued at USD 4.16 billion in 2026 and is projected to reach USD 5.93 billion by 2031, advancing at a 7.41% CAGR.
Which therapeutic area currently generates the greatest revenue?
Oncology contributes the most, accounting for 25.12% of 2025 revenues because complex combination regimens gain high predictive value from virtual patient simulations.
Why are Phase I virtual studies gaining traction so quickly?
The FDA decision to phase out animal toxicology tests for monoclonal antibodies lets AI-designed compounds enter first-in-human studies with computational safety profiles, driving a 13.52% CAGR for Phase I applications through 2031.
What is the primary regulatory catalyst behind adoption?
Formal FDA guidance that accepts verified virtual evidence for device 510(k) and biologic IND submissions provides clarity and lowers traditional barriers to investment in computational modelling.
Which region is expanding at the fastest rate?
Asia-Pacific is forecast to grow at 12.45% CAGR as China, Japan and South Korea roll out supportive digital-health policies and leverage large electronic health-record datasets.
How do sustainability goals influence virtual trial uptake?
EuropeÕs 3R mandates and corporate carbon-reduction targets encourage sponsors to replace physical control arms with digital twins, reducing both animal use and trial-related emissions without compromising study integrity.
Page last updated on:


