Image Intensifier Market Size and Share
Market Overview
| Study Period | 2019 - 2030 |
|---|---|
| Market Size (2025) | USD 1.28 Billion |
| Market Size (2030) | USD 1.73 Billion |
| Growth Rate (2025 - 2030) | 6.11% CAGR |
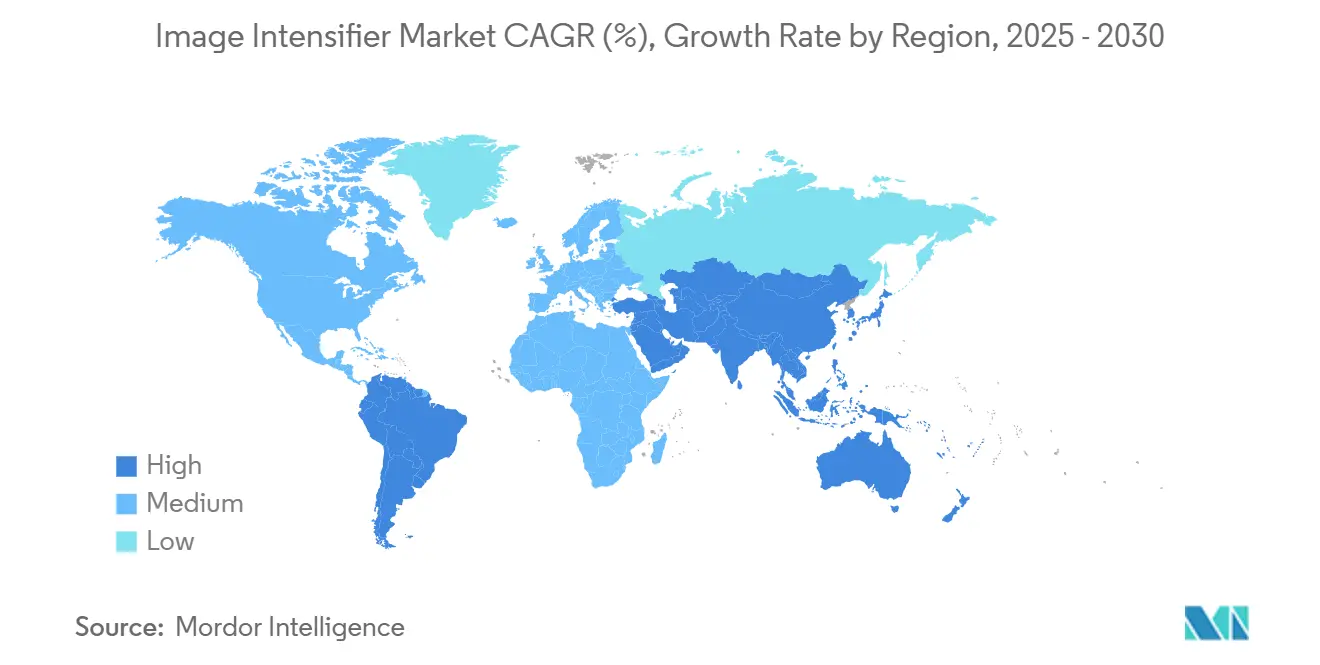
| Fastest Growing Market | Middle East and Africa |
| Largest Market | Europe |
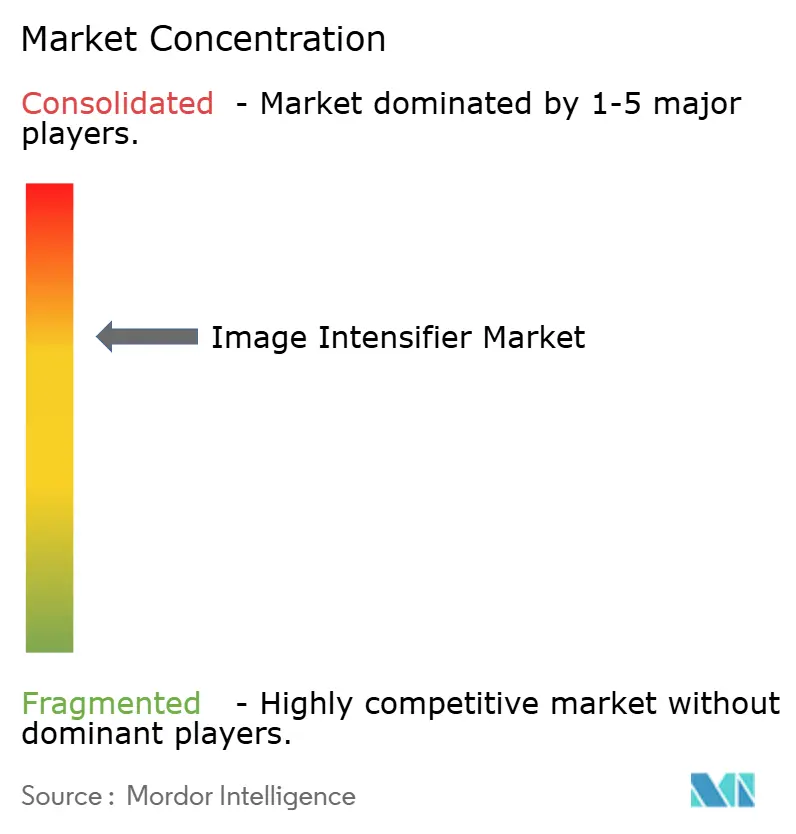
| Market Concentration | Medium |
Major Players *Disclaimer: Major Players sorted in no particular order Image © Mordor Intelligence. Reuse requires attribution under CC BY 4.0. | |
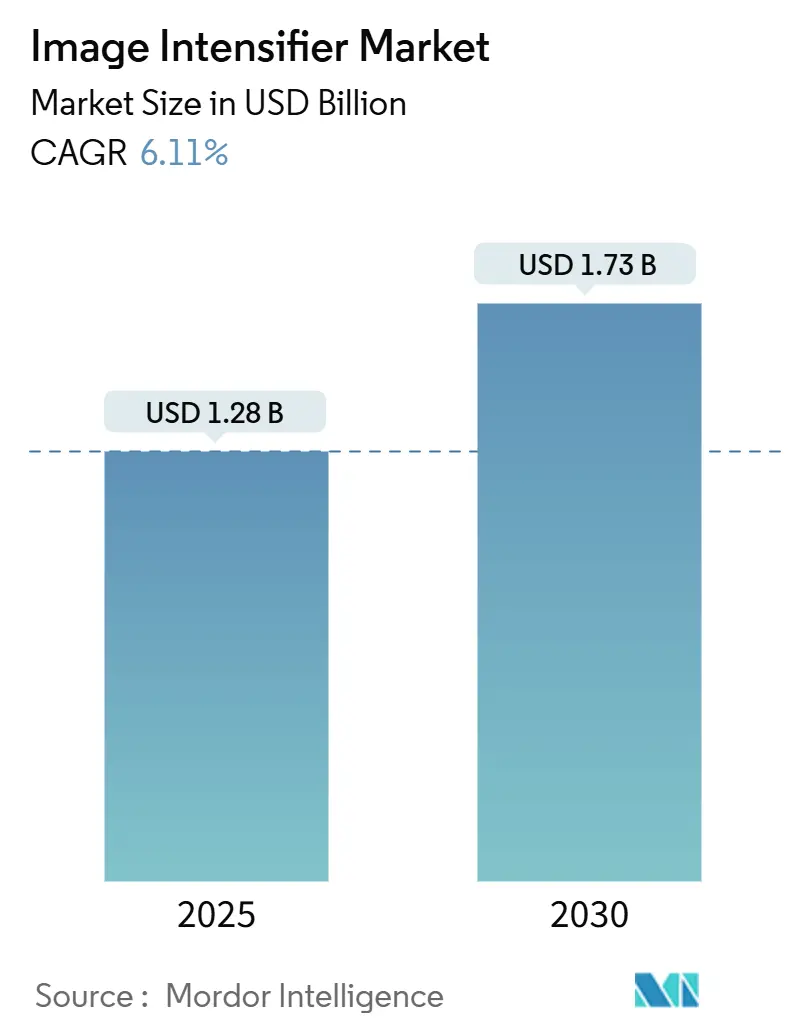
Image Intensifier Market Analysis by Mordor Intelligence
The image intensifier market size is valued at USD 1.28 billion in 2025 and is forecast to reach USD 1.73 billion by 2030, expanding at a 6.11% CAGR. Growth rests on simultaneous defense modernization, healthcare imaging upgrades, and scientific instrumentation spending. Soldier-worn night-vision programs in the Indo-Pacific, hospital replacement of flat-panel detectors with high-gain tubes, and power-grid inspection demand for solar-blind sensors each reinforce steady order backlogs. Competitive strategies focus on sub-18 mm tube miniaturization for size-weight-power (SWaP) optimization and Generation III reliability for mission-critical deployments. Procurement visibility through multi-year framework contracts and early-stage lunar exploration missions together improve revenue predictability despite price pressure from low-cost Chinese Generation 2+ suppliers.
Key Report Takeaways
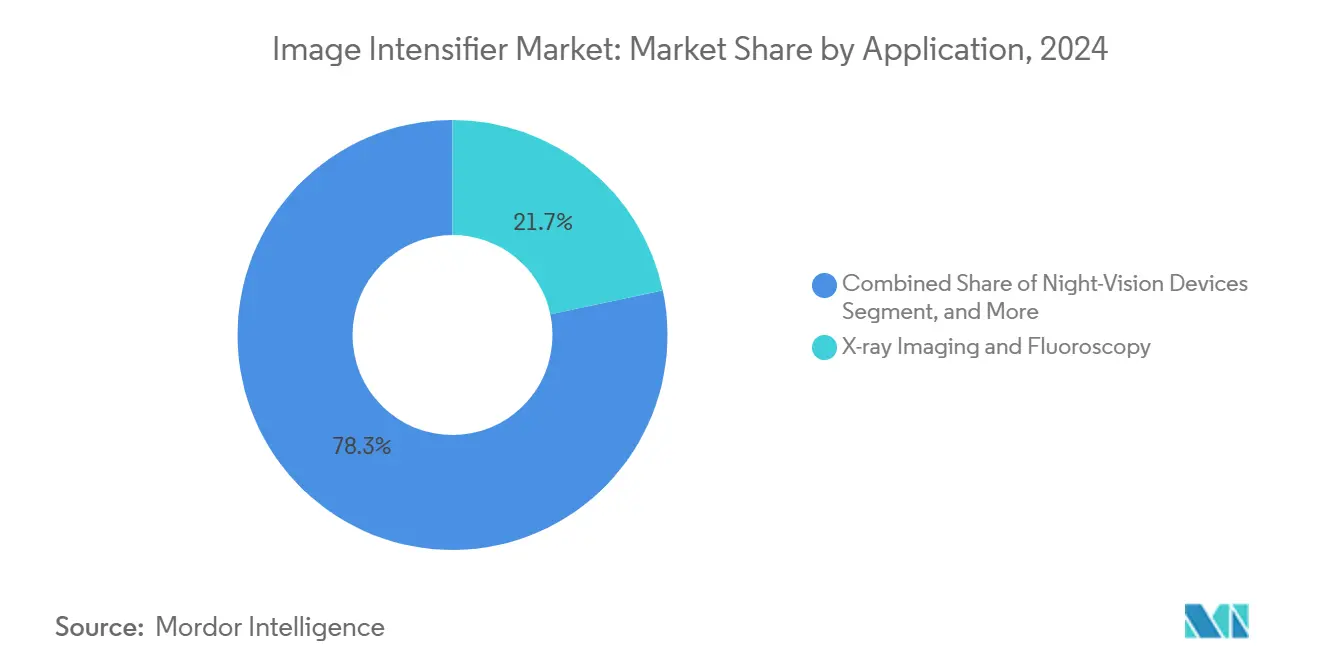
- By application, X-ray imaging and fluoroscopy led with 21.68% of image intensifier market share in 2024; scientific and high-speed cameras are projected to advance at a 7.36% CAGR through 2030.
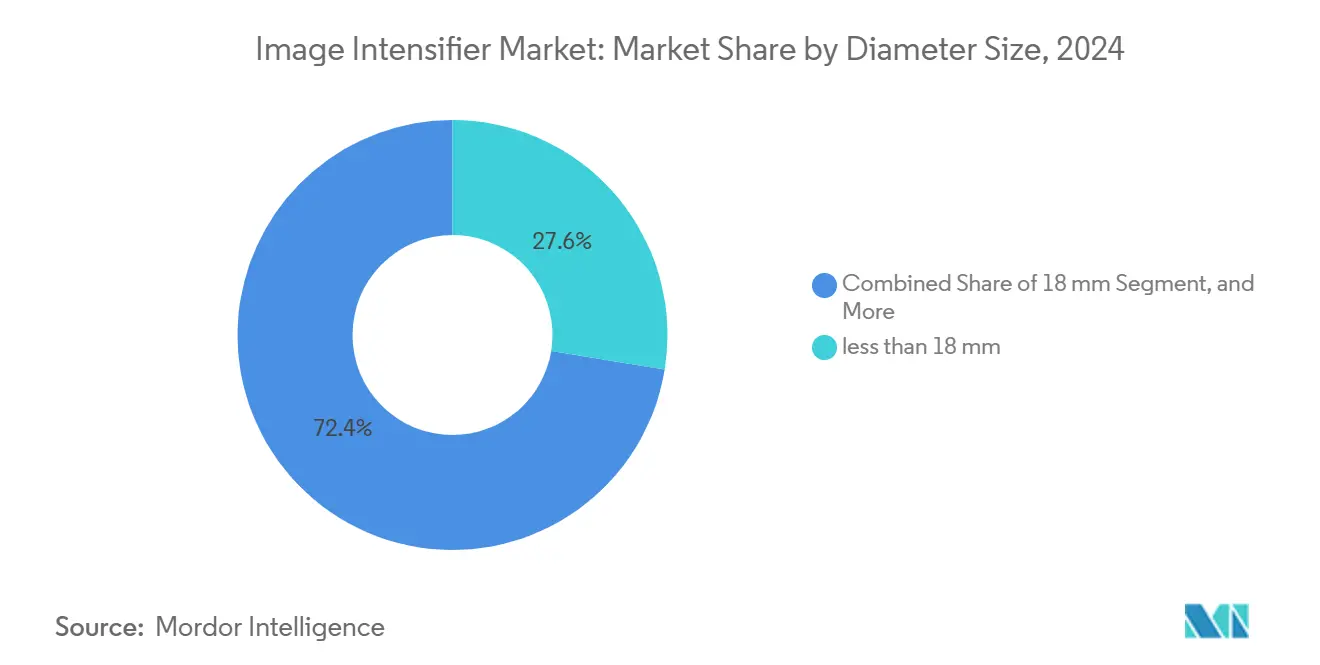
- By diameter size, sub-18 mm tubes accounted for 27.56% of the image intensifier market size in 2024 and are poised to grow at a 7.12% CAGR through 2030.
- By generation, Generation III filmed and thin-film variants posted the highest forecast growth at 7.43% CAGR, despite filmless tubes holding 25.43% of 2024 revenue.
- By end-use sector, healthcare commanded 23.74% share of the image intensifier market size in 2024, while industrial and scientific research is the fastest-growing sector at 7.22% CAGR through 2030.
- By geography, Europe led with 28.41% revenue share in 2024; the Middle East and Africa region is expanding at a 6.18% CAGR to 2030.
Global Image Intensifier Market Trends and Insights
Drivers Impact Analysis*
| Driver | (~) % Impact on CAGR Forecast | Geographic Relevance | Impact Timeline |
|---|---|---|---|
| Defense modernization programs in Indo-Pacific | +1.8% | Asia-Pacific core, spillover to North America and Europe | Medium term (2-4 years) |
| Replacement of flat-panel detectors by high-gain IITs | +1.2% | North America and Europe | Short term (≤ 2 years) |
| Surging law-enforcement procurement of panoramic NVGs | +0.9% | North America and EU, expanding to Asia-Pacific | Short term (≤ 2 years) |
| SWaP-optimized 16 mm tubes for soldier kits | +0.7% | Global defense markets | Medium term (2-4 years) |
| UV-solar-blind demand in power-grid inspection | +0.4% | North America and Europe, early Asia-Pacific adoption | Long term (≥ 4 years) |
| Space-qualified radiation-hard tubes for lunar rovers | +0.2% | North America and Europe, expanding to Asia-Pacific | Long term (≥ 4 years) |
| Source: Mordor Intelligence | |||
Defense modernization programs in Indo-Pacific
Eight national procurement plans converge around enhanced night-vision gear, pushing volume orders above previous cycles. For example, the U.S. Special Operations Command issued a USD 139 million award for ENVG-B that is 34% larger than the prior tranche, while Japan budgeted JPY 12.8 billion (USD 85.3 million) for Ground Self-Defense Force upgrades in 2024. Follow-on acquisition phases already earmarked in fiscal guidance imply sustained throughput into 2028. Wide-ranging end-user commonality-from Marines to partner special forces-reduces lot-to-lot design risk and keeps production lines fully loaded.
Growing replacement of flat-panel detectors by high-gain IITs in mini-C-arms
Hospitals targeting lower radiation exposure now specify high-gain tubes that deliver comparable image quality at reduced dose. A European audit logged a 23% patient-dose reduction after 2024 retrofits.[1]U.S. Customs and Border Protection, “CBP Enhances Border Security with Advanced Night Vision Technology,” cbp.gov Retrofit projects cost 40-60% less than full detector swaps, unlocking budgets in mid-tier facilities. Regulatory pressure from the U.S. FDA and EMA further accelerates replacement cycles and cements recurring aftermarket demand for longer-lived tubes.
Surge in law-enforcement procurement of panoramic NVGs
U.S. Border Patrol increased panoramic goggle orders by 78% in 2024, citing improved 97-degree fields of view that sharpen situational awareness during night operations.[2]Exosens Communications, “Exosens Invests 20 Million Euros in New Clean Room Facility,” exosens.com Germany’s federal police similarly placed EUR 8.4 million (USD 9.5 million) orders. Federal homeland security grants help city police forces finance adoption, widening the non-military addressable market.
Shift toward SWaP-optimized 16 mm tubes for soldier lethality kits.
The U.S. Army’s IVAS mandate for sub-18 mm tubes keeps helmet weight below 1.5 pounds. Achieving ≥2,400 μA/lm sensitivity on smaller photocathodes requires thin-film deposition breakthroughs, reinforcing vendor differentiation and margin defense despite raw-material inflation.
Restraints Impact Analysis*
| Restraint | (~) % Impact on CAGR Forecast | Geographic Relevance | Impact Timeline |
|---|---|---|---|
| Rapid price erosion from Chinese Gen-2+ suppliers | -1.4% | Global, most severe in price-sensitive markets | Short term (≤ 2 years) |
| Capital-intensive vacuum-tube fabrication | -0.8% | North America and Europe | Medium term (2-4 years) |
| Regulatory export-license bottlenecks | -0.6% | Global trade routes | Short term (≤ 2 years) |
| Competition from low-light CMOS/EMCCD modules | -0.4% | High-end scientific and industrial applications | Long term (≥ 4 years) |
| Source: Mordor Intelligence | |||
Rapid price erosion from low-cost Chinese suppliers
Chinese manufacturers have expanded capacity by 150% since 2024 and now offer Gen-2+ tubes at prices 40-60% below Western equivalents, compressing margins in civilian channels. Although military contracts remain insulated by ITAR, commercial buyers in Southeast Asia and Africa increasingly favor lower-priced imports, challenging premium brand positioning. Sensitivity levels of 1,800-2,200 μA/lm satisfy most non-combat requirements, narrowing performance differentials once exclusive to Western Gen III lines.
Capital-intensive vacuum-tube fabrication and clean-room expansion
Building a single microchannel plate line costs USD 15–25 million and takes up to 18 months. Exosens’ EUR 20 million (USD 22.6 million) Brive clean-room upgrade illustrates long payback horizons that discourage new entrants.[3]IEEE Staff, “Advanced Image Intensifier Applications in Medical Fluoroscopy,” IEEE Transactions on Medical Imaging, ieee.org Rising gallium arsenide feedstock prices and ISO 9001/AS9100 compliance further elevate operating expense, limiting capacity additions and slowing response to sudden demand spikes.
*Our forecasts treat driver/restraint impacts as directional, not additive. The impact forecasts reflect baseline growth, mix effects, and variable interactions.
Segment Analysis
By Diameter Size: Compact Tubes Underpin Military Modernization
Sub-18 mm variants held 27.56% image intensifier market share in 2024. The image intensifier market size for sub-18 mm tubes is projected to advance at a 7.12% CAGR as defense agencies demand lighter head-borne gear. The Next Generation Squad Weapon optic requirement caps total system weight at 680 g, aligning with miniaturized tube adoption.
Standard 18 mm products retain large installed bases across legacy platforms, anchoring spare-part revenue streams. Larger 25 mm and ≥40 mm diameters serve fluoroscopy and particle-physics laboratories where wide photocathode areas boost resolution. Manufacturing yield declines sharply below 18 mm, sustaining higher average selling prices that offset volume concentration in mainstream diameters.


By Generation/Technology: Generation III Outpaces Filmless Growth
Filmless tubes captured 25.43% revenue in 2024; nonetheless, Generation III filmed and thin-film devices are expanding faster at 7.43% CAGR. Procurement officials still prioritize proven Gen III reliability-mean-time-between-failure metrics that exceed 10,000 h-over filmless theoretical performance gains. The image intensifier market size for Generation III is forecast to widen as retrofit cycles cascade through the U.S. Marine Corps ENVG-B and allied programs. Filmless tubes remain favored for scientific cameras where halo suppression matters most.
By Application: Fluoroscopy Dominates, Scientific Use Accelerates
X-ray imaging and fluoroscopy contributed 21.68% of 2024 revenue. Hospitals in Europe recorded double-digit volume growth after 2024 regulatory revisions mandating lower radiation doses. Scientific and high-speed cameras, however, register a robust 7.36% CAGR through 2030 as quantum-physics labs and materials-science centers demand ultra-fast gating. Night-vision devices for military and police preserve baseline demand, cushioning cyclical swings in capital equipment budgets.
By End-Use Sector: Healthcare Leads, Industrial Research Climbs
Healthcare represented 23.74% of 2024 revenue, supported by public-sector investment in diagnostic imaging across emerging economies. The image intensifier market size for industrial and scientific research is increasing at a 7.22% CAGR as manufacturers integrate intensified sensors into automated non-destructive testing lines. Defense procurement volumes remain steady, but incremental growth shifts toward homeland security agencies leveraging federal grants for panoramic NVGs.
Geography Analysis
Europe generated 28.41% of 2024 revenue, anchored by German and French defense contracts and stringent EU medical device rules that favor high-reliability tubes. A EUR 2.1 billion German soldier-system upgrade included sizable night-vision allocations, reinforcing vendor order boards.
The Middle East and Africa display the fastest growth at 6.18% CAGR, driven by Vision 2030 localization programs in Saudi Arabia and the UAE hospital construction pipelines. High oil revenues sustain defense spending even in volatile macro cycles.
North America remains the second-largest region thanks to U.S. defense budgets and sophisticated healthcare systems, though growth moderates as replacement cycles lengthen. Asia-Pacific splits between high-end Japanese and South-Korean demand for premium Generation III tubes and price-sensitive Southeast Asian markets procuring Chinese Gen-2+ devices.

Competitive Landscape
Market leadership rests with Exosens, L3Harris, and Hamamatsu, each leveraging proprietary vacuum-processing know-how. These firms protect technology roadmaps via vertical integration-from gallium arsenide photocathodes to microchannel plates-achieving gross margins 300–500 basis points above sector average. Chinese competitors such as NNVT ramp capacity to challenge on cost, yet ITAR restrictions and long-term reliability hurdles bar immediate substitution in NATO contracts.
Strategic moves include L3Harris securing USD 263 million Marine Corps orders for Gen III goggles, Exosens adding 35% capacity via its Brive expansion, and Hamamatsu investing JPY 3.2 billion in radiation-hard microchannel plate lines for lunar rovers. White-space plays revolve around UV-solar-blind inspection cameras and space-qualified tubes, where the supplier count is fewer than five globally, enabling premium pricing. Emerging threats arise from sensor-fusion modules marrying low-light CMOS with EMCCD gain stages, targeting scientific imaging niches once exclusive to intensified cameras.
Image Intensifier Industry Leaders
Exosens S.A.S. (Photonis)
L3Harris Technologies Inc.
Hamamatsu Photonics K.K.
Excelitas Technologies Corp.
Katod OJSC
- *Disclaimer: Major Players sorted in no particular order

Recent Industry Developments
- September 2025: Theon Sensors secured a EUR 110 million (USD 118.8 million) framework contract from the Hellenic Ministry of Defense to supply 30,000 panoramic night-vision goggles fitted with sub-18 mm tubes for delivery through 2029.
- May 2025: Elbit Systems premiered its filmless 5G image-intensifier platform, achieving 2,800 μA/lm sensitivity, at SOFIC 2025 to target next-generation panoramic goggles and soldier sights.
- February 2025: Exosens entered a multi-year R&D agreement with the European Space Agency to co-develop UV-solar-blind image intensifiers for a 2028 power-grid inspection satellite constellation.
- January 2025: Hamamatsu Photonics commissioned a JPY 4.6 billion (USD 32.1 million) gallium-arsenide photocathode line in Shizuoka, increasing monthly output of radiation-hardened image intensifier tubes by 40% for planned lunar rover payloads.


Global Image Intensifier Market Report Scope
| less than 18 mm |
| 18 mm |
| 25 mm |
| greater than or equal to 40 mm |
| Generation I |
| Generation II / II+ |
| Generation III (Filmed and Thin-Film) |
| Filmless / Next-Gen (4G-Plus, 5G, EBAPS) |
| Night-Vision Devices |
| X-ray Imaging and Fluoroscopy |
| Scientific and High-Speed Cameras |
| Industrial and Security Inspection |
| Defense and Military |
| Law-Enforcement and Homeland Security |
| Healthcare |
| Industrial and Scientific Research |
| North America | United States | |
| Canada | ||
| Mexico | ||
| Europe | Germany | |
| United Kingdom | ||
| France | ||
| Russia | ||
| Rest of Europe | ||
| Asia-Pacific | China | |
| Japan | ||
| India | ||
| South Korea | ||
| Australia | ||
| Rest of Asia-Pacific | ||
| Middle East and Africa | Middle East | Saudi Arabia |
| United Arab Emirates | ||
| Rest of Middle East | ||
| Africa | South Africa | |
| Egypt | ||
| Rest of Africa | ||
| South America | Brazil | |
| Argentina | ||
| Rest of South America | ||
| By Diameter Size | less than 18 mm | ||
| 18 mm | |||
| 25 mm | |||
| greater than or equal to 40 mm | |||
| By Generation / Technology | Generation I | ||
| Generation II / II+ | |||
| Generation III (Filmed and Thin-Film) | |||
| Filmless / Next-Gen (4G-Plus, 5G, EBAPS) | |||
| By Application | Night-Vision Devices | ||
| X-ray Imaging and Fluoroscopy | |||
| Scientific and High-Speed Cameras | |||
| Industrial and Security Inspection | |||
| By End-Use Sector | Defense and Military | ||
| Law-Enforcement and Homeland Security | |||
| Healthcare | |||
| Industrial and Scientific Research | |||
| By Geography | North America | United States | |
| Canada | |||
| Mexico | |||
| Europe | Germany | ||
| United Kingdom | |||
| France | |||
| Russia | |||
| Rest of Europe | |||
| Asia-Pacific | China | ||
| Japan | |||
| India | |||
| South Korea | |||
| Australia | |||
| Rest of Asia-Pacific | |||
| Middle East and Africa | Middle East | Saudi Arabia | |
| United Arab Emirates | |||
| Rest of Middle East | |||
| Africa | South Africa | ||
| Egypt | |||
| Rest of Africa | |||
| South America | Brazil | ||
| Argentina | |||
| Rest of South America | |||


Key Questions Answered in the Report
What is the global value of the image intensifier market in 2025?
The market stands at USD 1.28 billion in 2025 and is forecast to reach USD 1.73 billion by 2030.
Which application segment is growing the fastest?
Scientific and high-speed cameras are expanding at a 7.36% CAGR through 2030.
Why are sub-18 mm tubes important for defense programs?
They cut helmet-mounted weight below 1.5 pounds, meeting SWaP targets for programs such as the U.S. Army’s IVAS.
Which region leads in market revenue?
Europe held 28.41% of 2024 revenue, driven by defense and medical imaging procurement.
What is the main restraint facing suppliers?
Aggressive price competition from Chinese Gen-2+ manufacturers, which can trim market CAGR by 1.4 percentage points.
How concentrated is supplier power?
A concentration score of 6 indicates moderate dominance by the top five vendors, leaving room for niche players.
Page last updated on:


