
Digital Camera Market Size and Share
Market Overview
| Study Period | 2020 - 2031 |
|---|---|
| Market Size (2026) | USD 10.19 Billion |
| Market Size (2031) | USD 12.78 Billion |
| Growth Rate (2026 - 2031) | 4.62 % |
| Fastest Growing Market | Asia Pacific |
| Largest Market | Asia Pacific |
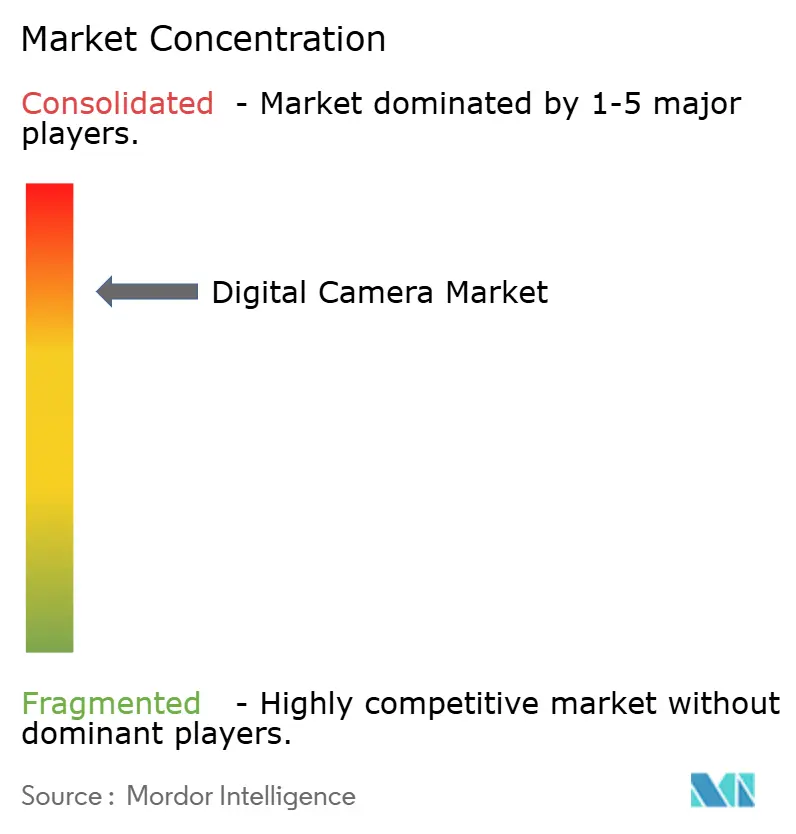
| Market Concentration | High |
Major Players *Disclaimer: Major Players sorted in no particular order Image © Mordor Intelligence. Reuse requires attribution under CC BY 4.0. | |
Digital Camera Market Analysis by Mordor Intelligence
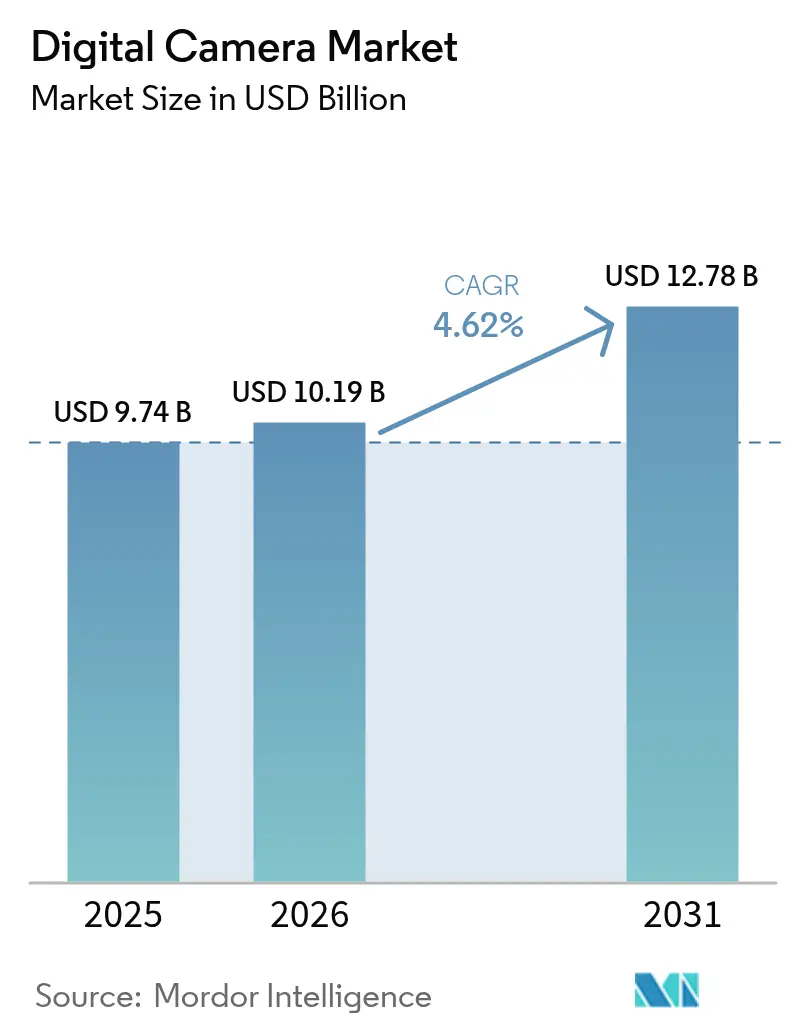
Digital camera market size in 2026 is estimated at USD 10.19 billion, growing from 2025 value of USD 9.74 billion with 2031 projections showing USD 12.78 billion, growing at 4.62% CAGR over 2026-2031.
Signaling that the market size is expanding faster than many adjacent imaging categories. Manufacturers have repositioned hardware as purpose-built tools for professionals and creators, allowing average selling prices to climb even as unit volumes trail smartphone adoption. Asia-Pacific’s prominence, Canon’s 22-year lens leadership, and creator-economy dynamics collectively illustrate how premium hardware, AI-powered features, and social-media workflows drive the digital camera market forward.[1]Source: Canon Inc., “Canon Celebrates 22nd Consecutive Year of No. 1 Share,” global.canon Competitive intensity now centers on computational autofocus and live-stream integration rather than price alone, while supply-chain shocks from semiconductor shortages and 24–46% U.S. tariffs have nudged retail prices 20–40% higher across leading brands. China’s 213% surge in compact-camera shipments, the tourism rebound, and the proliferation of full-frame sensors underscore how the digital camera market is successfully reframing its value proposition as complementary to mobile photography.
Key Report Takeaways
- By camera type, mirrorless systems held 57.85% of the digital camera market share in 2025, and the segment is advancing at a 6.23% CAGR to 2031.
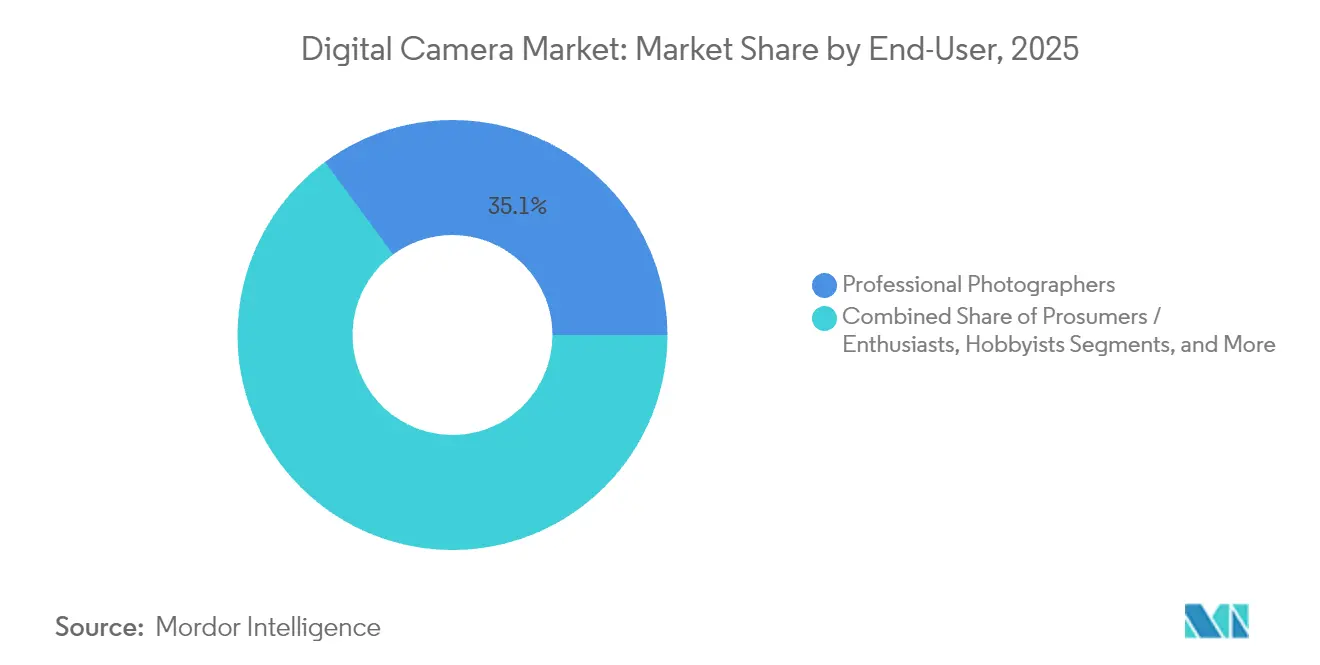
- By end user, content creators registered the fastest growth trajectory with a 6.44% CAGR through 2031, whereas professional photographers retained 35.10% revenue share in 2025.
- By lens type, interchangeable systems commanded 59.62% of the digital camera market size in 2025 and are projected to expand at a 5.52% CAGR during 2026-2031.
- By sensor size, full-frame commanded 37.25% of the digital camera market size in 2025 and is growing at 5.63% through 2031.
- By geography, Asia-Pacific led with 31.42% share of the digital camera market in 2025 and is growing at 5.76% through 2031.
Note: Market size and forecast figures in this report are generated using Mordor Intelligence’s proprietary estimation framework, updated with the latest available data and insights as of 2026.
Market Trends and Insights
Drivers Impact Analysis of Digital Camera Market*
| DRIVER | (~) % IMPACT ON CAGR FORECAST | GEOGRAPHIC RELEVANCE | IMPACT TIMELINE |
|---|---|---|---|
| Shift from DSLR to high-margin mirrorless systems | +1.8 | Global; Asia-Pacific leading | Medium term (2-4 years) |
| Creator-economy demand for hybrid photo-video equipment | +1.2 | North America and Europe core; expanding to Asia-Pacific | Long term (≥ 4 years) |
| AI-driven autofocus and subject-tracking breakthroughs | +0.9 | Global, premium segment | Short term (≤ 2 years) |
| Post-COVID tourism rebound boosting premium camera sales | +0.7 | Asia-Pacific core; spill-over to Europe | Medium term (2-4 years) |
| Rise of compact “retro” fixed-lens models among Gen-Z | +0.6 | Global; China and North America | Short term (≤ 2 years) |
| OEM partnerships to bundle cameras with live-stream accessories | +0.4 | North America and Europe; expanding globally | Long term (≥ 4 years) |
| Source: Mordor Intelligence | |||


Creator-economy demand for hybrid photo-video equipment
The creator economy is on pace to double, spawning a buyer cohort that expects cinematic 8K60p, livestream-ready codecs, and seamless TikTok exports.[2]Source: David Schonauer, “Will the Growing Creator Economy Drive a Boom in Camera Sales?” ai-ap.com Canon’s EOS R5 Mark II, with internal 8K RAW and Cinema EOS workflow hooks, targets this prosumer base. Viral demand for PowerShot G7X Mark III five years post-launch shows how social media extends product life cycles when specific features resonate with influencers.[3]Source: Allison Johnson, “Galaxy S23 Ultra Camera Sensor Comparison,” theverge.com As workflows blur between stills and video, manufacturers must embed connectivity and mobile apps into every flagship.
Shift from DSLR to high-margin mirrorless systems.
Mirrorless cameras confirm that the digital camera market is migrating toward architectures that support AI firmware updates and silent shutters.[4]Source: DPReview Staff, “CIPA’s January 2025 Data Shows Compacts Are More Popular Than Ever,” dpreview.com Canon’s EOS R1 exemplifies this shift by combining dual-DIGIC processors with 40 fps burst to justify premium pricing. Average selling prices rose 200% in five years as brands harvested higher gross margins from fewer, better-equipped bodies. Software-hardware integration now underpins competitive advantage, and the mirrorless roadmap extends into fast-growing video workflows.
AI-driven autofocus and subject-tracking breakthroughs
Deep-learning algorithms shift autofocus from reactive to predictive. Canon’s Action Priority AF analyzes motion vectors to lock onto an athlete before peak action.[5]Source: Dave Etchells, “Canon Interview CP+ 2025,” imaging-resource.com Sony’s Camera Verify embeds cryptographic signatures that certify image provenance, combating synthetic-media threats. Canon’s neural-network upscaling lifts resolution by 400% and cuts noise two stops, allowing smaller sensors to rival medium format output. These capabilities create defensible moats and make computational photography table stakes for the digital camera market.
Post-COVID tourism rebound boosting premium camera sales
Mirrorless revenue climbed as Chinese travelers resumed outbound trips and sought superior optics for landmark destinations. CIPA surveys found that 40% of Japanese teens felt more motivated to photograph travel moments post-pandemic. Tourism’s comeback disproportionately benefits high-margin full-frame bodies and premium zooms, supporting the digital camera market’s premiumization thesis.
Restraints Impact Analysis of Digital Camera Market*
| RESTRAINTS | (~) % IMPACT ON CAGR FORECAST | GEOGRAPHIC RELEVANCE | IMPACT TIMELINE |
|---|---|---|---|
| Smartphone computational-photography cannibalization | -1.4 | Global; emerging markets | Long term (≥ 4 years) |
| Expansion of rental and subscription models lowering unit demand | -0.8 | North America and Europe | Medium term (2-4 years) |
| Global memory-chip shortages raising BOM costs | -0.6 | Global; Asia manufacturing hubs | Short term (≤ 2 years) |
| EU sustainability regulation on shutter-cycle durability | -0.3 | Europe; global spill-over | Long term (≥ 4 years) |
| Source: Mordor Intelligence | |||
Smartphone computational-photography cannibalization
Samsung’s Galaxy S23 Ultra packs a 200 MP sensor with pixel binning that produces share-ready images rivaling entry-level cameras, eroding beginner demand. Vivo’s X90 Pro adds a 1-inch sensor, further squeezing point-and-shoot relevance. Camera makers must emphasize interchangeable lenses, low-light superiority, and optical ergonomics to maintain audience segments impervious to smartphone convenience.
Expansion of rental and subscription models lowering unit demand
GoPro’s revenue pivot illustrates how subscriptions can cannibalize new-unit purchases while still monetizing users over time. Lens-rental platforms enable freelancers to access USD 3,000 cine lenses for USD 40 per weekend, a value proposition that removes barriers to entry yet decreases outright sales. The digital camera market, therefore, must balance volume against lifetime value by offering brand-owned rental ecosystems or bundled financing
*Our forecasts treat driver/restraint impacts as directional, not additive. The impact forecasts reflect baseline growth, mix effects, and variable interactions.
Digital Camera Market Segment Analysis
By Lens Type:
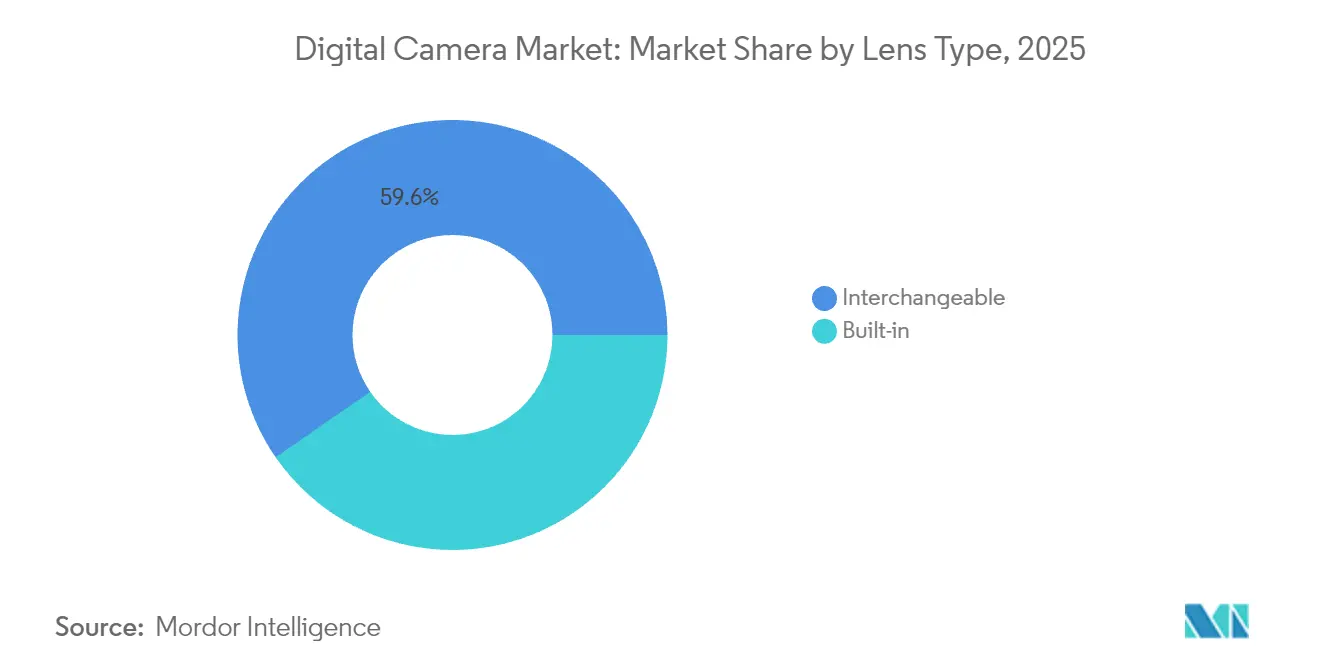
Interchangeable Systems Drive Premium MigrationInterchangeable systems accounted for 59.62% of the digital camera market size in 2025 and will expand at a 5.52% CAGR through 2031 as photographers view lens collections as long-term assets. Canon’s 22-year lens dominance underscores lock-in economics that deter brand switching and reinforce ecosystem value.
The lens-mount moat protects margins because users purchase multiple lenses over a body’s lifespan, stabilizing revenue even if annual body shipments fluctuate. Built-in lens models remain relevant in compact and action categories where ruggedness and pocketability outweigh optical flexibility, ensuring the digital camera market still serves both convenience-centric and performance-centric niches.


By Camera Type:
Mirrorless Revolution AcceleratesMirrorless captured 57.85% digital camera market share in 2025, outpacing DSLRs on a 6.23% CAGR to 2031. Canon, Nikon, and Sony all debuted flagship mirrorless bodies in 2024-2025, confirming total industry commitment USA.
DSLR decline is accelerating as R&D budgets shift entirely to mirrorless. Compact and 360-degree cameras carve out adjacent growth via social media virality, as DJI’s Pocket 3 tripled sales to RMB 80 million (USD 11.2 million) in a single month. Action cameras, therefore, complement mirrorless dominance rather than compete directly, keeping the digital camera market diversified across use cases.
By End User:
Content Creators Emerge as Growth EngineContent creators posted a 6.44% CAGR and are reshaping the digital camera market size trajectory by demanding livestream-ready features at consumer-friendly prices. Professional photographers still generate the bulk of high-ticket body and lens sales, but creators deliver volume and social visibility.
As platforms algorithmically reward high-quality video, creators migrate from smartphones to mirrorless rigs capable of clean HDMI, vertical-video metadata, and direct-to-cloud uploads. Canon’s Live Switcher Mobile app responds to this gap by turning dual EOS bodies into a portable multicam studio. The digital camera market now bifurcates between traditional pro workflows and creator-centric bundles.
By Sensor Size:
Full-Frame Dominance Reflects Premium FocusFull-frame held 37.25% share and is growing 5.63% annually, cementing its status as the premium benchmark in the digital camera market share hierarchy. Medium-format teases extreme resolution with rumors of a 247 MP system for 2025.
APS-C remains important for enthusiasts seeking reach and affordability, while Micro Four Thirds sustains action and vlog platforms where weight matters. AI upscaling may eventually flatten perceived gaps, yet optics-driven depth-of-field keeps full-frame aspirational. The sensor ladder, therefore, underpins pricing stratification inside the digital camera market.
Geography Analysis
APAC Digital Camera Market
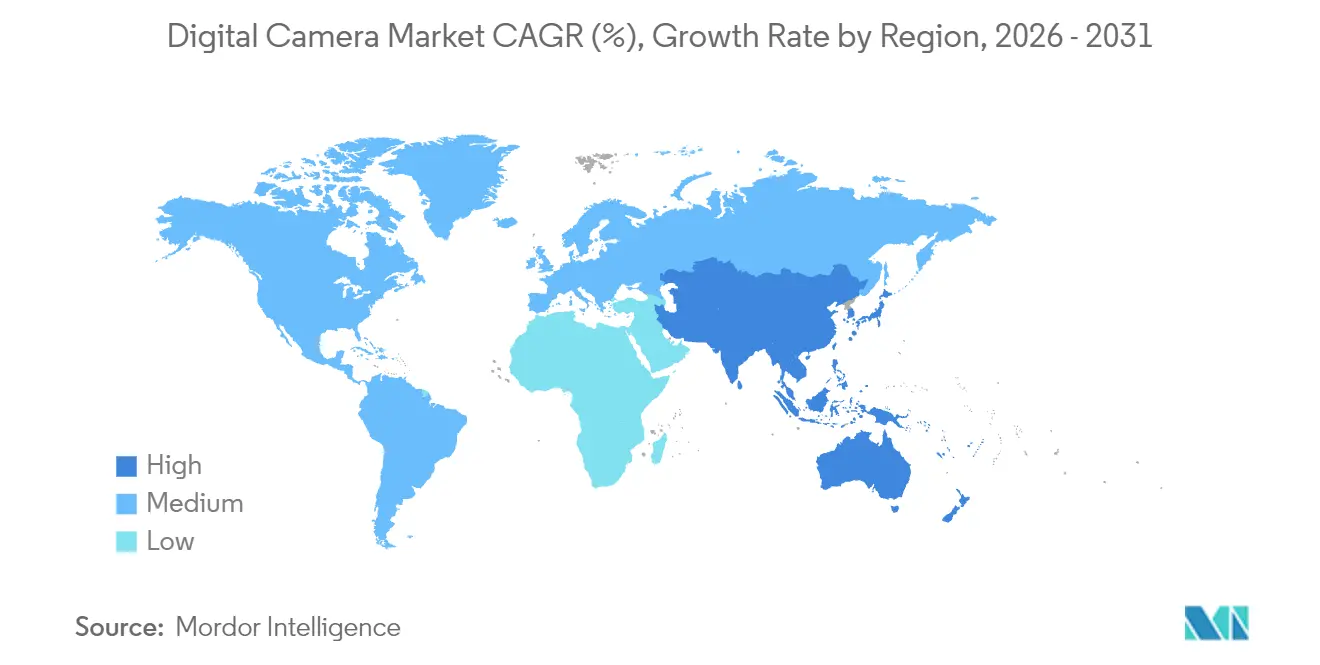
Asia-Pacific contributed 31.42% of the digital camera market size in 2025 and is advancing at 5.76% through 2031. China transitioned from a manufacturing hub to a consumption powerhouse as Xiaohongshu delivered 1.2 billion camera-related views, boosting DJI Pocket 3 viral sales. Japan anchors R&D leadership, and BCN Awards illustrate Sony and Nikon gaining local ground.
The Americas, EMEA and APAC Digital Camera Market
North America remains a trendsetter in creator workflows despite tariff-driven retail inflation of 20–40% on imports. The region’s mature installed base upgrades to secure AI functions and broadcast codecs. Europe’s 2024/1781 eco-design regulation forces brands to lengthen shutter-cycle durability, nudging engineering budgets toward repairability. South America, the Middle East, and Africa contribute modest shares today but mirrorless affordability and social-media penetration unlock long-run upside. Nikon expects India to rank among its top-5 markets within four years, reflecting sub-regional divergence inside Asia. Fujifilm’s plan to grow Indian retail counters underpins that thesis. The digital camera market, therefore, blends mature saturation with emergent hot spots that sustain aggregate growth.

Regulatory Landscape
Digital cameras face a patchwork of product-compliance and trade rules that vary by market. In the European Union, the Common Charger requirements mandate USB-C charging receptacles and charger unbundling, with the compliance window effective from 28 December 2024, shaping accessory packaging and device design for the region. Cross-border trade also influences pricing and sourcing. Industry classification uses HS codes such as 8525.89, 9006.53, and 9006.59, which affect tariff outcomes by destination; the United States enforces Section 301 remedies on certain China-origin imports. In India, BIS certification requirements apply to camera imports, while Europe is tightening consumer policies around repairability, with member-state adoption of repair rules from 31 July 2026 increasing spare-parts availability and service readiness.
Value Chain Analysis
The digital camera value chain begins with upstream imaging components (CMOS sensors, optical glass and lens elements, processors, memory, and power-management ICs) and proceeds through sensor packaging, shutter or IBIS modules, EVF/LCDs, and lens groups before final assembly and firmware integration. Control over critical components is a differentiator, with Sony Semiconductor Solutions serving as a central sensor supplier to many brands, and optics and precision manufacturing underpinning differentiation in interchangeable-lens ecosystems. Midstream manufacturing and assembly are concentrated in East Asia, with camera-module and related assembly capacity anchored in China and nearby hubs such as South Korea, Taiwan, and Vietnam, creating exposure to logistics and component tightness. Downstream, brands rely on a mix of direct-to-consumer e-commerce, specialist photo retail, and professional channels, supported by after-sales service networks; recent supply conditions highlight the need for capacity flexibility in optics and sensors as suppliers restart idle lines and brands push for tighter alignment across sensor, optics, and firmware roadmaps.
Competitive Landscape
Canon, Sony, and Nikon collectively hold a majority share, making the digital camera market moderately concentrated yet open to disruption. Canon’s 22-year streak in interchangeable-lens leadership reflects cumulative lens-mount investment and pro-service infrastructure. Sony leverages in-house sensor fabrication to cycle new Alpha models rapidly, packing AI autofocus and provenance signatures that differentiate beyond optics.
Nikon’s acquisition of RED Cinema demonstrates vertical expansion into digital cinema workflows, increasing the total addressable market. Chinese entrants such as DJI and Insta360 exploit agile consumer-electronics supply chains to dominate action and 360° niches, capturing nearly 70% share of China’s panoramic segment. Innovation focal points for all players now include AI upscaling, cloud integration, and end-to-end creator suites rather than pure megapixel races.
Pricing strategies have tilted premium as chip shortages and tariffs inflate costs, but brands cushion blow-back through subscription perks, extended warranties, and software unlocks. Canon’s automated lens-plant rollout in April 2025 illustrates an operational pivot toward flexible manufacturing. The competitive narrative, therefore, centers on ecosystem depth, AI differentiation, and omnichannel engagement that keeps the digital camera market dynamic.
Digital Camera Industry Leaders
Canon Inc.
Sony Group Corporation
Nikon Corporation
Fujifilm Holdings Corporation
Panasonic Holdings Corporation
- *Disclaimer: Major Players sorted in no particular order
Digital Camera Market Companies Covered in this Report
- Canon Inc.
- Sony Group Corporation
- Nikon Corporation
- Fujifilm Holdings Corporation
- Panasonic Holdings Corporation
- OM Digital Solutions Corporation
- Leica Camera AG
- Sigma Corporation
- Victor Hasselblad AB
- Eastman Kodak Company
- Ricoh Imaging Company, Ltd.
- GoPro, Inc.
- Insta360 (Arashi Vision Inc.)
- DJI Technology Co., Ltd.
- Blackmagic Design Pty. Ltd.
- Phase One A/S
- RED Digital Cinema, LLC
- Z CAM (Shenzhen ImagineVision Tech)
- Pentax (Brand of Ricoh Imaging)
- Tamron Co., Ltd.
- Carl Zeiss AG (Consumer Imaging)
- Yongnuo Photographic Equipment Co., Ltd.

Market Opportunities and Future Outlook
Premium and specialized capture segments are expanding as major manufacturers push differentiated hardware and workflows. Canon's MS-510 multi-purpose camera built around a 1-inch SPAD sensor for ultra-low-light, full-color video capture exemplifies this shift, while Sony has introduced the Alpha 7R VI with a 66.8 MP stacked full-frame sensor and AI processing, and the RX10 V all-in-one super-zoom targets integrated creators' needs. Creator-centric video features and cinema-adjacent bundles appear as growth channels, with Canon positioning the EOS R6 V and RF20-50mm F4 L IS USM PZ as a kit for video creators, Nikon aligning with RED for cinema capabilities through its FY2026-2030 plan, and total camera shipments reaching 9.44 million units in 2025 and 9.59 million units in 2026 per CIPA. EU repair requirements tightening from July 2026 further stimulate spare-parts ecosystems and service networks.
Recent Industry Developments in Digital Camera Market
- July 2026: Sony Electronics introduced the RX10 V, a fifth-generation all-in-one super-zoom camera pairing a 24-600mm lens with AI-powered Real-time Recognition AF and a 1.0-type stacked sensor. The launch reinforces demand for premium fixed-lens cameras that compress travel and wildlife use cases into a single device while keeping autofocus performance as a key differentiator.
- May 2026: Canon announced the EOS R6 V full-frame mirrorless camera alongside the RF 20-50mm F4 L IS USM PZ, its first RF L-series lens with internal power zoom. The pairing targets creator workflows that prioritize smooth zoom control and hybrid photo-video operation, strengthening ecosystem stickiness through bodies and lenses designed as a matched kit.
- March 2024: Nikon announced an agreement to acquire RED.com, LLC to expand its professional digital cinema camera business. The move links Nikon optics and imaging heritage with RED's cinema platform capabilities, tightening Nikon's positioning in high-end video production adjacent to the broader interchangeable-lens camera market.


Digital Camera Market Report Scope and Research Methodology
Market Definition and Coverage
The market is defined as revenues generated from the sale of digital camera hardware, where images and video are captured on a digital sensor and stored electronically. Coverage includes mainstream consumer and professional camera formats sold through online and offline channels across major regions.
Scope exclusions: This sizing does not count smartphones, webcams, camcorders sold as separate categories, or purely software editing subscriptions.
Segments Covered in This Report
- By Lens Type
- Built-in
- Interchangeable
- By Camera Type
- Compact Digital Camera
- DSLR (Digital Single-Lens Reflex)
- Mirrorless
- Action / 360°
- By End User
- Professional Photographers
- Prosumers / Enthusiasts
- Hobbyists
- Content-Creators / Streamers
- By Sensor Size
- Medium Format
- Full-Frame
- APS-C
- Micro Four-Thirds and Smaller
- By Geography
- North America
- United States
- Canada
- Mexico
- South America
- Brazil
- Argentina
- Rest of South America
- Europe
- Germany
- United Kingdom
- France
- Russia
- Rest of Europe
- Asia-Pacific
- China
- Japan
- India
- South Korea
- South-East Asia
- Rest of Asia-Pacific
- Middle East and Africa
- Middle East
- Saudi Arabia
- United Arab Emirates
- Rest of Middle East
- Africa
- South Africa
- Egypt
- Middle East
- North America
Data Sources, Market Sizing, and Validation
Desk Research
Desk research was used to build the first structure of the model and to anchor inputs to repeatable public signals. We referenced sources such as camera and imaging industry shipment statistics from trade bodies, customs and trade data series for import and export flows, and government statistics that reflect consumer electronics spending and price movements.
To avoid over relying on one dataset, we also reviewed company annual reports and earnings decks, product launch announcements, and credible press coverage on imaging trends like mirrorless adoption, lens attach behavior, and sensor format mix. When needed, we used paid subscription sources for company financials and intelligence, a patent database, and an import-and-export shipment-level database to cross-check capacity, product mapping, and trade direction. These sources are illustrative only, and we also consulted other public documents and data points for collection, validation, and clarification.
Primary Interviews and Surveys
Primary work focused on validating what drives actual camera buying and replacement, and then stress-testing the desk assumptions that can swing totals. We spoke with stakeholders across the value chain, including brands and manufacturing partners, channel and distribution executives, and professional user communities, and we kept respondent coverage balanced across APAC, EMEA, and the Americas.
Distribution of primary research fieldwork respondents
| Company type | Respondent position | Region |
|---|---|---|
| Top tier: 36% | CXOs: 17% | APAC: 48% |
| Mid tier: 42% | Functional/Unit leaders: 41% | EMEA: 29% |
| Smaller Players: 22% | Managers: 42% | Americas: 23% |
Market-Sizing & Forecasting
Sizing starts with a top-down build where global demand is reconstructed using camera shipment and trade signals, then adjusted by average selling price bands and the mix shift across camera types. Once the first total is produced, we corroborate it with selective bottom-up checks like sampled ASP x volume by key camera formats and channel checks on sell-through patterns, and we then tune totals when the gap can be explained.
Key model inputs include interchangeable versus built-in lens share, mirrorless versus DSLR versus compact mix, sensor-size mix (full-frame versus APS-C and others), replacement cycle timing, and regional demand skews that show up in trade flows and shipment trends. Because disclosures are uneven across smaller brands and some markets, missing points are handled through proxying with regional shipment splits and price-band distributions, followed by rechecking with interview feedback.
For forecasting, we used scenario analysis supported by trend smoothing on shipments and ASP progression. Assumptions are aligned to what channel and product experts expect for mid-cycle demand, creator-led purchases, and feature-driven upgrades like 4K and 8K video and connectivity. Each scenario is reviewed for internal consistency so growth does not outpace realistic unit recovery and pricing behavior.
Data Validation & Update Cycle
Outputs are cross-verified against independent signals like reported category shipment totals, trade direction changes, and price movement indicators, and then the model is checked for outliers by region and camera format. If a variance is too wide, we re-open the assumption trail and trigger follow-up questions with the relevant interview set so the driver is understood.
A multi-step review is followed before sign-off, where calculations, unit conversions, and FX treatment are rechecked, and the logic is challenged by another analyst. The report is refreshed annually, and interim updates are made when material events occur, such as major product cycle shifts or sudden demand changes. Before delivery, we do a final pass so clients receive the latest updated view.
Mordor Intelligence's Digital Camera Market Size Measured Against Other Published Estimates
Published market sizes for digital cameras often do not match because different studies count different products and use different timing for their base year and currency conversion. Differences also come from how each publisher treats the price mix between compact, DSLR, and mirrorless cameras, since unit trends and ASP movement can pull in opposite directions.
In this study, the biggest drivers behind estimate gaps are whether action and 360-degree cameras are included as part of digital cameras, whether bundled lens kits are valued consistently, and whether trade and shipment signals are used to keep regional totals realistic. Some estimates also lean on optimistic unit rebounds or apply broad accessory attachment that inflates revenue without clear unit logic, which can push totals away from what channel sell-through indicates.
Benchmark comparison
| Source | Market Size | Gaps in Research Methodology |
|---|---|---|
| Mordor Intelligence | USD 10.19 B (2026) | |
| Industry Publisher A | USD 7.16 B (2023) | Uses an earlier base year and can fold adjacent camera-related peripherals into the category in parts of the narrative, which shifts totals versus a camera-hardware-only view. |
| Regional Consultancy B | USD 9.77 B (2025) | Positions 2025 as the anchor year and extends the forecast window further out, where higher long-run growth assumptions and regional mix choices can lift the implied revenue path. |
The spread in the table is mostly explained by base-year selection and what gets counted as camera revenue versus adjacent items like kits and action formats, and those choices change the ASP and mix math. By tying the total to shipment and trade checks and keeping the camera-type scope explicit, the estimate stays traceable to clear variables, a discipline applied by Mordor Intelligence.


Key Questions Answered in the Report
How large will the digital camera market be by 2031?
It is projected to reach USD 12.78 billion, expanding at a 4.62% CAGR from 2026.
Which camera type is growing the fastest?
Mirrorless bodies lead with a 6.23% CAGR, rising from 57.85% share in 2025 to dominate by 2031.
Why are content creators important for camera sales?
The creator economy is doubling in value, and creators demand hybrid photo-video tools, driving the segment’s 6.44% CAGR.
What regions drive the most growth?
Asia-Pacific holds 31.42% share and grows at 5.76% thanks to China’s surge in compact-camera demand and regional tourism rebound.
What is the market size in 2026?
USD 10.19 billion in 2026.
Page last updated on:




