Hypersonic Weapons Market Size and Share
Market Overview
| Study Period | 2019 - 2030 |
|---|---|
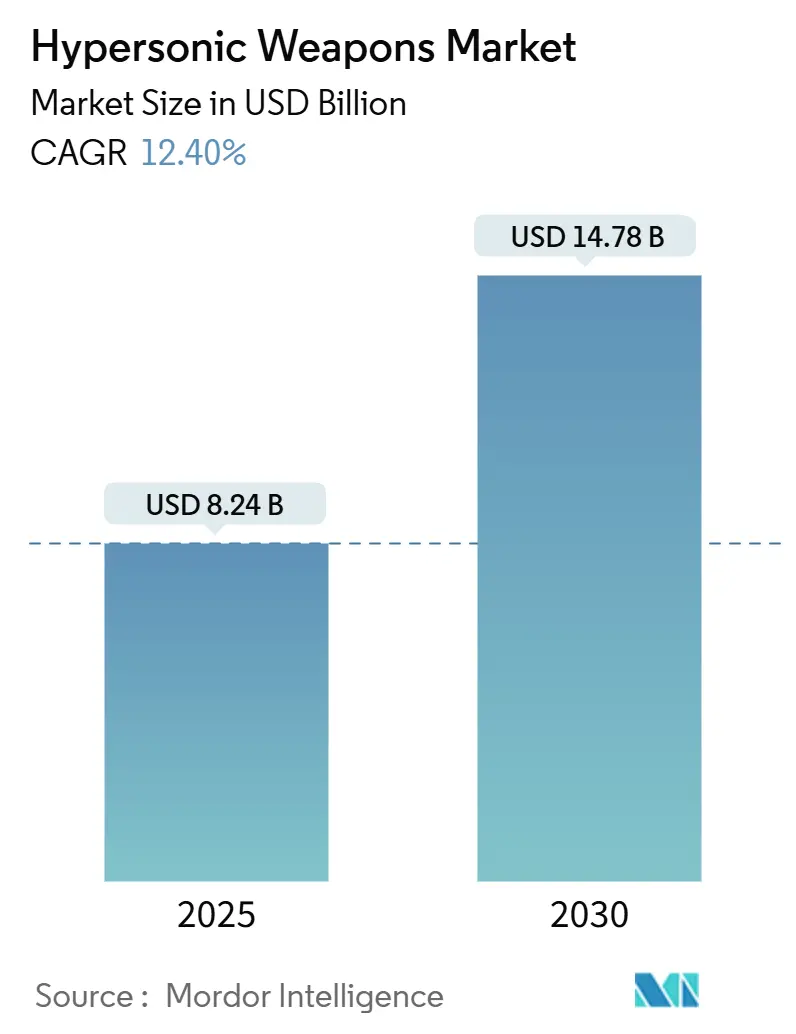
| Market Size (2025) | USD 8.24 Billion |
| Market Size (2030) | USD 14.78 Billion |
| Growth Rate (2025 - 2030) | 12.40% CAGR |
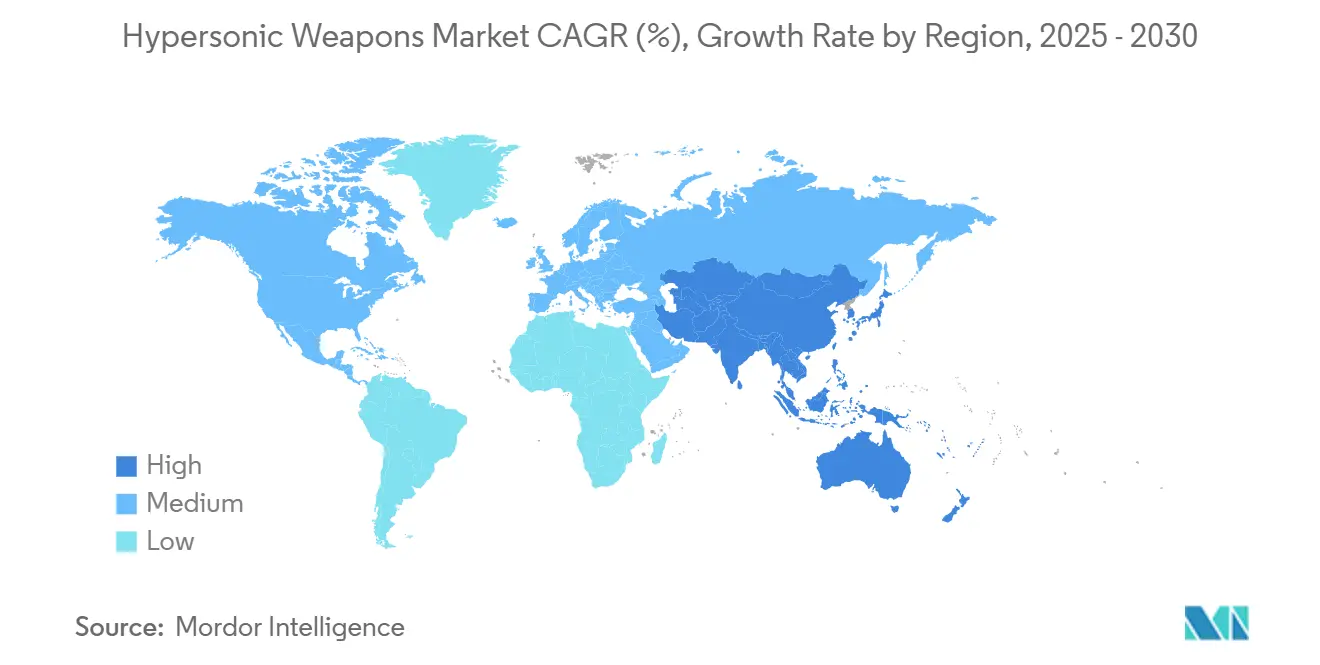
| Fastest Growing Market | Asia Pacific |
| Largest Market | North America |
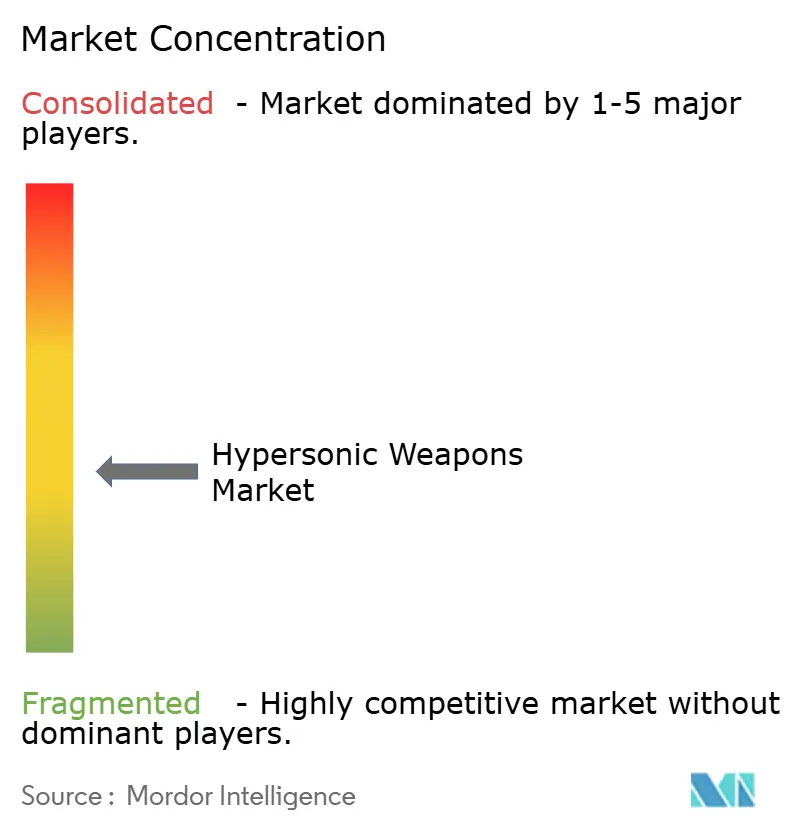
| Market Concentration | Medium |
Major Players *Disclaimer: Major Players sorted in no particular order Image © Mordor Intelligence. Reuse requires attribution under CC BY 4.0. | |
Hypersonic Weapons Market Analysis by Mordor Intelligence
The hypersonic weapons market size stands at USD 8.24 billion in 2025 and is forecasted to reach USD 14.78 billion by 2030, advancing at a 12.4% CAGR. This trajectory is powered by rising great-power rivalries, accelerating materials science breakthroughs, and mounting defense budgets that elevate hypersonic capabilities from experimental status to core strike assets. The US Department of Defense alone earmarked USD 6.9 billion for hypersonic systems in its FY 2025 request, a 47% jump on FY 2023 allocations. Parallel investments in Europe and the Indo-Pacific sustain a procurement race that now spans offensive missiles, glide vehicles, interceptors, and reusable testbeds. Rapid technology spillovers from the commercial space sector compress development cycles, while the scramble to update air- and missile-defense networks creates a second demand front for counter-hypersonic solutions. Together, these forces lock in a double-digit growth outlook for the hypersonic weapons market across the current decade.
Key Report Takeaways
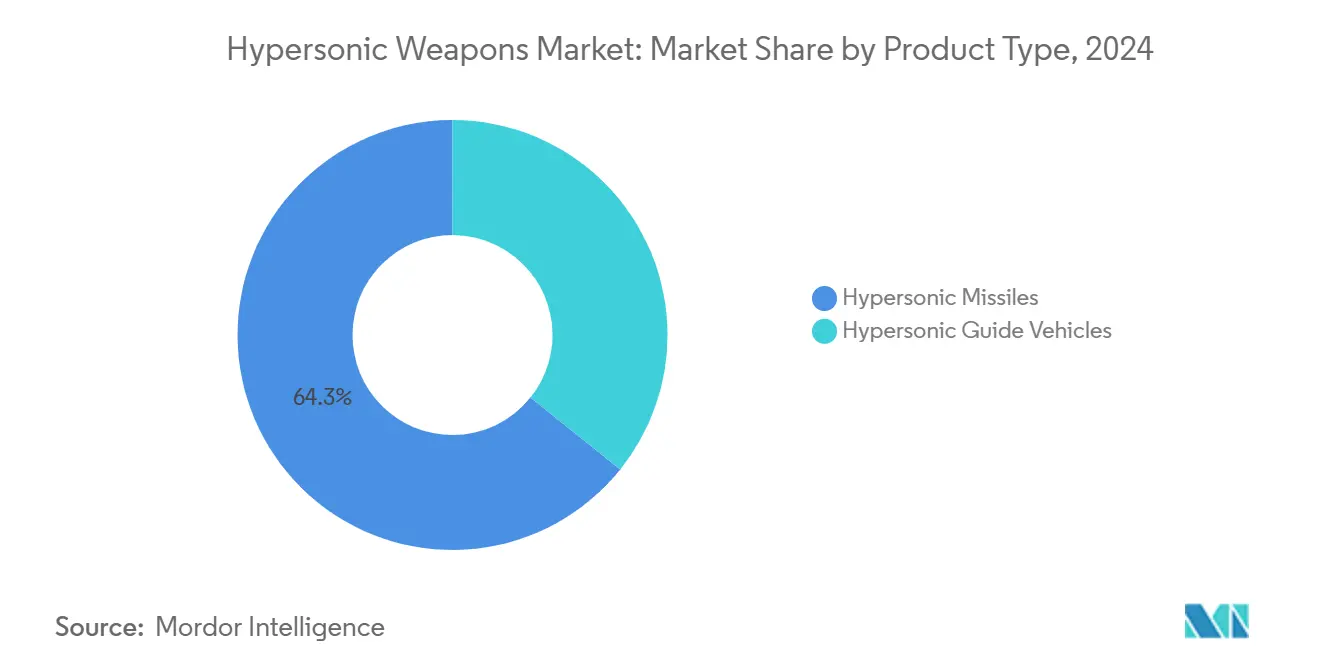
- By product type, hypersonic missiles held 64.25% revenue share in 2024; hypersonic glide vehicles are projected to expand at a 14.21% CAGR through 2030.
- By launch platform, ground-based systems retained 42.76% of the hypersonic weapons market share in 2024, while air-launched solutions are pacing the field with a 13.75% CAGR to 2030.
- By speed class, the Mach 5 to 6 band captured 37.87% share of the hypersonic weapons market size in 2024; systems exceeding Mach 8 are forecasted to surge at a 15.67% CAGR.
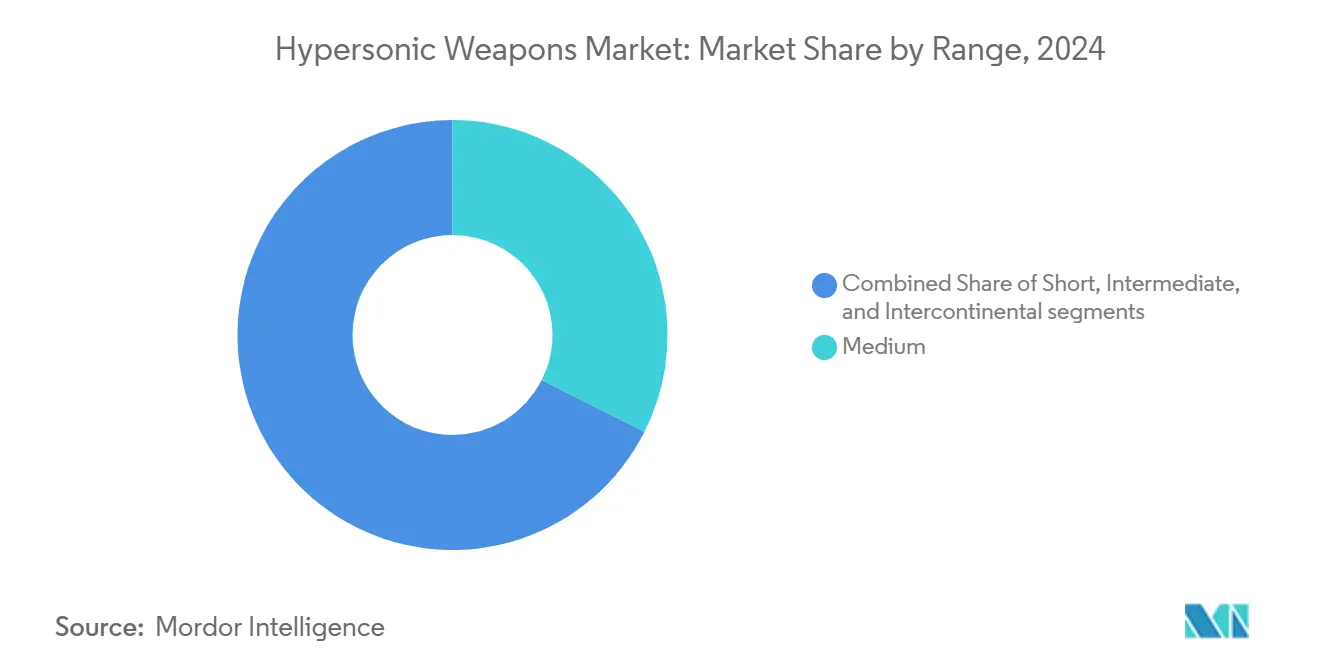
- By range, medium range retained 32.42% of the hypersonic weapons market share in 2024, while intercontinental is pacing the field with a 15.01% CAGR to 2030.
- By subsystem, the propulsion system captured 30.01% share of the hypersonic weapons market size in 2024; boost glides are forecasted to surge at a 15.67% CAGR.
- By geography, North America contributed 36.55% of 2024 global revenue; Asia-Pacific is the fastest-growing region with a 14.47% CAGR through 2030.
Global Hypersonic Weapons Market Trends and Insights
Drivers Impact Analysis*
| Driver | (~) % Impact on CAGR Forecast | Geographic Relevance | Impact Timeline |
|---|---|---|---|
| Escalating geopolitical tensions fueling hypersonic weapons development | +2.8% | United States, China, Russia | Medium term (2–4 years) |
| Increased defense allocations for next-generation strike systems | +2.1% | North America, Europe | Short term (≤ 2 years) |
| Rising obsolescence of conventional missile defense architectures | +1.7% | NATO and allies | Long term (≥ 4 years) |
| Advancements in high-temperature materials for scramjet propulsion | +1.4% | United States, China, Europe | Medium term (2–4 years) |
| Miniaturization of guidance systems enhancing in-flight maneuverability | +1.2% | Semiconductor-intensive economies | Short term (≤ 2 years) |
| Cost reduction through technology transfers from commercial space sector | +0.9% | United States, Europe, select APAC hubs | Long term (≥ 4 years) |
| Source: Mordor Intelligence | |||
Escalating Geopolitical Tensions Fueling Hypersonic Weapons Development
Strategic rivalry among major powers reshapes procurement priorities, making hypersonic strike systems a perceived imperative rather than an optional capability. China’s operational DF-ZF glide vehicle and Russia’s Kinzhal missile changed the threat baseline, prompting allies to fund indigenous responses such as the United Kingdom’s GBP 1 billion (USD 1.34 billion) program and Japan’s HVGP allocation of JPY 200.3 billion (USD 1.36 billion).[1]Wilfred Wan and Gitte du Plessis, “Blurring Conventional–Nuclear Boundaries,” SIPRI, sipri.org Middle-tier states, including South Korea and Australia, pursue homegrown solutions to hedge regional security risks. The resulting arms-race dynamic locks in multiyear budget lines despite wider fiscal pressure, ensuring sustained growth momentum for the hypersonic weapons market.
Increased Defense Allocations for Next-Generation Strike Systems
Government outlays are being redirected from legacy platforms to hypersonic strike capabilities, creating durable contract backlogs for prime contractors. The Pentagon’s hypersonic budget rose from USD 4.7 billion in FY 2023 to USD 6.9 billion in FY 2025, while Germany committed EUR 650 million (USD 758.99 million) to the 3SM Tyrfing program and France accelerates the ASN4G missile roadmap. These multi-year appropriations institutionalize demand, reward execution milestones with follow-on tranches, and catalyze supplier-base expansion across propulsion, materials, and guidance domains.
Rising Obsolescence of Conventional Missile-Defense Architectures
Systems optimized for ballistic or cruise-missile profiles struggle to detect and engage maneuvering hypersonic threats. Upgrade costs for platforms such as Aegis and Patriot feed parallel spending on offensive hypersonic weapons and counter-hypersonic interceptor research. European programs like HYDIS2, financed at EUR 110 million (USD 128.44 million), illustrate how demand for defensive solutions validates the offensive investment cycle, fueling a self-reinforcing market expansion.
Advancements in High-Temperature Materials for Scramjet Propulsion
Breakthroughs in ultra-high-temperature ceramics and carbon-carbon composites enable scramjet engines to survive 2,000°C surface temperatures, extending powered flight duration and range. US testbeds have demonstrated efficiency gains above 15% relative to earlier ramjets, cutting fuel mass and permitting larger payloads. The materials leap opens the hypersonic weapons market to newer entrants possessing additive-manufacturing or ceramics know-how, intensifying competition and pressuring price points.
Restraints Impact Analysis*
| Restraint | (~) % Impact on CAGR Forecast | Geographic Relevance | Impact Timeline |
|---|---|---|---|
| Severe thermal management challenges at sustained hypersonic speeds | -1.8% | Global | Medium term (2–4 years) |
| Restrictive export control frameworks impacting international collaboration | -1.3% | US-allied nations | Long term (≥ 4 years) |
| Limited availability of specialized hypersonic ground-testing infrastructure | -1.1% | Non-superpower states | Short term (≤ 2 years) |
| Uncertain operational doctrine and cost-effectiveness debate | -0.7% | NATO members | Medium term (2–4 years) |
| Source: Mordor Intelligence | |||
Severe Thermal-Management Challenges at Sustained Hypersonic Speeds
Airframe leading-edge temperatures well above 2,000°C force trade-offs among speed, range, and payload. Recent US program cancellations following ARRW flight-test setbacks highlight the cost and schedule impact when thermal solutions underperform.[2]Larry Dickerson, “Hypersonic Weapons Programs Face Scrutiny After ARRW Setbacks,” ForecastInternational, dsm.forecastinternational.com Only firms with deep materials portfolios can consistently meet endurance targets, narrowing the supplier base and extending unit-cost amortization periods.
Restrictive Export-Control Frameworks Impacting International Collaboration
International Traffic in Arms Regulations constrain US prime contractors from sharing critical propulsion and guidance IP with close allies. Partners respond by financing indigenous paths, sometimes duplicating R&D and elongating interoperability timelines. Compliance overhead increases time-to-market for smaller vendors and discourages multinational teaming on front-end concepts.
*Our forecasts treat driver/restraint impacts as directional, not additive. The impact forecasts reflect baseline growth, mix effects, and variable interactions.
Segment Analysis
By Product Type: Missiles Hold the Lion’s Share, Glide Vehicles Accelerate
Missiles represented 64.25% of the hypersonic weapons market in 2024 due to established booster technologies and compatibility with legacy launchers. The segment’s dominance is rooted in cleared-for-use infrastructure and lower doctrinal obstacles relative to novel delivery forms. Glide vehicles lead growth with a 14.21% CAGR as militaries seek maneuver capability that complicates interception.
Advances in boost-glide concepts now validate longer cross-range trajectories and reduced radar cross-sections, encouraging procurement roadmaps that shift funding toward glide-vehicle maturation after 2026. As integration hurdles fall and unit costs drop, glide vehicles are positioned to capture an increasing portion of the hypersonic weapons market size in the second half of the decade.


By Launch Platform: Ground Systems Dominate, Air Launch Gains Momentum
Land launchers held 42.76% of global revenue in 2024, leveraging fixed-site logistics, high payload margins, and ease of integration with existing command-and-control networks. Yet air-launched designs are projected to grow at 13.75% CAGR, favored for their mobile basing flexibility that shortens decision-to-launch timelines. The F-35 road map to carry long-range hypersonic rounds exemplifies the shift from static to maneuver forces.
Future doctrine envisions dispersed airfields and ramp-launched theater missiles, enhancing survivability against pre-launch targeting. As airframe certification expands, air launch is set to rebalance the hypersonic weapons market share between domains.
By Range: Medium Range Rules for Now, Intercontinental Capacity Rises
Medium-range profiles (300 to 1,500 km) held 32.42% revenue in 2024, aligning with regional deterrence concepts that avoid strategic escalation. Intercontinental concepts above 5,500 km are expected to log a 15.01% CAGR, primarily within US, Russian, and Chinese programs designed for global strike without forward basing.
Short-range and theater variants continue to unlock tactical utility—striking time-sensitive threats while remaining within politically palatable reach. Growing intercontinental R&D signals a hedging posture against peer-level defense upgrades, augmenting layered deterrent architectures.
By Speed Class: Mach 5 to 6 Leads, Mach 8+ Heads the Growth Curve
Systems cruising between Mach 5 and 6 commanded 37.87% revenue in 2024, offering the best compromise between achievable materials performance and operational payoffs. Investment now tilts toward Mach 8+ designs, forecasted to post a 15.67% CAGR, as defense planners pursue time-on-target windows too narrow for current interceptors.
Intermediate Mach 6 to 8 projects are technology bridges that harden thermal-protection schemes before migrating to ultra-high-speed applications. As reliability proofs accumulate, Mach 8+ weapons will account for a larger slice of the hypersonic weapons market size by 2030.
By Subsystem: Propulsion Drives Spending, Boost-Glide Modules Surge
Propulsion captured 30.01% of subsystem outlays in 2024 as scramjet and advanced rocket motors remain the costliest and most technologically intensive elements of any build. Boost-glide modules are the fastest riser at 13.42% CAGR, reflecting demand for autonomous lift generation that stretches range envelopes without extra propellant.
Miniaturized, radiation-hardened seekers and modular warheads show incremental gains but rely on propulsion breakthroughs to translate into mission reach. As suppliers adopt additive manufacturing for engine parts, propulsion’s share of the hypersonic weapons market size will gradually taper but remain the foremost cost driver.
Geography Analysis
North America generated 36.55% of 2024 worldwide revenue, anchored by the Pentagon’s USD 6.9 billion development budget and a deep industrial base active in propulsion, materials, and guidance. The region also fields the most extensive flight-test corridor, highlighted by Stratolaunch’s reusable Talon-A flights that deliver repeated hypersonic test shots at reduced marginal cost. Program delays such as the ARRW cancellation illustrate execution risk but have not slowed congressional appetite for continued R&D.
Asia-Pacific is the fastest-expanding theater at a 14.47% CAGR. China’s deployed DF-ZF and Russia-aligned programs spur neighbors to accelerate indigenous initiatives. India’s DRDO recorded a Mach 10 cruise-missile test in 2024, while Japan funds a multi-phase glide-vehicle plan. Through AUKUS Pillar 2, Australia collaborates with the United States and the United Kingdom on scramjet research, broadening regional supply-chain participation.[3]Jerome Brahy, “Stratolaunch Achieves Key Hypersonic Milestone,” ArmyRecognition, armyrecognition.com
Europe balances sovereignty with alliance commitments, splitting procurement across multinational and national lines. Germany’s EUR 650 million (USD 758.94 million) 3SM Tyrfing effort embodies the drive for domestic capability, whereas MBDA’s HYDIS2 pools 14 nations on an interceptor to defend against future hypersonic salvos. The United Kingdom and France advance distinct offensive programs but share test data to mitigate cost, illustrating how geopolitical cohesion and autonomy coexist in the European hypersonic weapons market.

Competitive Landscape
Lockheed Martin Corporation, RTX Corporation, and Northrop Grumman Corporation dominate prime contracts, applying long-cycle design-development frameworks honed on ballistic-missile and space-launch programs. Their strengths lie in systems integration, secure supply chains, and cleared workforces capable of meeting classified mission requirements. Recent award data confirms this positioning, with Lockheed securing USD 1 billion in hypersonic program wins during 2025 and Northrop advancing a classified scramjet demonstrator for the US Navy.
Mid-tier specialists such as Kratos Defense & Security Solutions, Inc. gain share by supplying test beds and low-cost attritable vehicles; the firm’s USD 1.45 billion MACH-TB award funds a production line dedicated to rapid-iteration prototypes.[4]Michael Tyrrell, “Kratos Awarded $1.45 Billion for Hypersonic Test Bed,” AeroMagazine, aero-mag.com European champions MBDA and Kongsberg couple national funding with export-oriented architectures to position for NATO commonality requirements, while Asian state-owned enterprises leverage sovereign budgets to accelerate full-stack vertical integration.
Competitive differentiation now hinges on materials IP, high-rate additive manufacturing, and digital-engineering tools that shrink design-to-flight intervals. However, commercial-space entrants promise disruptive cost curves, stringent military-qualification thresholds filter defense primes or joint ventures with mature quality-assurance processes.
Hypersonic Weapons Industry Leaders
Lockheed Martin Corporation
RTX Corporatiom
Northrop Grumman Corporation
The Boeing Company
China Aerospace Science and Technology Corporation (CASC)
- *Disclaimer: Major Players sorted in no particular order

Recent Industry Developments
- June 2025: The US Navy awarded Lockheed Martin Corporation a USD 1 billion contract modification for the Conventional Prompt Strike (CPS) hypersonic weapons program. The modification encompasses program management, engineering development, systems integration, procurement of long-lead materials, and development of specialized tools and equipment.
- May 2024: The US Army awarded Lockheed Martin Corporation a USD 756 million contract to enhance the Long-Range Hypersonic Weapon (LRHW) system. The contract includes delivering additional LRHW battery equipment, systems, software engineering support, and logistics solutions.


Global Hypersonic Weapons Market Report Scope
| Hypersonic Missiles |
| Hypersonic Guide Vehicles |
| Ground-based |
| Sea-based |
| Air-launched |
| Space-launched |
| Mach 5 to 6 |
| Mach 6 to 8 |
| More than Mach 8 |
| Short |
| Medium |
| Intermediate |
| Intercontinental |
| Guidance System |
| Propulsion System |
| Boost Glide |
| Warheads |
| North America | United States | |
| Canada | ||
| Mexico | ||
| Europe | United Kingdom | |
| France | ||
| Germany | ||
| Italy | ||
| Russia | ||
| Rest of Europe | ||
| Asia-Pacific | China | |
| India | ||
| Japan | ||
| South Korea | ||
| Australia | ||
| Rest of Asia-Pacific | ||
| South America | Brazil | |
| Rest of South America | ||
| Middle East and Africa | Middle East | Saudi Arabia |
| United Arab Emirates | ||
| Rest of Middle East | ||
| Africa | South Africa | |
| Rest of Africa | ||
| By Product Type | Hypersonic Missiles | ||
| Hypersonic Guide Vehicles | |||
| By Launch Platform | Ground-based | ||
| Sea-based | |||
| Air-launched | |||
| Space-launched | |||
| By Speed Class | Mach 5 to 6 | ||
| Mach 6 to 8 | |||
| More than Mach 8 | |||
| By Range | Short | ||
| Medium | |||
| Intermediate | |||
| Intercontinental | |||
| By Subsystem | Guidance System | ||
| Propulsion System | |||
| Boost Glide | |||
| Warheads | |||
| By Geography | North America | United States | |
| Canada | |||
| Mexico | |||
| Europe | United Kingdom | ||
| France | |||
| Germany | |||
| Italy | |||
| Russia | |||
| Rest of Europe | |||
| Asia-Pacific | China | ||
| India | |||
| Japan | |||
| South Korea | |||
| Australia | |||
| Rest of Asia-Pacific | |||
| South America | Brazil | ||
| Rest of South America | |||
| Middle East and Africa | Middle East | Saudi Arabia | |
| United Arab Emirates | |||
| Rest of Middle East | |||
| Africa | South Africa | ||
| Rest of Africa | |||


Key Questions Answered in the Report
What is the current global value of the hypersonic weapons sector?
The hypersonic weapons market size is estimated at USD 8.24 billion in 2025.
How fast is revenue expected to grow through 2030?
Market revenue is projected to rise at a 12.4% CAGR, reaching USD 14.78 billion by 2030.
Which region generates the highest sales?
North America leads with 36.55% of global 2024 revenue due to concentrated US funding.
Which region is expanding the fastest?
Asia-Pacific shows the strongest momentum with a forecast 14.47% CAGR through 2030.
Which product category dominates current demand?
Hypersonic missiles account for 64.25% of 2024 revenue, reflecting deployment readiness.
What speed class is projected to see the most growth?
Systems flying above Mach 8 are set to grow at roughly 15.67% CAGR as militaries seek near-uninterceptable velocity envelopes.
Page last updated on:


