
Remote Weapon Systems Market Size and Share
Market Overview
| Study Period | 2025 - 2031 |
|---|---|
| Market Size (2026) | USD 14.60 Billion |
| Market Size (2031) | USD 23.45 Billion |
| Growth Rate (2026 - 2031) | 9.95 % |
| Fastest Growing Market | Latin America |
| Largest Market | North America |
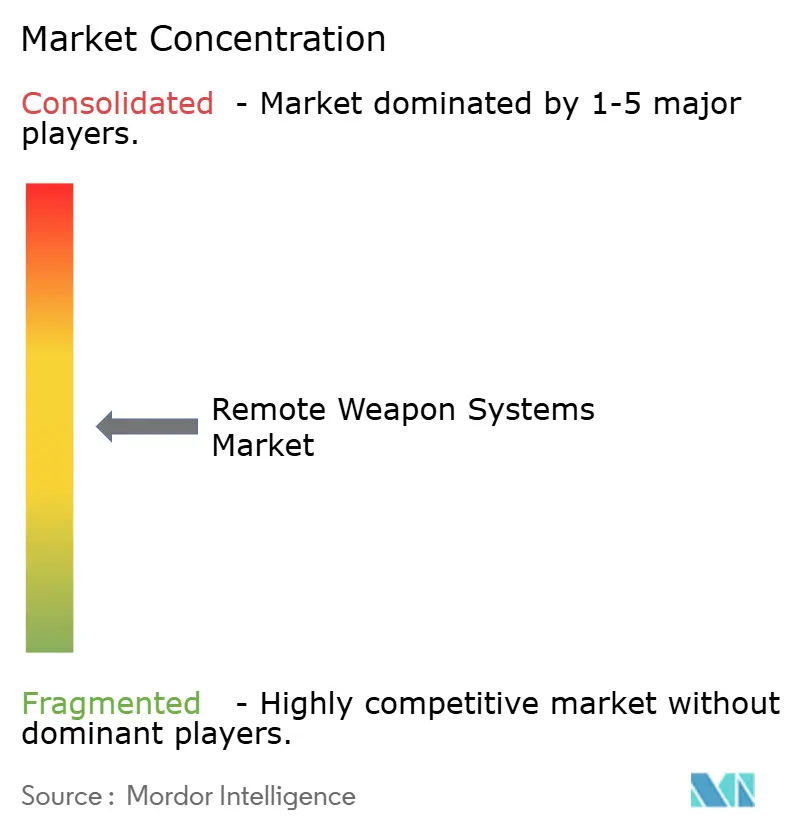
| Market Concentration | Medium |
Major Players *Disclaimer: Major Players sorted in no particular order Image © Mordor Intelligence. Reuse requires attribution under CC BY 4.0. | |
Remote Weapon Systems Market Analysis by Mordor Intelligence
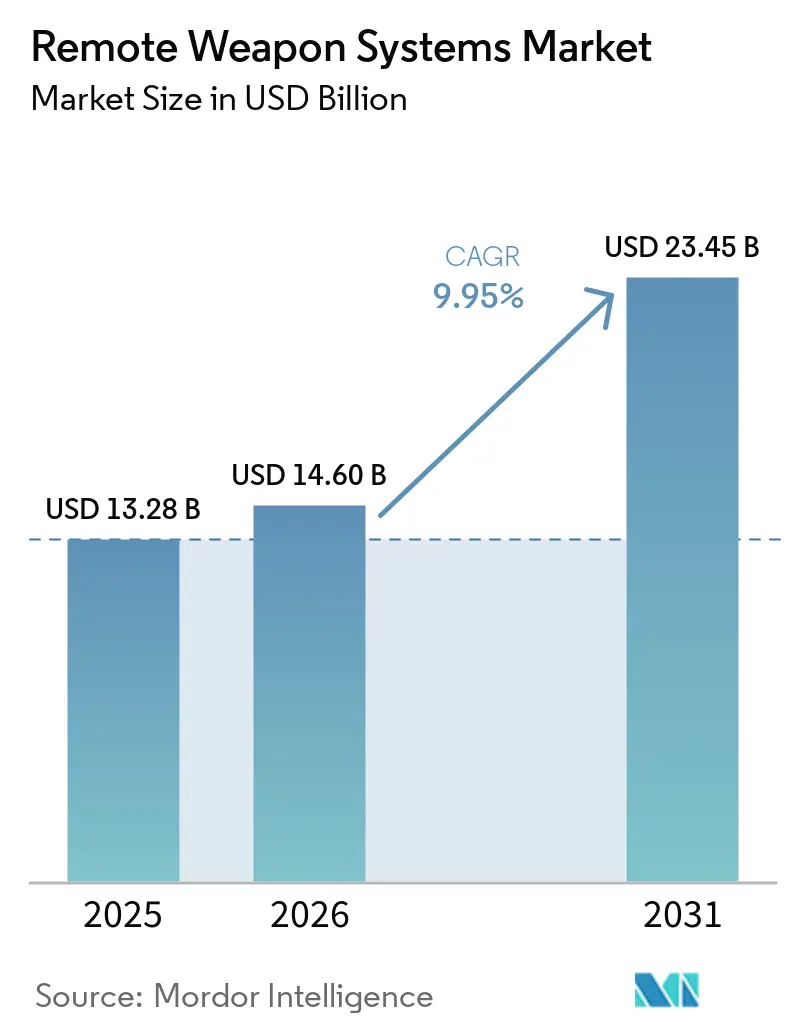
The remote weapon systems market size is expected to grow from USD 13.28 billion in 2025 to USD 14.6 billion in 2026 and is forecast to reach USD 23.45 billion by 2031 at 9.95% CAGR over 2026-2031. This momentum stems from accelerating defense-modernization programs, rising demand for standoff engagement solutions, and rapid technological advances in autonomous fire-control software. Land forces continue to retrofit armored fleets with medium-caliber systems, while navies incorporate stabilized mounts on patrol vessels to counter drone and small-boat threats. Homeland security agencies also adopt RWS for border surveillance, expanding the customer base beyond traditional military users. Meanwhile, artificial-intelligence-enabled target-recognition modules improve accuracy and reduce operator workload, driving procurement of next-generation variants. International suppliers leverage long-term service contracts and offset arrangements to secure repeat business, although component shortages and export-control rules create recurring supply-chain challenges.
Key Report Takeaways
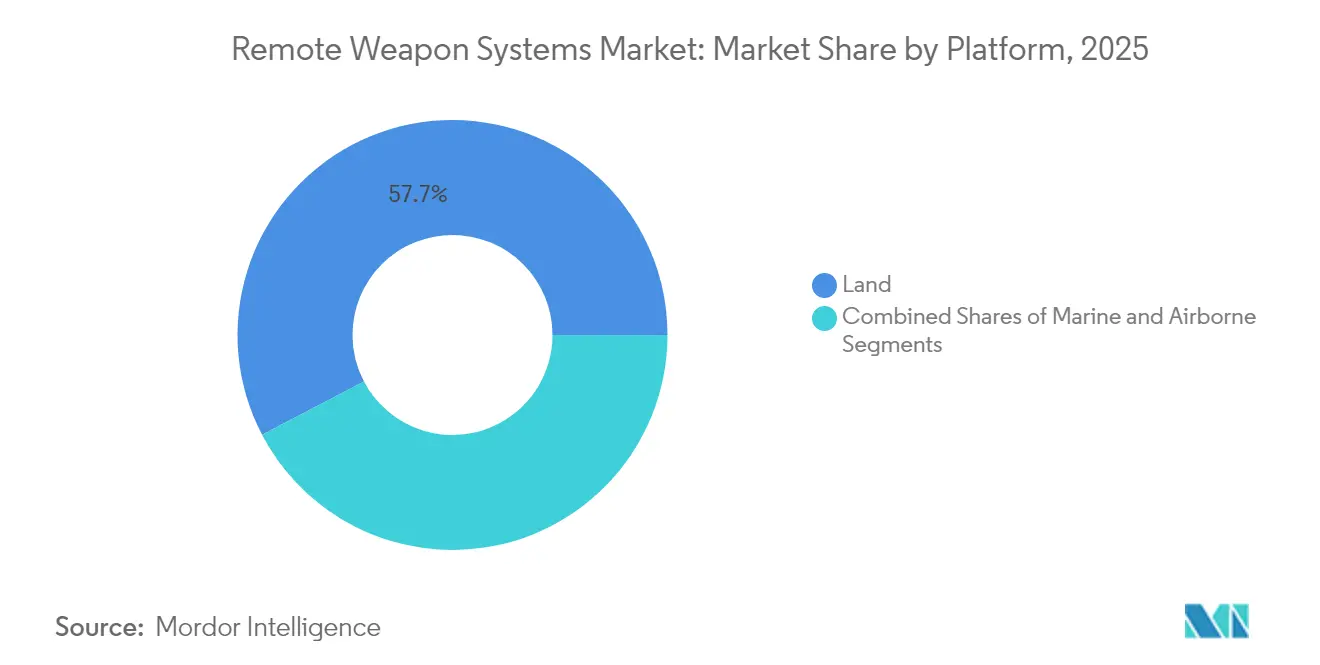
- By platform, land systems commanded 57.68% of the remote weapon systems market share in 2025 and are projected to advance at a 10.12% CAGR through 2031.
- By weapon type, medium-caliber units secured 46.10% of the remote weapon systems market share in 2025, and missile-integrated stations are forecast to register the fastest 10.06% CAGR between 2026 and 2031.
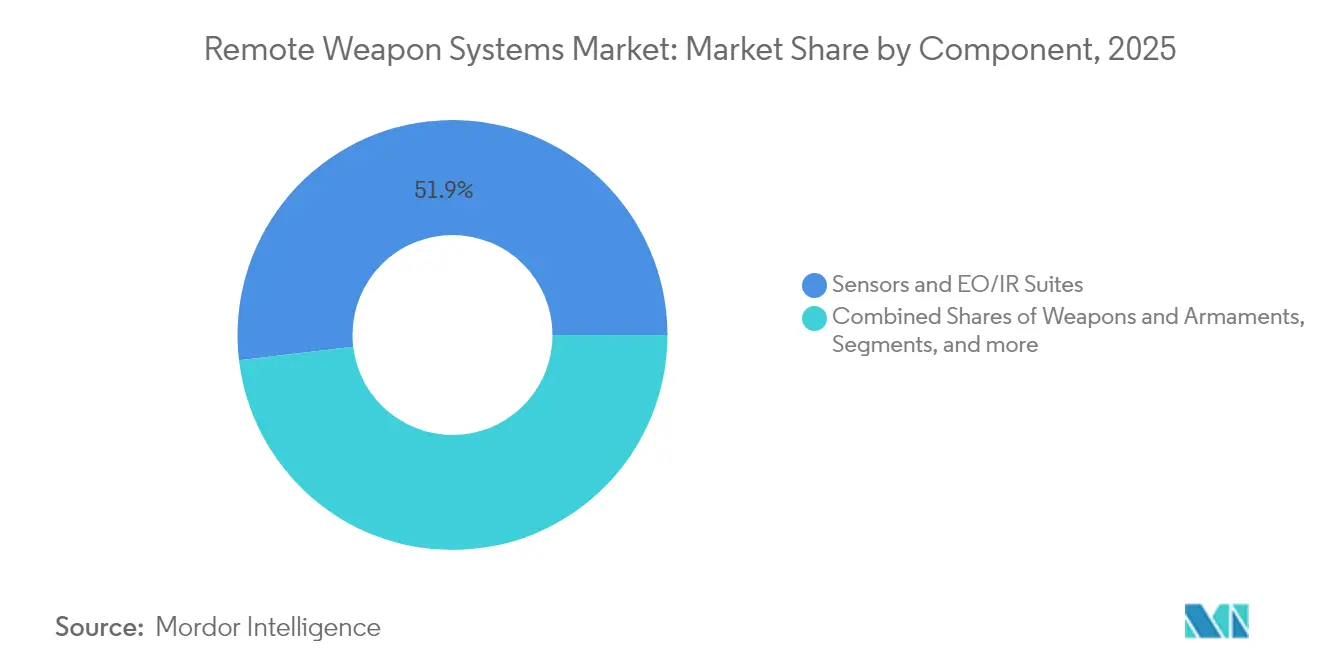
- By component, sensors and EO/IR suites accounted for a 51.88% share of the remote weapon systems market size in 2025, and weapons and armaments led growth at a 10.14% CAGR through 2031.
- By end-user, military customers held 77.65% of the remote weapon systems market share in 2025, and homeland security applications represent the quickest rise with a 10.08% CAGR to 2031.
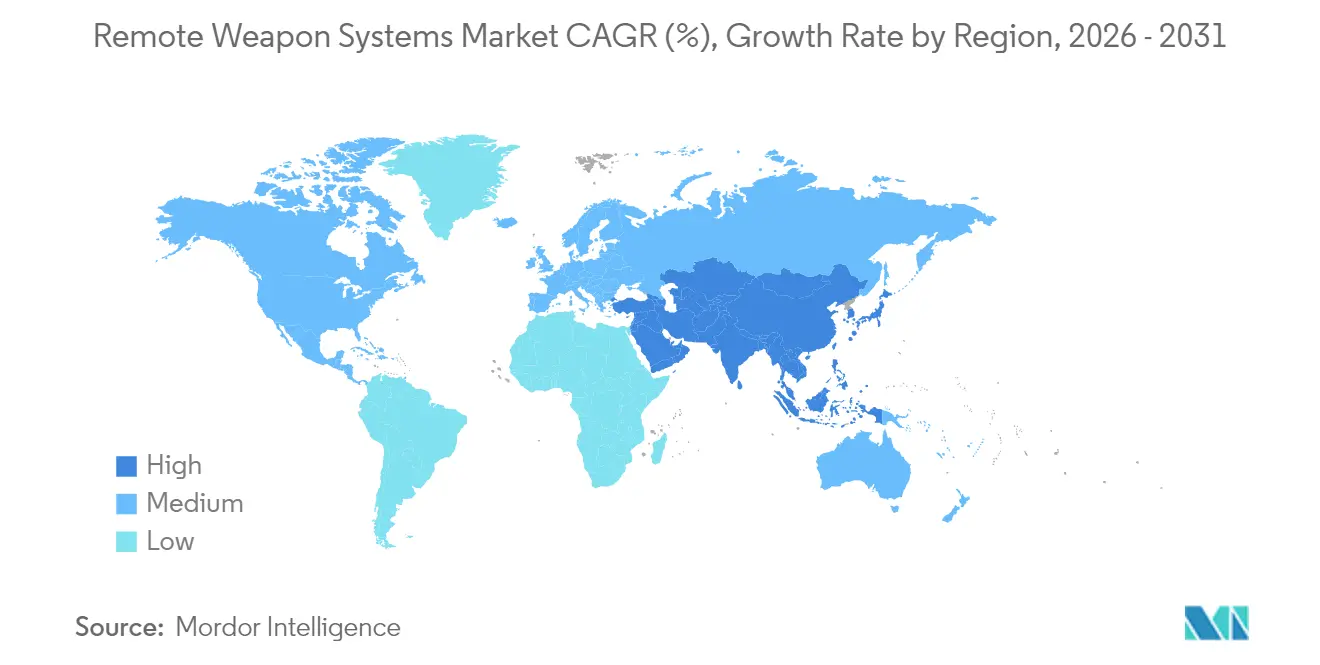
- By geography, Europe generated 42.20% of 2025 revenue for the remote weapon systems market, and the Asia-Pacific is poised for the fastest regional growth at a 10.02% CAGR through 2031.
Note: Market size and forecast figures in this report are generated using Mordor Intelligence’s proprietary estimation framework, updated with the latest available data and insights as of 2026.
Market Trends and Insights
Drivers Impact Analysis of Remote Weapon Systems Market*
| Driver | (~) % Impact on CAGR Forecast | Geographic Relevance | Impact Timeline |
|---|---|---|---|
| Surging demand for unmanned ground combat vehicles | +2.1% | Global, with concentration in North America and Europe | Medium term (2-4 years) |
| Shift toward medium-caliber (20–40 mm) RWS on IFVs and OPVs | +1.8% | Europe and Asia-Pacific, spillover to Middle East | Short term (≤ 2 years) |
| Integration of AI-enabled auto-tracking fire-control suites | +1.5% | North America and Europe, expanding to Asia-Pacific | Long term (≥ 4 years) |
| Spiking Indo-Pacific naval modernization programs | +1.3% | Asia-Pacific core, spillover to Middle East | Medium term (2-4 years) |
| Retrofit programs for legacy armored fleets in Europe | +1.0% | Europe, selective adoption in NATO allies | Short term (≤ 2 years) |
| Miniaturized sensors enabling UAV-borne RWS | +0.8% | Global, led by North America and Europe | Long term (≥ 4 years) |
| Source: Mordor Intelligence | |||
Surging Demand for Unmanned Ground Combat Vehicles
Growing investment in unmanned ground vehicles elevates the need for modular weapon stations designed for autonomous platforms. The US Army Robotic Combat Vehicle program, various NATO experimentation projects, and operational lessons from Ukraine demonstrate how remotely armed UGVs can deliver reconnaissance and direct-fire support while minimizing troop exposure.[1]Patrick Tucker, “Army Robotic Combat Vehicle Moves Ahead,” Defense One, defenseone.com European supplier Milrem Robotics reported triple-digit order growth for its THeMIS UGV in 2024, with most configurations integrating partner-supplied RWS.[2]Tom Kington, “Milrem Robotics Triples THeMIS Orders,” Defense News, defensenews.com These initiatives create standardized interface requirements, accelerating volume production of adaptable mounts and associated sensor suites. Continuous AI improvements further align with unmanned concepts, enabling semi-autonomous engagements that comply with evolving rules of engagement. The trend is expected to sustain medium-term demand as forces formalize procurement objectives and field operational units across multiple echelons.
Shift toward Medium-Caliber RWS on IFVs and OPVs
Global procurement teams favor 20–40 mm armaments for infantry fighting vehicles and offshore patrol vessels to defeat lightly armored vehicles, drones, and fortified positions. Poland’s USD 704.96 million ZSSW-30 turret purchase, destined for Borsuk IFVs, epitomizes this pivot.[3]Poland MOD, “ZSSW-30 Contract Details,” defence24.pl On the maritime side, Leonardo’s MARLIN-WS has completed sea trials aboard Italian patrol ships, confirming demand for stabilized naval mounts.[4]Leonardo SpA, “MARLIN-WS Sea Trials Completed,” naval-technology.com Medium-caliber ammunition delivers higher lethality without the logistical burdens of missile logistics, aligning with NATO STANAGs for ammunition interchangeability. The combination of versatile ammunition natures, armor penetration, and cost advantage drives short-term procurement decisions, especially for upgrade programs seeking rapid battlefield effect.
Integration of AI-enabled Auto-Tracking Fire-Control Suites
Artificial-intelligence algorithms embedded in fire-control computers automate target detection, classification, and ballistic corrections. Systems such as the Ukrainian Wolly leverage machine learning to distinguish legitimate threats in complex urban backdrops, reducing cognitive load on crews. Israeli vendors integrate similar tools, producing predictive lead calculations for drone and fast-boat targets. AI supports manning-reduction strategies and improves first-round hit probability, appealing to navies and border-security agencies with limited personnel. Nonetheless, controlled-export regulations under ITAR and the Wassenaar Arrangement complicate international sales, requiring suppliers to institute compliance checkpoints throughout the design cycle. Longer term, as algorithmic performance matures and ethical-use guidelines clarify, AI-rich RWS are expected to dominate new-build platforms.
Spiking Indo-Pacific Naval Modernization Programs
Rising maritime tensions in the South and East China Seas prompt coastal states to acquire offshore patrol vessels equipped with RWS capable of 360-degree coverage. China fields indigenous mounts across its expanding coast-guard and naval inventory, while India’s Project 17A stealth frigates integrate foreign-supplied systems under technology-transfer clauses. The US facilitates acquisitions through Foreign Military Sales (FMS), most recently approving advanced fire-control suites for Taiwan. Singapore Technologies Engineering has enlarged production lines to meet regional contracts, combining low-observable housings with digital night-vision cameras. As regional defense budgets rise, multi-domain deterrence concepts push navies to embed networked RWS on both major surface combatants and auxiliary craft.
Restraints Impact Analysis of Remote Weapon Systems Market*
| Restraint | (~) % Impact on CAGR Forecast | Geographic Relevance | Impact Timeline |
|---|---|---|---|
| Escalating space-debris collision risk and stricter disposal rules | −0.5% | Global, concentrated in space-faring nations | Long term (≥ 4 years) |
| Spectrum-sharing conflicts with terrestrial 5G/6G incumbents | −0.8% | North America and Europe, expanding globally | Medium term (2-4 years) |
| High terminal cost hindering adoption in low-income regions | −1.2% | Africa, Latin America, parts of Asia | Short term (≤ 2 years) |
| Talent and specialized-component supply-chain shortages | −1.5% | Global, most acute in North America and Europe | Medium term (2-4 years) |
| Source: Mordor Intelligence | |||
High Terminal Cost Hindering Adoption in Low-Income Regions
Unit prices ranging from USD 200,000 to USD 2 million create substantial barriers for African, Latin-American, and smaller Asian militaries. Limited budgets prioritize troop transport and sustainment over advanced fire-control electronics. Lifetime costs grow when factoring in training simulators, maintenance spares, and specialized ammunition, deterring cash-strapped agencies despite potential force-protection benefits. Regional manufacturers attempt stripped-down variants, but capability trade-offs often reduce export appeal. International grants and foreign military financing programs mitigate capital expenditure in select cases, yet administrative delays and political scrutiny prolong acquisition cycles.
Talent and Specialized-Component Supply-Chain Shortages
Defense OEMs face prolonged lead times for semiconductors, precision gearing, and infrared detectors. In 2024, average delivery for mission-critical chips exceeded 50 weeks, driving inventory costs higher and delaying ship-set deliveries. Skilled machinists and software engineers are similarly scarce as commercial tech firms lure talent with higher pay. Manufacturers respond by dual-sourcing, vertical integration of sub-assemblies, and workforce-development partnerships with vocational institutes. Export-control checks further slow onboarding of alternative non-US suppliers, compounding medium-term production challenges.
*Our forecasts treat driver/restraint impacts as directional, not additive. The impact forecasts reflect baseline growth, mix effects, and variable interactions.
Remote Weapon Systems Market Segment Analysis
By Platform:
Land Dominance Drives Market GrowthLand systems accounted for 57.68% of the remote weapon systems market share in 2025, driven by NATO armored-vehicle upgrades and emerging unmanned ground combat programs. Within this domain, the remote weapon systems market size for infantry fighting vehicles alone is estimated to grow at a 10.12% CAGR to 2031. Replacement of manually aimed cupola guns with stabilized turrets enhances survivability and aligns with network-centric doctrine. Rapid-fire medium-caliber mounts, often combined with anti-tank guided missiles, allow multi-role employment against drones and light armor. Supplier frameworks typically bundle training, spares, and in-country assembly to satisfy offset quotas, reinforcing local industry participation and political buy-in.
Marine platforms represent the second-largest revenue pool, driven by the expansion of the Indo-Pacific fleet. Patrol craft, corvettes, and amphibious ships deploy twin-axis mounts offering sea-state compensation and 360-degree coverage. The market segment’s broad adoption reflects increased deterrence against piracy, fisheries protection, and littoral surveillance tasks. Airborne integration remains a niche but promising area, with helicopter door-gun replacements and UCAV pods under evaluation by special operations units, creating overlap with the aerial smart weapons market. As airframe vibration and recoil challenges are eased through the use of lightweight dampers, the segment expects steady, if modest, contributions to overall growth.



By Weapon Type:
Medium-Caliber Systems Lead Market EvolutionMedium-caliber cannons delivered 46.10% of the remote weapon systems market share in 2025. Ongoing conflicts underscore the value of programmable air-burst ammunition and higher muzzle energy in counter-drone roles. The remote weapon systems market size linked to 20–40 mm calibers is projected to expand at a 9.18% annual rate, outpacing the small-caliber segment. Operators cite ammunition commonality with legacy autocannons and superior standoff lethality as procurement rationales. Interoperability with NATO 30 mm stockpiles also simplifies logistical chains during coalition deployments.
Missile-integrated stations, which currently hold only a 9.85% share, are projected to record the fastest trajectory at a 10.06% CAGR, reflecting the demand for multi-domain lethality. Evolution toward lightweight coaxial launchers enables vehicles to neutralize armored threats without the need for dedicated missile turrets. Small-caliber options (≤12.7 mm) continue to attract cost-sensitive buyers and non-military agencies, particularly for border security surveillance towers. Non-lethal payload stations fill a growing homeland-security niche by combining dazzlers, acoustic devices, and pepper-ball launchers, particularly around critical-infrastructure perimeters.
By Component:
Sensors Drive Technological AdvancementSensors and EO/IR suites accounted for 51.88% of component revenue in 2025, due to their pivotal role in target acquisition and day/night engagement. High-definition thermal imagers, laser range finders, and low-light cameras integrate with ballistic computers to calculate firing solutions within milliseconds. The remote weapon systems market size for sensor packages is projected to benefit from steady 8.64% forward growth, paralleling rising miniaturization and cost reductions in uncooled detectors. Multispectral fusion expands threat-classification accuracy, a prerequisite for semi-autonomous rules of engagement.
Weapons and armaments represent the fastest-growing component segment at 10.14% CAGR, driven by demand for ammunition versatility, guided-projectile integration, and advanced recoil mitigation. Stabilization units feature active gyros and electromechanical drives, maintaining on-target capability as vehicles navigate rough terrain. Human-machine interfaces are transitioning to touch-panel displays and wearable augmented-reality goggles, aligning with broader soldier digitization programs. All subsystems must meet MIL-STD-810 for environmental ruggedness and MIL-STD-461 for electromagnetic compatibility, elongating development timelines but ensuring cross-platform suitability.
By End-User:
Military Applications Dominate MarketMilitary agencies accounted for 77.65% of the 2025 remote weapon systems market share, driven by force-protection mandates and doctrinal shifts toward networked lethality. High-tempo operations in Eastern Europe, the Middle East, and the Indo-Pacific region are pushing armies and navies to rapidly modernize their firing platforms. Standardization on modular RWS simplifies maintenance, enables rapid technology insertion, and ensures platform commonality across fleets. The RWS industry also sees military preference for turnkey in-country support, stimulating cooperative manufacturing deals.
Homeland security and law enforcement customers represent the fastest growth, with a 10.08% CAGR. Border Patrol agencies integrate RWS on surveillance towers and fast interceptors to deter smuggling, while critical infrastructure operators adopt non-lethal variants. Procurement criteria differ from the military segment, emphasizing lower recoil, simplified user training, and compliance with domestic engagement rules. Suppliers respond with commercial-off-the-shelf architectures, remote operator consoles, and scalable lethality modules to broaden addressable demand.
Geography Analysis
Europe Remote Weapon Systems Market
Europe led the remote weapon systems market in 2025 with 42.20% revenue share. Funding surges under NATO’s defense-spending pledges accelerate armored-vehicle retrofits and naval patrol-boat acquisitions. Germany’s Puma and Belgium’s Jaguar programs highlight multi-nation procurement synergies, while Poland’s ZSSW-30 contract reshapes Eastern Europe’s supply chain. Regional manufacturers benefit from export-credit agencies and European Defence Fund grants that subsidize R&D and joint-venture factories. Robust after-sales networks, centralized training centers, and shared munition stockpiles reinforce long-term customer lock-in.
APAC and North America Remote Weapon Systems Market
Asia-Pacific exhibited the highest growth rate at 10.02% CAGR through 2031. Maritime disputes, submarine proliferation, and drone incursions motivate regional fleets to adopt stabilized weapon mounts. Domestic-production mandates in India and Indonesia encourage technology-transfer agreements, amplifying local content without sacrificing performance benchmarks. China’s volume-driven demand supports economies of scale for electro-optic sensor arrays, placing pricing pressure on Western suppliers. Yet the US Foreign Military Sales pathways maintain influence in Taiwan, South Korea, and the Philippines, balancing market dynamics.
North America, MEA and LATAM Remote Weapon Systems Market
North America remains a strategic hub due to the US modernization programs. The Marine Corps amphibious combat vehicle and Army robotic-combat‐vehicle initiatives require AI-ready turrets and common control stations. Canadian armored-support-vehicle upgrades add incremental demand, although export-control constraints channel production primarily to allied customers. The Middle East registers selective acquisitions driven by border-security imperatives and counter-UAS requirements, whereas Africa and Latin America stay cost-constrained despite emerging illicit-trafficking challenges.

Regulatory Landscape
Remote weapon systems (RWS) are shaped by overlapping weapon-safety, autonomy, and export-control regimes that increasingly cover software-enabled targeting and sensor fusion. In the United States, DoD Directive 3000.09 sets requirements for autonomy in weapon systems, which affects verification and validation expectations for RWS that include automated target recognition or other autonomous functions. DoD Instruction 5000.69 also requires Joint Services Weapon System Safety reviews for weapon systems used by two or more DoD components, influencing common configurations and documentation packages across major programs.
Exportability is a core constraint and differentiator. The US State Department Directorate of Defense Trade Controls (DDTC) regulates defense articles and technical data under ITAR for many RWS configurations, particularly when they are integrated into combat platforms or paired with sensitive software, increasing compliance workload for primes and subsystem suppliers. In Europe, the Common Military List of the European Union was updated on 23 February 2026, reinforcing harmonized control baselines that affect cross-border transfers of complete stations, sensor payloads, and related technical data within and outside the EU.
Value Chain Analysis
The RWS value chain begins with specialized inputs (electro-optics, infrared detectors, laser rangefinders, computing modules, precision drives and gearboxes, stabilized gimbals, and ruggedized operator interfaces), and then extends through subsystem manufacture, system integration, platform qualification, and through-life sustainment. Sensor and fire-control integration is a key value driver, since EO/IR suites and associated processing dominate many configurations. Stabilization units and recoil management also strongly influence performance on moving land and marine platforms. MIL-STD environmental and electromagnetic compliance engineering and weapon-safety documentation are built into design and qualification, which increases time and cost but supports multi-platform reuse.
Downstream, primes and platform OEMs (armored vehicle and naval ship integrators) increasingly procure RWS via multi-year frameworks that bundle spares, training, and depot-level support. Offset and local-assembly provisions influence where final integration occurs. Recent program activity reflects this structure: Patria contracted Kongsberg for PROTECTOR RS4 deliveries for German and Swedish CAVS 6x6 vehicles (February 2026), while General Dynamics Land Systems selected EOS Defense Systems USA for a major US Army ground combat platform with manufacturing centered in Huntsville, Alabama (announced 2026). Tier-2 suppliers provide machined and electromechanical components into these programs, and the chain remains sensitive to bottlenecks in semiconductors, precision gearing, and IR detector availability.
Competitive Landscape
The market features moderate consolidation, with top players holding a significant share. Kongsberg Gruppen, Elbit Systems, and Rafael Advanced Defense Systems anchor leadership positions through decades-long user relationships and proprietary sensor-fusion technology. Recent product-launch cycles introduce AI-driven target recognition, modular missile adaptors, and next-generation stabilization, sustaining competitive differentiation. Aerospace conglomerates, including RTX and Leonardo, enter via acquisitions, while Singapore Technologies Engineering leverages cost-competitive manufacturing to penetrate price-sensitive Asian programs.
Patented algorithms for automated ballistic solutions and recoil-attenuation mechanisms extend technological moats. Export-license portfolios and compliance infrastructure provide further barriers to entry, as emerging suppliers lack the breadth of approvals to address multi-regional tenders. Nonetheless, niche players such as EOS Defense Systems carve share through counter-drone variants optimized for expeditionary forces, and Hanwha Systems captures domestic Korean programs under the defense-industry self-reliance policy. Strategic collaborations, offset partnerships, and co-production deals remain preferred tactics to satisfy localization rules and reduce political risk.
Supply-chain fragility shapes competitive strategy as semiconductor shortages and specialty alloy delays threaten delivery schedules. Larger firms adopt dual-sourcing, component stockpiling, and vertical integration to maintain contractual performance. Digital-twin software accelerates maintenance-training cycles and underpins predictive-through-life support offerings, enhancing stickiness across product life cycles approaching 25 years. Competitive intensity is expected to escalate as AI-centric start-ups partner with platform OEMs, further blurring the line between software and hardware value creation.
Remote Weapon Systems Industry Leaders
Rheinmetall AG
Kongsberg Gruppen ASA
Elbit Systems Ltd.
Rafael Advanced Defense Systems Ltd.
ASELSAN
- *Disclaimer: Major Players sorted in no particular order
Remote Weapon Systems Market Companies Covered in this Report
- Kongsberg Gruppen ASA
- Elbit Systems Ltd.
- Rafael Advanced Defense Systems Ltd.
- RTX Corporation
- Saab AB
- Leonardo S.p.A
- Electro Optic Systems (EOS)
- ASELSAN
- General Dynamics Corporation
- BAE Systems plc
- Thales Group
- FN Browning Group
- Rheinmetall AG
- Hanwha Systems Co., Ltd.
- Singapore Technologies Engineering Ltd.
- Moog Inc.
- IAI
- KNDS N.V.

Market Opportunities and Future Outlook
Opportunity is concentrated in multi-weapon, counter-UAS-capable RWS upgrades and new-build integration, as buyers standardize configurations across fleets to simplify training and sustainment. Early 2026 procurement activity shows this direction: Kongsberg received a contract modification for PROTECTOR RT20 turrets for the US Marine Corps Advanced Reconnaissance Vehicle (ARV), and it also secured work tied to Patria CAVS 6x6 vehicles for Germany and Sweden (EUR 140 million, February 2026). In Sweden, FMV ordered Saab Trackfire RWS (approximately SEK 1.5 billion, January 2026) for army and amphibious modernization, reinforcing demand for stabilized mounts across both land and littoral forces.
A second whitespace area involves RWS adoption beyond traditional manned platforms, including modular architectures for unmanned ground vehicles and configurable ground sites. In these cases, common control interfaces and safety-assured autonomy features matter alongside the mount. Industrial footprints and localized production can also create openings for suppliers that can pair compliance-ready exports with in-country assembly and sustainment. EOS Defense Systems USA’s contract activity tied to a major US Army ground combat program, along with additional US contracts reported in April 2026, illustrates how primes are placing RWS work within domestic manufacturing ecosystems. Across regions, export-control constraints (ITAR/EU controls) and urgent counter-drone requirements are pushing buyers toward vendors with established licensing processes, validated software baselines, and mature through-life support.
Recent Industry Developments in Remote Weapon Systems Market
- June 2026: Electro Optic Systems (EOS) reported a large order for its Slinger counter-drone remote weapon system from UAE-based Generation 5 Holding L.L.C. and outlined plans linked to a joint venture. The move elevated counter-UAS-configured RWS as a high-value procurement category and strengthened EOS positioning in the Middle East where rapid fielding and localized industrial participation influence awards.
- October 2025: Kongsberg Defence and Aerospace announced a partnership with the US Army to integrate counter-unmanned aerial system capabilities into RWS delivered under the CROWS program. The partnership connected fleet-scale retrofit pathways to new sensor and fire-control additions, reinforcing the shift from simple mounts toward integrated, upgradeable weapon-and-sensing nodes.
- April 2024: Milrem Robotics reported triple-digit order growth for its THeMIS unmanned ground vehicle in 2024, with many configurations integrating partner-supplied remote weapon systems. This pointed to accelerating demand for modular, unmanned-compatible weapon stations and increased the emphasis on standardized mechanical and digital interfaces between UGVs and RWS suppliers.


Remote Weapon Systems Market Report Scope and Research Methodology
Market Definition and Coverage
This market covers remotely operated weapon stations and remote weapon systems that let an operator detect, track, and engage targets from protected positions, either on a platform or as a fixed installation. Revenue is counted for complete systems and the core hardware that makes them deployable.
Scope exclusions: We exclude manual weapon mounts, basic gun turrets without remote actuation, and general communication gear sold independently from a weapon system.
Segments Covered in This Report
- By Platform
- Land
- Armored Combat Vehicles
- Autonomous/UGV Platforms
- Stationary Ground Sites
- Marine
- Patrol and OPV Vessels
- Corvettes and Frigates
- Airborne
- Helicopters
- Fixed-Wing Aircraft
- UAVs/UCAVs
- Land
- By Weapon Type
- Small-Caliber (≤12.7 mm)
- Medium-Caliber (20–40 mm)
- Missile-Integrated Stations
- Non-Lethal Payloads
- By Component
- Sensors and EO/IR Suites
- Weapons and Armaments
- Human-Machine Interface (HMI)
- Fire-Control and Ballistic Computers
- Stabilization Units
- By End-User
- Military
- Homeland Security
- By Geography
- North America
- United States
- Canada
- Mexico
- South America
- Brazil
- Rest of South America
- Europe
- United Kingdom
- Germany
- France
- Russia
- Rest of Europe
- Asia-Pacific
- China
- India
- Japan
- South Korea
- Rest of Asia-Pacific
- Middle East and Africa
- Middle East
- Saudi Arabia
- United Arab Emirates
- Rest of Middle East
- Africa
- South Africa
- Middle East
- North America
Data Sources, Market Sizing, and Validation
Desk Research
Desk research is used to set the demand context and to keep assumptions realistic before we speak with industry participants. We refer to public defense budget and procurement signals (such as official defense ministry releases and budget documents), arms transfer disclosures, and contract award notices where they are available. We also use sources such as SIPRI, UN Comtrade for trade patterns tied to relevant weapon and optics categories, and NATO or national standards documents that clarify system requirements and integration expectations.
To translate context into market inputs, we review annual reports, 10-K style filings, and investor presentations from listed defense groups, along with press releases and reputable defense media coverage that notes program timelines and upgrades. Patent databases are checked to see where stabilization, fire control, and electro-optics innovation is active, and an import/export shipment-level database is selectively used to validate trade flow direction for key sub-systems. These desk research sources are illustrative, and many other public documents and datasets were also used for collection, validation, and clarification.
Primary Interviews and Surveys
Primary work focuses on confirming what is actually being bought and installed, then stress-testing our volume and pricing assumptions. We speak with a mix of system integrators, sub-component suppliers, and procurement facing experts, and we cover APAC, EMEA, and the Americas so regional buying cycles are not over-weighted. Where secondary data is thin, interview feedback is used to narrow ranges for upgrade rates, typical configurations, and the timing gap between award and delivery.
Distribution of primary research fieldwork respondents
| Company type | Respondent position | Region |
|---|---|---|
| Top tier: 30% | CXOs: 12% | APAC: 41% |
| Mid tier: 55% | Functional/Unit leaders: 34% | EMEA: 33% |
| Smaller Players: 15% | Managers: 54% | Americas: 26% |
Market-Sizing & Forecasting
The sizing model starts with a top-down build that reconstructs demand using defense procurement signals, platform modernization plans, and observed delivery schedules for vehicles, naval platforms, and airborne assets that typically carry these stations. That demand pool is converted into market value using system fit rates and a practical pricing ladder by platform and weapon class, then filtered through what programs are funded and moving into integration.
To keep totals grounded, we corroborate the outcome with selective bottom-up approximations, such as sampling unit volumes from public contract disclosures, using channel checks on typical bill-of-material splits, and comparing implied revenues with supplier exposure discussed in interviews. Key inputs include defense capital spending trends, active procurement and retrofit programs, installed base and replacement cycles for armored vehicles and naval vessels, average system content by component (mount, stabilization, fire control, electro-optics), and price progression by integration complexity. Forecasts are built using scenario analysis anchored to expert views on procurement timing, with separate cases for faster modernization, delayed awards, and stable budget growth. For gaps in sparse geographies, we apply proxy penetration rates from comparable programs, then validate the direction with respondents.
Data Validation & Update Cycle
Outputs are validated through multiple checks, including cross-checking implied unit volumes against public platform deliveries and upgrade announcements, and testing whether regional spend shares align with observed procurement activity. Outliers are reviewed, assumptions are re-opened when large variances show up, and follow-up outreach is triggered when interview feedback conflicts with desk signals on timing or pricing.
Before sign-off, the model and written logic go through step-by-step analyst reviews so calculation links, currency handling, and growth drivers stay consistent across sections. The report is refreshed annually, and interim updates are made when material contract awards, conflicts, or budget changes shift near-term demand. Right before delivery, an analyst performs a fresh pass so clients receive the latest updated view.
Mordor Intelligence's Remote Weapon Systems Market Size Versus Other Published Estimates
Published market sizes for remote weapon systems often differ because firms draw the line differently on what counts as a full system, which platforms are included, and what year they treat as the current value. Differences also come from how procurement timing is handled, since awards can be announced well before deliveries turn into recognized revenue.
Contract award totals, platform delivery schedules, and the pace of retrofit programs are the evidence checks that tie Mordor Intelligence's USD 14.6 B (2026) estimate to what is likely to ship and get integrated within the year. If those signals are not applied consistently, some estimates can lean more on long-term intent, blend adjacent weapon station categories, or apply a smoother pricing curve that does not reflect higher-cost stabilized and sensor-heavy configurations.
Benchmark comparison
| Source | Market Size | Gaps in Research Methodology |
|---|---|---|
| Mordor Intelligence | USD 14.6 B (2026) | |
| Global Consultancy A | USD 11.66 B (2025) | Uses a 2025 base year, and the scope is less explicit on how award timing versus delivery timing is treated, which can change what is counted as current-year revenue in procurement-heavy markets. |
| Industry Publisher B | USD 7.5 B (2025) | Appears to apply a narrower in-scope system definition that limits what is counted as a complete remote weapon system, which can reduce totals when electro-optics, stabilization, and fire control content is not fully captured. |
Across the three figures, the spread is mainly explained by year alignment and by how much system content is counted as in-scope revenue. By keeping the calculations traceable to procurement signals and interview-validated pricing and mix, we can present a balanced total that can be repeated and refreshed with the same steps.


Key Questions Answered in the Report
What is the expected value of the RWS market in 2031?
It is projected to reach USD 23.45 billion, supported by a 9.95% CAGR between 2026 and 2031.
Which platform category currently leads spending on RWS?
Land systems account for 57.68% of 2025 revenue, driven by armored-vehicle retrofits and unmanned ground-vehicle programs.
Why are medium-caliber stations gaining procurement preference?
The 20-40 mm class offers higher lethality against drones and light armor while remaining cost-effective relative to missile solutions.
Which region is growing fastest for new installations?
Asia-Pacific shows the highest CAGR at 10.02% through 2031 thanks to naval-modernization initiatives.
How do AI-enabled fire-control suites benefit operators?
Integrated algorithms automate target detection and ballistic calculations, improving first-round hit probability and reducing crew workload.
What limits adoption in lower-income defense markets?
High terminal cost, ongoing maintenance expenses, and limited access to financing programs restrain widespread deployment.
Page last updated on:





