Light Weapons Market Size and Share
Market Overview
| Study Period | 2020 - 2031 |
|---|---|
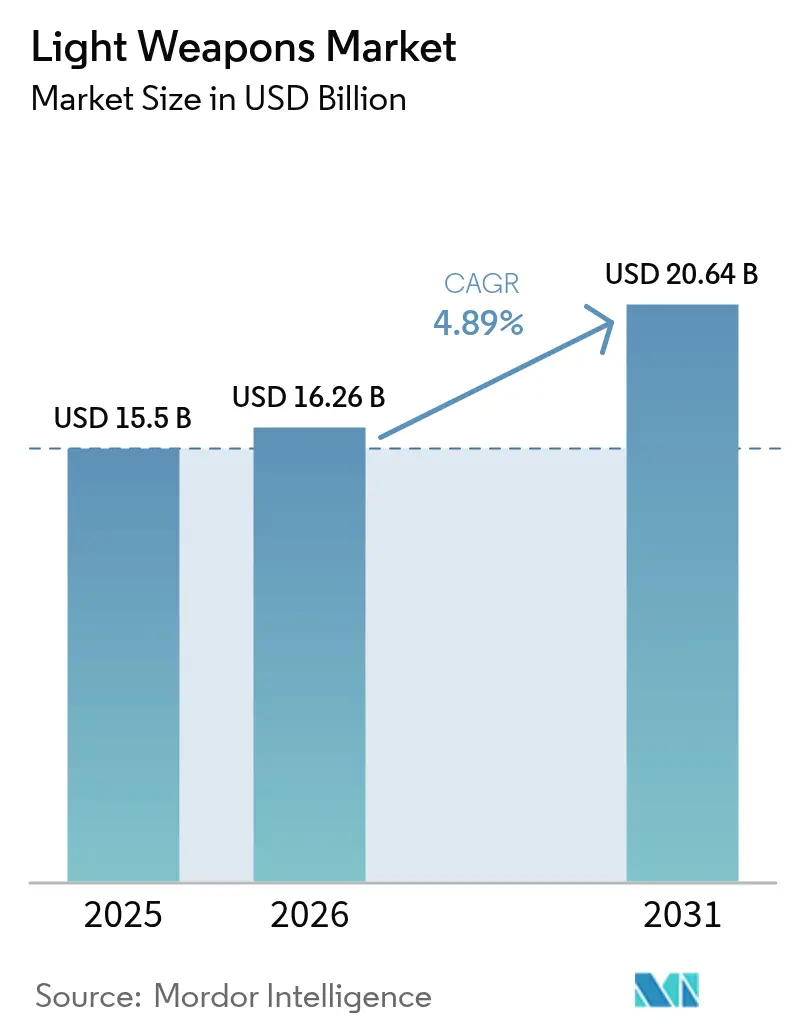
| Market Size (2026) | USD 16.26 Billion |
| Market Size (2031) | USD 20.64 Billion |
| Growth Rate (2026 - 2031) | 4.89% CAGR |
| Fastest Growing Market | Asia Pacific |
| Largest Market | North America |
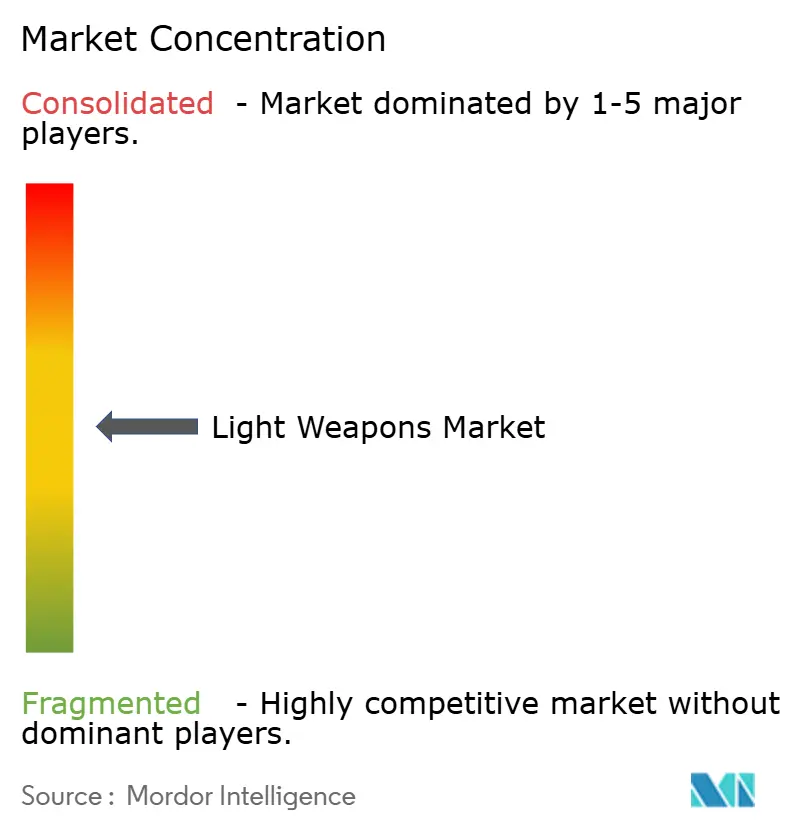
| Market Concentration | Medium |
Major Players *Disclaimer: Major Players sorted in no particular order Image © Mordor Intelligence. Reuse requires attribution under CC BY 4.0. | |
Light Weapons Market Analysis by Mordor Intelligence
The light weapons market size was valued at USD 15.50 billion in 2025 and estimated to grow from USD 16.26 billion in 2026 to reach USD 20.64 billion by 2031, at a CAGR of 4.89% during the forecast period (2026-2031). This steady advance stems from defense-budget expansion in response to heightened geopolitical risk, with global military expenditure rising 9.4% to USD 2.718 trillion in 2024. Procurement priorities concentrate on man-portable precision systems, while naval close-in programs and polymer-composite ammunition illustrate parallel modernization currents. Technology convergence—especially AI-enabled fire-control modules—allows armed forces to upgrade legacy inventories at a lower cost than wholesale fleet replacement. Vendor competition remains moderate: established contractors guard incumbency through scale and compliance expertise, yet niche innovators exploit software-centric differentiation. Raw-material price volatility and tightening arms-export rules temper growth but outweigh the demand pull created by escalating regional flashpoints.
Key Report Takeaways
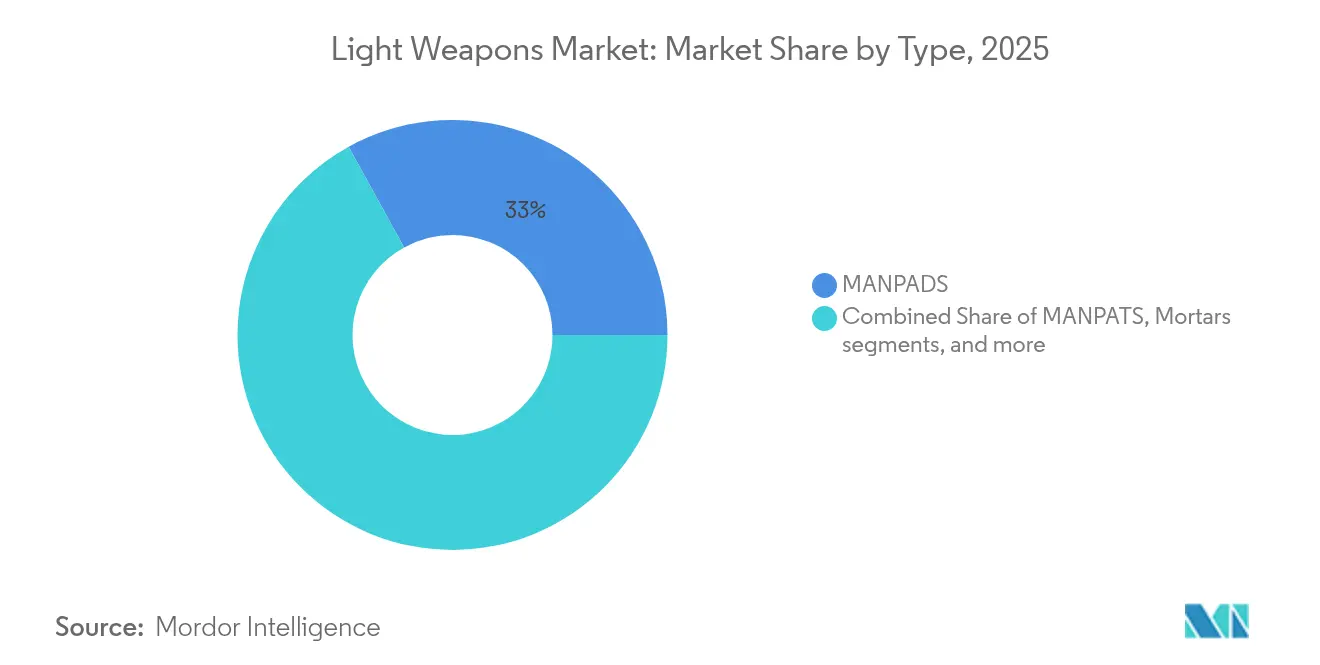
- By type, MANPADS held 33.02% of the light weapons market share in 2025; grenades and grenade launchers are set to expand at 8.74% CAGR to 2031.
- By technology, guided systems led with a 55.12% revenue share in 2025 and are projected to grow at a 7.28% CAGR through 2031.
- By platform, land applications dominated with a 60.55% share in 2025, while naval platforms are forecasted to post a 6.43% CAGR through 2031.
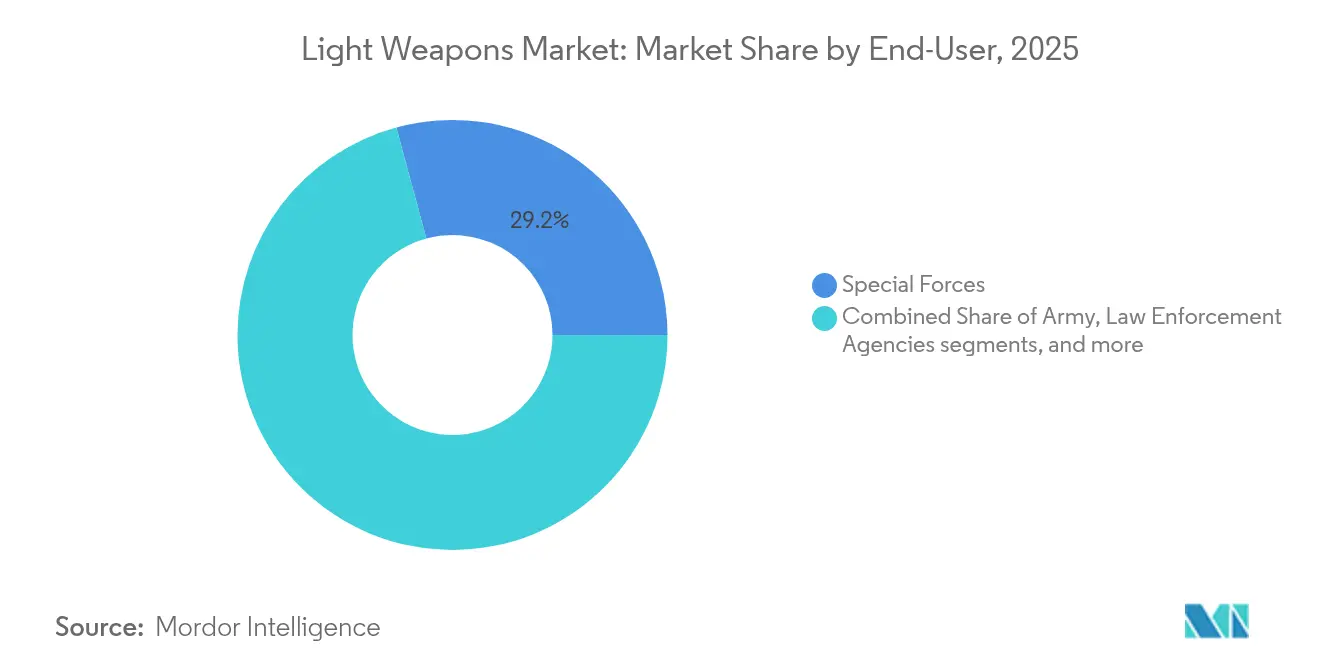
- By end-user, special forces commanded 29.21% of 2025 revenues; the army segment is on track for the fastest 9.32% CAGR up to 2031.
- By material, the aluminum and light-metal alloys segment held 29.92% share in 2025, and the polymer composites segment is expected to grow at the fastest rate of 5.36% CAGR up to 2031.
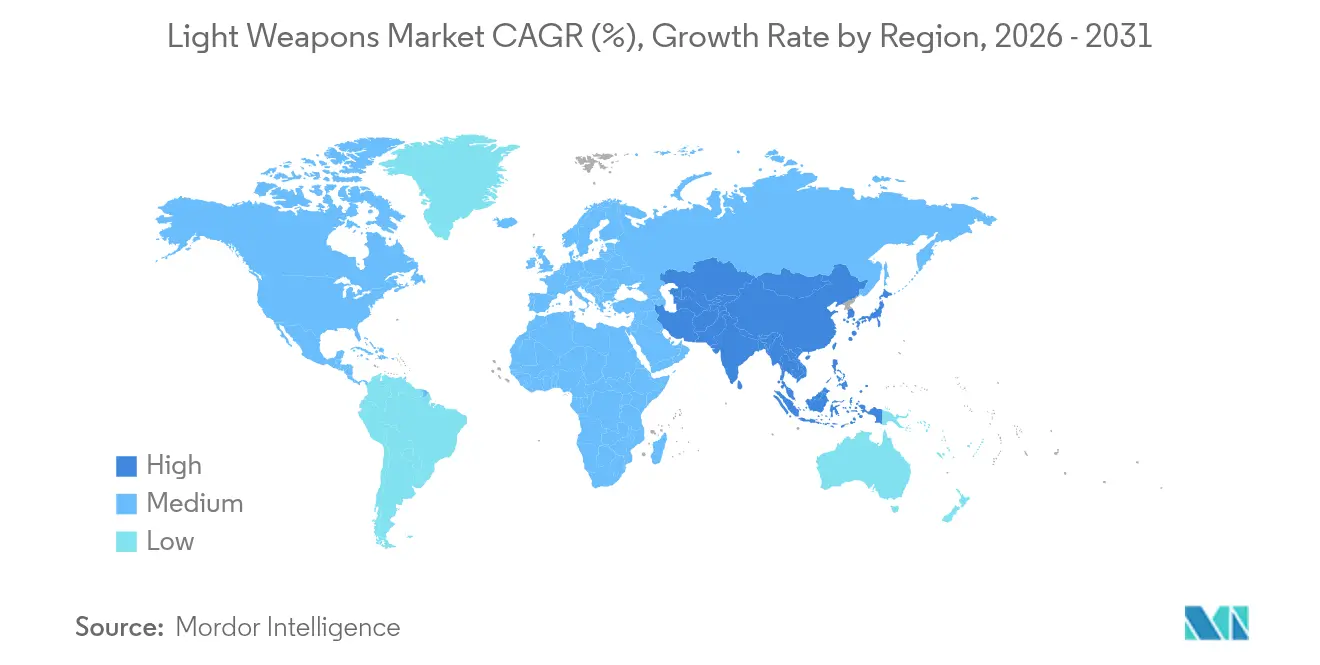
- By geography, North America accounted for 38.33% of 2025 revenue, whereas Asia-Pacific is expected to compound at 7.53% CAGR through 2031.
Note: Market size and forecast figures in this report are generated using Mordor Intelligence’s proprietary estimation framework, updated with the latest available data and insights as of 2026.
Global Light Weapons Market Trends and Insights
Drivers Impact Analysis*
| Driver | (~) % Impact on CAGR Forecast | Geographic Relevance | Impact Timeline |
|---|---|---|---|
| Escalating defense budgets amid geopolitical tensions | +1.8% | Europe and Middle East focused, global spill-over | Medium term (2-4 years) |
| Proliferation of asymmetric warfare driving demand for man-portable systems | +1.2% | Asia-Pacific core, widening to MEA | Long term (≥ 4 years) |
| Modernization of infantry units with lightweight modular weaponry | +0.9% | North America and EU, extending to APAC | Medium term (2-4 years) |
| Rising counter-terror operations and urban warfare requirements | +0.7% | Middle East and South Asia first, global later | Short term (≤ 2 years) |
| Integration of AI-enabled fire-control modules into legacy light weapons | +0.6% | North America and EU, allied transfers | Long term (≥ 4 years) |
| Emergence of polymer-cased ammunition reducing soldier load | +0.4% | Early adoption in advanced militaries, global uptake | Medium term (2-4 years) |
| Source: Mordor Intelligence | |||


Escalating Defense Budgets Amid Geopolitical Tensions
European military outlays climbed 17% to USD 693 billion in 2024 as NATO states reacted to Russia’s invasion of Ukraine.[1]Stockholm International Peace Research Institute, “Trends in World Military Expenditure 2024,” sipri.org Poland will raise defense spending to 4.7% of GDP by 2025, while Germany’s EUR 100 billion (USD 109 billion) special fund underlines long-term commitment. The European Union's ReArm Europe proposal aims to mobilize EUR 800 billion (USD 870 billion), which includes EUR 150 billion (USD 163 billion) in joint-procurement loans.[2]European Parliament, “ReArm Europe Initiative Explained,” europarl.europa.eu This initiative has led to significant infantry weapon orders, such as Germany's EUR 8.5 billion (USD 9.2 billion) ammunition contract with Rheinmetall, strengthening the demand in the light weapons market.
Proliferation of Asymmetric Warfare Driving Demand for Man-Portable Systems
Ukraine’s battlefield experience shows how man-portable missiles blunt heavier forces, prompting regional actors to stockpile similar assets; European arms imports doubled in 2019-2023 versus 2014-2018.[3]Al Jazeera, “European Arms Imports Double Amid Ukraine War,” aljazeera.com Taiwan’s purchase of Switchblade 300 loitering munitions worth USD 360.2 million highlights Asia-Pacific uptake. Smart-rifle scopes such as the SMASH 2000L, fielded under a USD 13 million US Army program, illustrate counter-drone. Asymmetric doctrine thus sustains multi-role, low-footprint products within the light weapons market.
Modernization of Infantry Units with Lightweight Modular Weaponry
Japan began replacing Type 89 rifles in 2024 with 5.56 mm Type 20 models under a JPY 3.3 billion (USD 22.82 million) contract for 8,577 units. The UK’s Project Troubler seeks machine guns below 7.1 kg, and FN Herstal’s 5.5 kg Evolys meets that bar. Israel’s Arbel electronic firing system triples accuracy without new platforms. Weight-saving prototypes such as STV Group’s Archon Type L ultra-light LMG reinforce soldier-mobility priorities that are pervasive in the light weapons industry.
Rising Counter-Terror Operations and Urban Warfare Requirements
Drone-centred urban threats drive fresh procurement. The US Marine Corps will field counter-UAS kits service-wide in 2025. UK demonstrators defeated drone swarms with directed-energy weapons during 2024 trials. Israel’s Ten AI Weapon System detects targets at 700 m with 40x optical zoom for border security. Precision, discrimination, and multi-sensor fusion, therefore, underpin urban-warfare offerings inside the light weapons market.
Restraints Impact Analysis*
| Restraint | (~) % Impact on CAGR Forecast | Geographic Relevance | Impact Timeline |
|---|---|---|---|
| Stringent international arms-transfer regulations | -0.8% | Global, intense on cross-border sales | Long term (≥ 4 years) |
| Volatile raw-material prices for specialty alloys and electronics | -0.6% | Worldwide, sharper in supply-constrained regions | Short term (≤ 2 years) |
| Battlefield shift toward loitering munitions curbing MANPATS demand | -0.4% | First in advanced militaries, global diffusion | Medium term (2-4 years) |
| Environmental and health concerns over legacy propellants | -0.3% | EU and North America lead, global echo | Long term (≥ 4 years) |
| Source: Mordor Intelligence | |||
Stringent International Arms-Transfer Regulations
The US Commerce Department imposed tighter firearms-export rules in May 2024, presuming denial for many commercial deals. Washington’s revised Conventional Arms Transfer policy blocks shipments likely to enable rights abuses. The Arms Trade Treaty, now at 113 parties, mandates prior risk assessments.[4]United Nations, “Arms Trade Treaty Status,” un.orgThe UK’s 2024 Export Control amendment added emerging-tech coverage. Compliance overhead and license uncertainty curb smaller exporters’ access to the light weapons market.
Volatile Raw-Material Prices for Specialty Alloys and Electronics
Chinese export curbs on gallium and germanium heighten semiconductor-supply risk for guidance kits. Defense buyers estimate tariff-linked cost headwinds at USD 850 million per year. The US Defense Logistics Agency’s supplier base shrank to 8,500 firms, raising concentration risk. Such price swings compress program margins and complicate bidding across the light weapons market.
*Our forecasts treat driver/restraint impacts as directional, not additive. The impact forecasts reflect baseline growth, mix effects, and variable interactions.
Segment Analysis
By Type: MANPADS Dominance Amid Guided-System Evolution
MANPADS generated 33.02% of 2025 revenue, the highest individual slice of the light weapons market size, reflecting broad procurement of Stinger-class missiles by Taiwan and Eastern European allies. Although loitering drones threaten substitution, established logistics chains and immediate availability keep demand resilient. Heavy machine guns and mortars retain niche relevance through service-life extension contracts, while counter-drone rifles form a fledgling but important category.
Grenades and grenade launchers delivered the fastest 8.74% CAGR outlook. Programmable air-burst rounds and precision launchers, such as the Mk 47 acquired by Colt CZ, illustrate value migration toward guided sub-munitions. Urban warfare doctrines and policing requirements underpin dual-use sales. Together, these trends ensure product-mix diversification inside the light weapons market.


By Technology: Guided Systems Drive Precision Revolution
Guided munitions commanded 55.12% revenue in 2025 and will outpace other technologies at 7.28% CAGR, underlining their mass in the light weapons market share hierarchy. Beam-riding laser models and IR fire-and-forget missiles reduce operator exposure and meet collateral-damage thresholds, as evidenced by Thales’ Lightweight Multi-role Missile trials.
Unguided systems persist due to their price advantage and resilience against jamming. Budget-constrained forces stockpile inexpensive rounds to ensure supply sufficiency. As electronic warfare (EW) threats expand, dual inventories—smart and dumb—provide hedge flexibility, securing a stable niche for unguided products within the light weapons industry.
By Platform: Naval Growth Accelerates Amid Maritime Tensions
Land platforms still comprised 60.55% of 2025 spending, yet naval applications will capture the highest 6.43% CAGR. The US Navy’s SeaRAM retrofit on Arleigh Burke destroyers demonstrates demand for extended-reach point defense. South Korea’s 4,200-rpm CIWS-II, due in 2026, shows similar requirements. As Indo-Pacific maritime competition intensifies, ship-borne quick-reaction guns and missiles attract fresh investment, expanding the light weapons market size for sea-based solutions.
Air-platform integration remains steady; helicopters and drones mount lightweight missiles for precision strikes. Modularity allows single-seeker architectures to span land, sea, and airframes, giving suppliers cross-platform revenue leverage.
By End-User: Special Forces Lead While Army Segment Accelerates
Special Forces units accounted for 29.21% of the 2025 demand thanks to premium gear cycles and rapid tech adoption. They remain early customers for polymer cases, advanced optics, and smart launchers, cementing their influence on design roadmaps.
Conventional armies will, however, post the fastest 9.32% CAGR to 2031 as mass modernization unfolds. Poland’s doubling of troop strength exemplifies volume procurement. NATO orchestration of common requirements accelerates bulk orders, pushing overall light weapons market growth into high gear over the forecast horizon.
By Material: Polymer Innovation Drives Weight Reduction
Aluminum-alloy assemblies delivered 29.92% of 2025 turnover, but polymer composites will enjoy a 5.36% CAGR, the strongest advance among materials. Favorable strength-to-weight ratios enable longer missions with unchanged carry loads. Ceramic-hybrid solutions promise additional ballistic resilience, encouraging incremental adoption that should maintain healthy momentum within the light weapons market.
Geography Analysis
North America led the market with 38.33% revenue in 2025, anchored by the United States’ USD 997 billion defense budget. Robust domestic orders underpin economies of scale, while Foreign Military Sales extend reach into allied fleets. Lockheed Martin’s Missiles and Fire Control sales climbed 13% to USD 3.37 billion in Q1 2025 as backlog visibility improved.
Asia-Pacific's light weapons market size is projected to grow at a 7.53% CAGR through 2031, the fastest regional rate. India’s 20% compound defense-capital growth through FY24-FY29 sustains local sourcing mandates covering 65% of contracts. The Philippines earmarked USD 35 billion under Re-Horizon 3, while Japan’s 21% budget hike marks the largest since 1952. Rising China-related security anxiety fuels multi-country rearmament, giving suppliers an expansive pipeline.
Europe’s surge in military spending—up 17% year-on-year to USD 693 billion—creates the most immediate procurement spike. Germany’s EUR 100 billion (USD 109 billion) fund, Poland’s 4.7% of GDP target, and the EU’s ReArm proposal underpin a broad, multi-year refresh of infantry weapons. Joint programs such as the UK-Germany deep-strike missile demonstrate intra-European industrial cohesion, boosting the regional light weapons market.

Competitive Landscape
Market power is shared among a dozen diversified primes and a larger cohort of mid-specialists. RTX Corporation, Lockheed Martin Corporation, Northrop Grumman Corporation, and BAE Systems plc dominate guided-systems intellectual property and maintain turnkey integration capacity. Rheinmetall’s USD 950 million acquisition of Loc Performance widens its US foothold, targeting the XM30 infantry-vehicle project. BAE’s USD 5.5 billion deal for Ball Aerospace extends sensor and space synergies.
Concurrently, niche firms such as Smart Shooter, ZeroMark, and FN Herstal gain traction by embedding software-defined accuracy into conventional rifles. Partnerships proliferate: Leonardo and Rheinmetall created a vehicle joint venture to serve Italy’s 1,000-unit armored requirement. Supply-chain geopolitics have spurred localization; Saudi Arabia’s domestic THAAD transporter assembly and Indonesia’s KF-21 fighter order from Türkiye illustrate south-south alliances.
Competitive factors pivot on technology fusion, regulatory compliance, and lifecycle support. The ability to certify AI algorithms, secure export licenses, and integrate eco-friendly propellants will define future winners as the light weapons market gradually tilts toward data-centric value propositions.
Light Weapons Industry Leaders
RTX Corporation
Lockheed Martin Corporation
Saab AB
Rheinmetall AG
FN Herstal, S.A. (FN Browning Group)
- *Disclaimer: Major Players sorted in no particular order

Recent Industry Developments
- June 2025: As part of a USD 3.5 billion foreign military sales (FMS) deal approved by the US, the Israeli government greenlit the sale of Arrow 3 missiles to the German Armed Forces.
- June 2025: QinetiQ secured a contract worth GBP 160 million (USD 215.50 million) from the UK MoD to fast-track the development of advanced directed energy weapons (DEWs), such as the DragonFire laser and Radio Frequency Directed Energy Weapon (RFDEW) systems.
- April 2025: Saudi Arabia unveiled its inaugural domestically produced THAAD transporter. This achievement underscores the deepening partnership between AIC and Lockheed Martin, focusing on bolstering Saudi Arabia's defense manufacturing prowess.
- March 2025: The UK MoD awarded Thales a GBP 1.6 billion (USD 2.16 billion) contract to procure 5,000 units of Lightweight Multirole Missiles (LMMs) for Ukraine.


Research Methodology Framework and Report Scope
Market Definitions and Key Coverage
Our study treats the light weapons market as every man-portable or crew-served firearm system that can be carried by two or three soldiers, including heavy machine guns, mortars below 120 mm, grenade launchers, man-portable anti-tank systems, man-portable air-defense systems, and related guided or unguided munitions. We measure value in constant 2025 US dollars across land, naval, and airborne platforms.
Scope exclusion: crew-served artillery above 120 mm and any fixed vehicle-mounted weaponry are kept outside this assessment.
Segmentation Overview
- By Type
- Heavy Machine Guns (HMGs)
- Grenades and Grenade Launchers
- Mortars
- Man-portable Anti-tank Systems (MANPATS)
- Man-portable Air-Defense Systems (MANPADS)
- Other Types
- By Technology
- Guided
- Laser Guided
- Infra-red Guided
- Satellite Guided
- Semi-automatic Command to Line of Sight
- Unguided
- Guided
- By Platform
- Land-based
- Airborne
- Naval
- By End-user
- Army
- Special Forces
- Law Enforcement Agencies
- Homeland Security/Paramilitary
- Others
- By Material
- Steel and Specialty Alloys
- Aluminum and Light-Metal Alloys
- Polymer Composites
- Others
- By Geography
- North America
- United States
- Canada
- Mexico
- Europe
- United Kingdom
- France
- Germany
- Russia
- Rest of Europe
- Asia-Pacific
- China
- India
- Japan
- South Korea
- Rest of Asia-Pacific
- South America
- Brazil
- Rest of South America
- Middle East and Africa
- Middle East
- Saudi Arabia
- Israel
- UAE
- Rest of Middle East
- Africa
- South Africa
- Rest of Africa
- Middle East
- North America
Detailed Research Methodology and Data Validation
Primary Research
Mordor analysts spoke with procurement officers in North America and Asia Pacific, ordnance engineers within leading OEMs, and special-forces trainers who relay frontline usage patterns. These conversations validated penetration rates, average selling prices, and the shift toward polymer-composite casings, while clarifying how export-control pauses affect quarterly deliveries.
Desk Research
We begin by mapping the production and trade footprint through defense expenditure tables from SIPRI, import-export filings available in UN Comtrade, and procurement notices from platforms such as Tenders Info. Added context comes from NATO standardization documents, US Federal Budget Justifications, and white papers released by regional ministries of defense. Company filings and news archives in Dow Jones Factiva supply revenue splits and contract values for key suppliers. The sources cited above illustrate, but do not exhaust, the wider evidence base consulted during secondary research.
Market-Sizing & Forecasting
For the baseline, a top-down build collects defense budget lines for infantry weapons, adjusts them with historical import ratios, and then applies guided-to-unguided allocation factors derived from expert interviews. We corroborate totals through selective bottom-up roll-ups of supplier revenues and sampled contract values. Key model drivers include average troop strength per region, replacement cycles, guided system adoption rates, polymer share in housings, and real defense-spending growth. Forecasts employ multivariate regression where defense outlay, geopolitical risk indices, and technology cost curves act as independents; scenario analysis stresses the numbers for export-license shocks. Data gaps in supplier disclosures are bridged by triangulating open-source shipment volumes with median ASPs discussed by respondents.
Data Validation & Update Cycle
Outputs pass an anomaly screen against trade volumes and press-announced contract values before senior review. We refresh every twelve months and issue interim revisions when material events, such as embargoes or sudden budget surges, arise, ensuring clients receive the most current view.
Why Mordor's Light Weapons Baseline Stands Firm
Published estimates often diverge because firms mix small arms with heavier ordnance, apply different base years, or overlook guided munition premiums.
By centering on 2025 spending lines and maintaining a clear item list, Mordor Intelligence keeps our figures both transparent and consistently repeatable.
Benchmark comparison
| Market Size | Anonymized source | Primary gap driver |
|---|---|---|
| USD 15.50 B (2025) | Mordor Intelligence | - |
| USD 17.86 B (2025) | Regional Consultancy A | Adds civilian small-arms pool and uses public financials with limited primary checks |
| USD 13.37 B (2024) | Trade Journal B | Older base year and omits guided systems segment |
| USD 12.50 B (2024) | Industry Association C | Focuses on firearms only, excluding mortars and MANPADS |
These comparisons show that once differing scopes and refresh cadences are stripped away, our disciplined variable selection provides a balanced, decision-ready baseline that stakeholders can trace back to clear data series and repeatable steps.


Key Questions Answered in the Report
How large is the light weapons market in 2026?
The light weapons market size stood at USD 16.26 billion in 2026.
What is the expected CAGR for the light weapons market to 2031?
Revenue is projected to grow at 4.89% per year through 2031.
Which region will expand fastest?
Asia-Pacific is forecasted to record the quickest 7.53% CAGR owing to rising defense outlays.
What technology segment holds the largest market share?
Guided systems accounted for 55.12% of 2025 revenue and maintain the highest growth rate.
How will polymer-cased ammunition influence future demand?
Polymer rounds reduce soldier load by up to 30%, supporting a 5.36% CAGR for composite materials and encouraging broader adoption.
Which restraint poses the greatest long-term threat?
Stricter international arms-transfer regulations, with a -0.8% impact on forecasted CAGR, present the most significant structural headwind.
Page last updated on:


