Smart Weapons Market Size and Share
Market Overview
| Study Period | 2020 - 2031 |
|---|---|
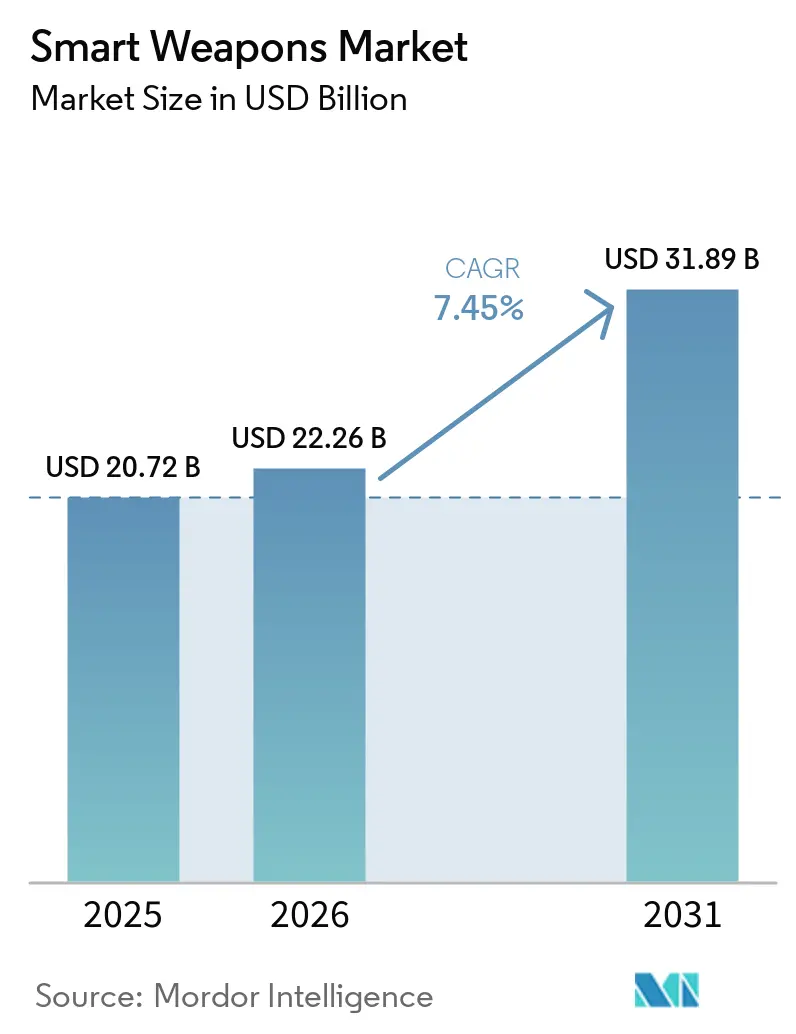
| Market Size (2026) | USD 22.26 Billion |
| Market Size (2031) | USD 31.89 Billion |
| Growth Rate (2026 - 2031) | 7.45% CAGR |
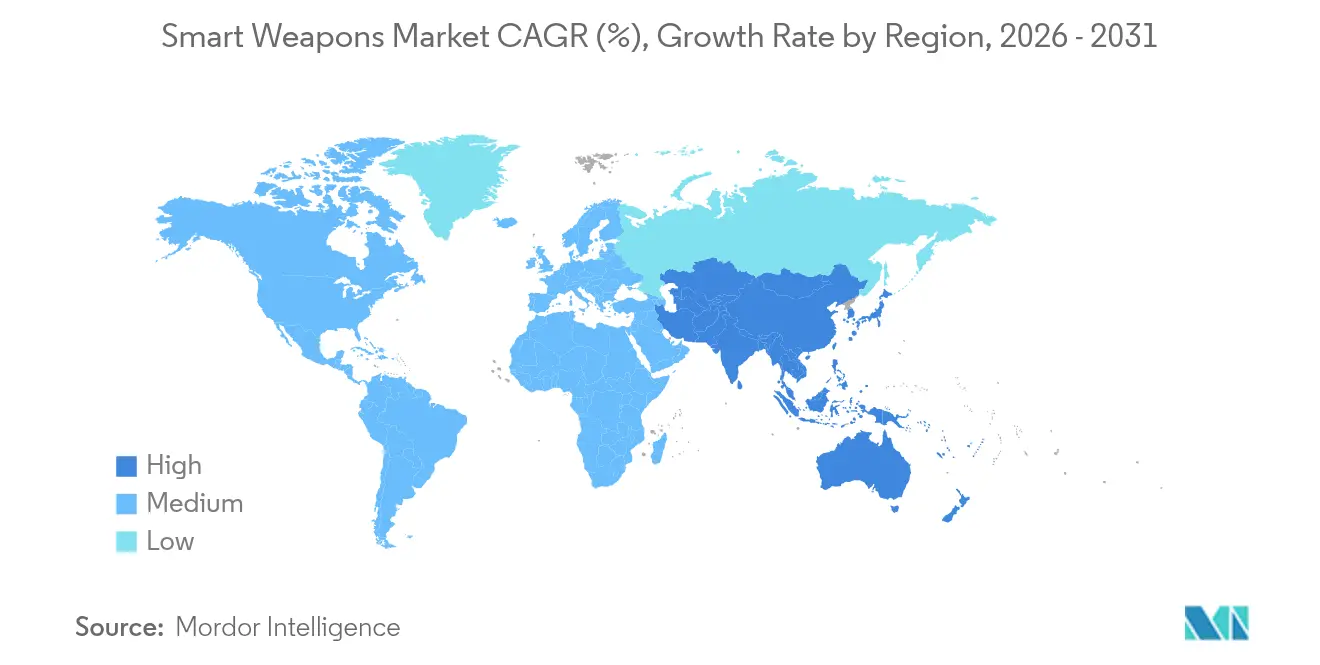
| Fastest Growing Market | Asia Pacific |
| Largest Market | North America |
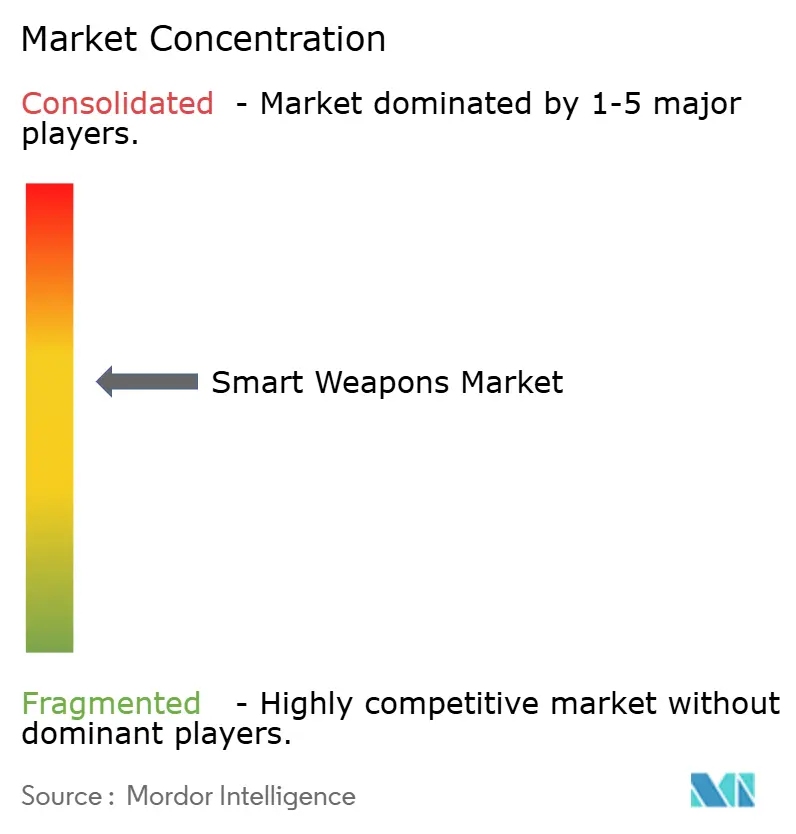
| Market Concentration | Medium |
Major Players *Disclaimer: Major Players sorted in no particular order Image © Mordor Intelligence. Reuse requires attribution under CC BY 4.0. | |
Smart Weapons Market Analysis by Mordor Intelligence
Smart weapons market size in 2026 is estimated at USD 22.26 billion, growing from 2025 value of USD 20.72 billion with 2031 projections showing USD 31.89 billion, growing at 7.45% CAGR over 2026-2031. Escalating defense budgets, shifting operational doctrines favoring precision over mass firepower, and the race to neutralize evolving air-defense and electronic-warfare threats are sustaining this expansion. NATO’s collective push to exceed the 2% of GDP spending benchmark and the European Union’s EUR 800 billion (USD 937.72 billion) ReArm Europe program are securing multi-year order backlogs that shield contractors from short-term budget cycles. Simultaneously, Asia-Pacific rearmament—spanning Japan’s railgun program to the Philippines’ USD 35 billion modernization plan—is diversifying demand sources and sharpening competition for export-controlled subsystems. Inflation-linked contract escalations, semiconductor shortages, and raw-material price surges are testing cost-plus procurement models. Yet, they also stimulate modular designs and dual-use sensor ecosystems that shorten upgrade cycles. Across all regions, the political premium on minimizing collateral damage in urban combat zones is accelerating the fielding of multi-mode guidance and AI-enabled target-discrimination technologies, locking precision-guided munitions into future force-structure planning.
Key Report Takeaways
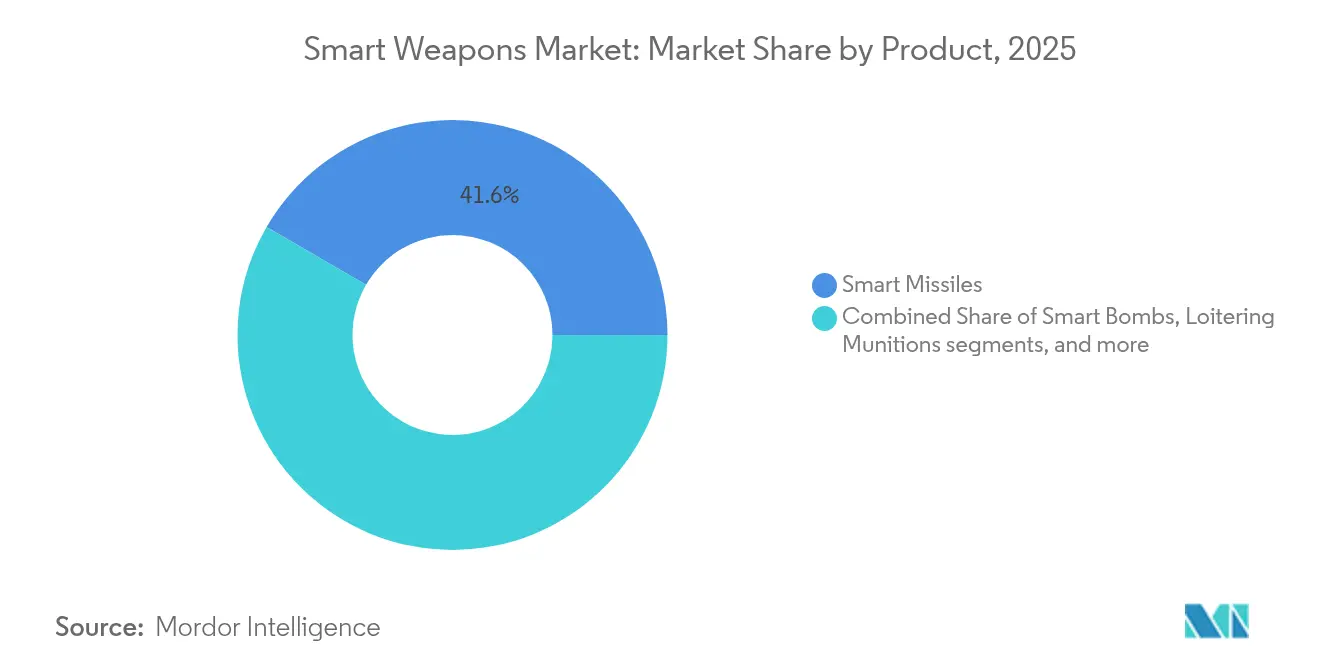
- By product type, smart missiles led the smart weapons market with a 41.62% revenue share in 2025, while directed-energy weapons are projected to grow at a 9.66% CAGR through 2031.
- By technology, satellite/GNSS guidance held 32.12% of the smart weapons market share in 2025; multi-mode and AI-enabled guidance is expanding at a 10.05% CAGR to 2031.
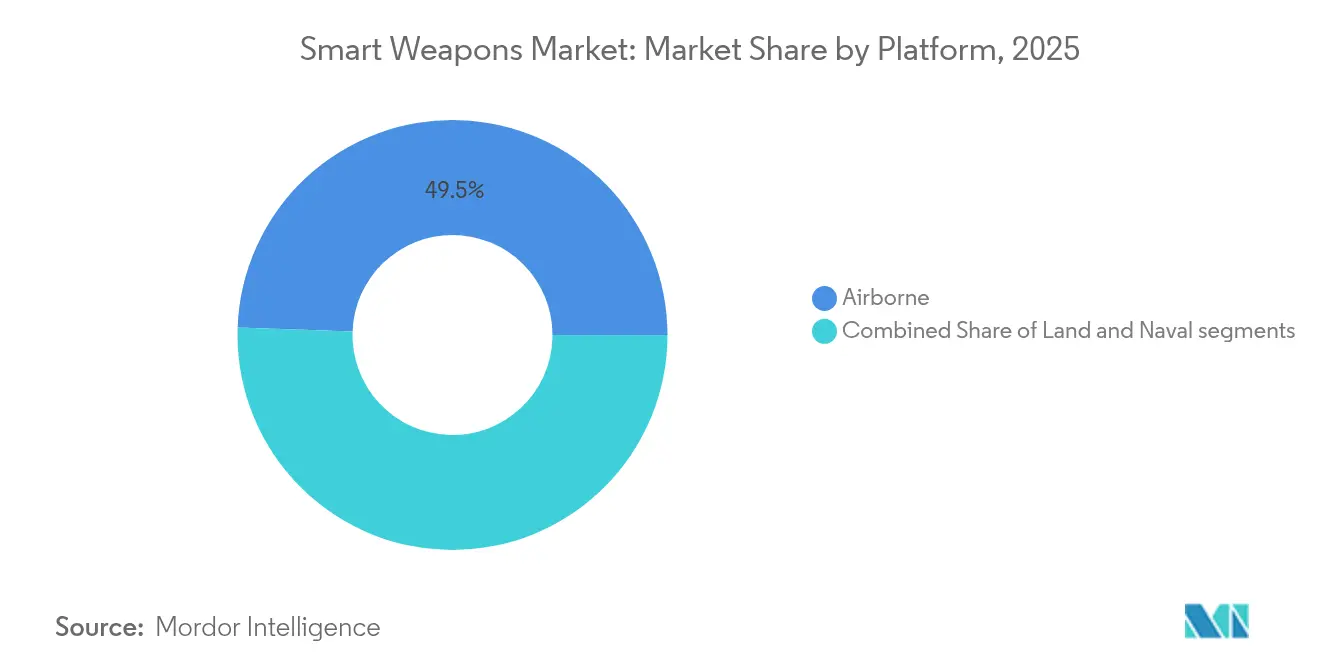
- By platform, airborne systems accounted for 49.45% of the smart weapons market in 2025 and are advancing at a 9.86% CAGR between 2026 and 2031.
- By end-user, the military segment dominated with 92.11% share in 2025, while homeland security demand is rising at a 9.41% CAGR to 2031 in the smart weapons market.
- By geography, North America retained 36.35% of the smart weapons market share in 2025; Asia-Pacific is the fastest-growing region at a 9.12% CAGR through 2031.
Note: Market size and forecast figures in this report are generated using Mordor Intelligence’s proprietary estimation framework, updated with the latest available data and insights as of 2026.
Global Smart Weapons Market Trends and Insights
Drivers Impact Analysis*
| Driver | (~) % Impact on CAGR Forecast | Geographic Relevance | Impact Timeline |
|---|---|---|---|
| Rising defense expenditures across leading economies | +1.8% | NATO countries, Asia-Pacific | Medium term (2-4 years) |
| Emphasis on precision strike to minimize collateral damage | +1.2% | Global urban theaters | Long term (≥ 4 years) |
| Modernization to counter-peer and near-peer adversaries | +1.5% | North America, Europe, Asia-Pacific | Medium term (2-4 years) |
| Breakthroughs in multi-mode guidance technologies | +0.9% | Early-adopter forces worldwide | Long term (≥ 4 years) |
| Emergence of 5G-enabled cooperative swarming munitions | +0.7% | North America and EU, spill-over to APAC | Long term (≥ 4 years) |
| Miniaturization via MEMS sensors enabling cost-efficient scale-up | +0.6% | Global, with manufacturing concentration in APAC | Medium term (2-4 years) |
| Source: Mordor Intelligence | |||
Rising Defense Expenditures Across Leading Economies
NATO members surpassed the 2% of GDP defense-spending benchmark for the first time since the Cold War, propelling year-on-year demand for precision-guided inventories in the smart weapons market. Germany’s USD 88.5 billion budget increase and Greece’s USD 27 billion rearmament plan are directing sizeable allocations toward smart missiles, glide bombs, and standoff capabilities. The EU’s ReArm Europe initiative is underwriting joint procurement lots that cut unit prices by scaling production volumes across multiple states. This synchronized spending allows prime contractors to shift from cyclical to line-rate manufacturing, trimming lead times and easing amortization of new production tooling. The flip side is capacity stress: parallel orders for similar subsystems from several allied programs create pinch points in solid-state seeker supply chains and propellant mixes, raising the risk of schedule overruns in the smart weapons market.
Emphasis on Precision Strike to Minimize Collateral Damage
The urban character of recent conflicts has severely punished indiscriminate fires, steering commanders toward more than 90% single-round hit probabilities delivered by systems such as HIMARS and GMLRS rockets in the smart weapons market. Precision requirements have expanded beyond accuracy, encompassing mid-course retargeting and in-flight abort features, as highlighted by MBDA’s Spear 3 collaborative targeting missile that shifts aimpoints if civilians re-enter the strike zone.[1]Aviation Week, “MBDA Spear 3 Advances Collaborative Targeting,” aviationweek.com To avoid political fallout, planners specify smaller, more lethal warheads and fuzing profiles optimized for blast focusing rather than area saturation. This ethical-operational convergence embeds precision-guided munitions at every echelon from squad assault launchers to long-range hypersonic weapons.
Modernization to Counter Peer and Near-Peer Adversaries
Anti-access/area-denial bubbles and advanced electronic-warfare suites fielded by China and Russia have exposed the vulnerability of single-mode, GPS-reliant weapons. The US Navy responded by extending the AIM-174B range to 250 miles to strike from outside integrated air-defense zones. Russia’s spoofing tactics push Western programs to integrate resilient inertial, imaging, and passive-RF correlators. In Asia-Pacific, Japan’s railgun and hypersonic-interceptor efforts, and India’s quick-reaction surface-to-air missile (QRSAM) trials, illustrate how regional actors converge on counter-A2/AD capability sets that hinge on smart weapons.
Breakthroughs in Multi-Mode Guidance Technologies
AI-fused sensor suites are redefining terminal accuracy in the smart weapons market.Saab flight-tested AI agents on Gripen jets, showing that onboard algorithms can choreograph multiple weapons, switch seekers mid-course, and discriminate decoys in saturated EW environments. Thales’ MEMS-based inertial measurement units now hold accuracy within 0.2°/h drift while surviving GNSS denial, enabling low-cost artillery kits to rival legacy cruise-missile CEPs.[2]Defense SA, “Thales Expands MEMS IMU Production,” defencesa.com Cooperative weapon swarms, where missiles share seeker feeds via jam-resistant datalinks, cut the rounds-per-target ratio by 30-40%, freeing magazine capacity for additional missions.
Restraints Impact Analysis*
| Restraint | (~) % Impact on CAGR Forecast | Geographic Relevance | Impact Timeline |
|---|---|---|---|
| Restrictive export regulations and ITAR compliance barriers | -0.8% | US allies, global re-exporters | Medium term (2-4 years) |
| High development costs and expensive unit acquisition | -1.1% | All regions | Long term (≥ 4 years) |
| Susceptibility to GNSS spoofing and electronic warfare disruption | -0.6% | Global, with heightened risk in contested environments | Short term (≤ 2 years) |
| Growing ethical and legal scrutiny of autonomous lethal systems | -0.4% | North America and EU primarily, with global implications | Long term (≥ 4 years) |
| Source: Mordor Intelligence | |||
Restrictive Export Regulations and ITAR Compliance Barriers
The US International Traffic in Arms Regulations extends licensing phases up to 18 months for seeker algorithms and AI software, delaying deliveries and inflating holding costs for overseas buyers. Switzerland’s F-35A procurement saw USD 650 million in additional expenses tied partly to compliance overheads. European OEMs are ring-fencing R&D to create ITAR-free product lines—a prime example of MBDA’s Orchestrike networked glide weapons—to secure sovereign upgrade rights and bypass re-export constraints. The regulatory drag fragments the smart weapons market by forcing dual designs for domestic and export configurations, limiting economies of scale.
High Development Costs and Expensive Unit Acquisition
The US Army’s Excalibur precision shell now approaches USD 100,000 per round, nearly double its 2021 figure, spotlighting an affordability crisis that curtails magazine depth. F-35 unit prices have climbed to USD 140 million; next-generation fighters project to USD 300 million, outpacing budget growth. Component inflation erodes profit margins under fixed-price contracts, especially gallium-nitride chips and energetic compounds. The Pentagon’s Replicator initiative and General Atomics’ low-cost missile award represent deliberate moves to invert cost-exchange ratios against adversaries by fielding thousands of expendable smart weapons rather than hundreds of exquisite platforms.
*Our forecasts treat driver/restraint impacts as directional, not additive. The impact forecasts reflect baseline growth, mix effects, and variable interactions.
Segment Analysis
By Product: Smart missiles hold dominant footing while directed-energy gains momentum
Smart missiles commanded 41.62% of the smart weapons market in 2025 through their adaptability across air-to-air, land-attack, and anti-ship roles. RTX’s AIM-9X Sidewinder and Lockheed Martin’s JASSM-ER exemplify repeat-order programs that sustain line-rate production. Combat after-action reports reveal consistently more than 90% PK rates when paired with modern seekers, reinforcing budget prioritization. Smart bombs maintain relevance for close-air-support where collateral-damage thresholds are tight, while guided rockets satisfy high-volume suppression fires; loitering munitions bridge ISR and immediate strike, reducing sensor-to-shooter latency.
Directed-energy weapons are registering the fastest 9.66% CAGR to 2031. DragonFire laser trials demonstrated sub-5 cm tracking precision at multi-kilometer ranges, offering near-zero cost per shot once deployed. High-power microwave pods tested aboard US Navy platforms neutralized drone swarms without expending kinetic rounds, signaling a doctrinal shift toward layered, non-depletable defenses. Industrialization hurdles—chiefly power density and thermal management—are receding as shipboard integrated power systems mature.


By Technology: GNSS guidance dominates yet AI-driven multi-mode systems surge
Satellite/GNSS guidance retained a 32.12% share in 2025, due to global coverage and low incremental cost per kit in the smart weapons market. CEPs below 3 m under benign conditions keep it attractive for uncontested engagements. Laser guidance upholds niche suitability for designator-rich environments, while radar seekers underpin all-weather performance in naval and strike roles. Infrared imaging remains crucial for passive terminal homing against heat-rich targets.
Multi-mode guidance integrating AI exhibits a 10.05% CAGR to 2031. Saab’s AI-empowered Gripen sorties illustrate how neural agents blend IR, MMW radar, and optical flows in milliseconds, sustaining lock amidst GNSS outages. MEMS IMUs and low-SWaP-C RF chips drive this convergence, allowing artillery glide kits to exhibit cruise-missile-level autonomy. Cooperative targeting protocols, where multiple munitions negotiate impact sequencing, cut salvo size, and saturate defenses through pincer trajectories.
By Platform: Airborne systems preserve strategic edge
Airborne launch platforms accounted for 49.45% of the smart weapons market size in 2025 and are rising at a 9.86% CAGR, anchored by the integration capacity of fifth-generation fighters and MALE-class drones. The USAF’s NGAD and Collaborative Combat Aircraft programs confirm a doctrine where manned-unmanned teaming expands weapons carriage and survivability. Production of Small Diameter Bombs and AGM-158 series cruise missiles will keep pace with manned-fighter fleet refreshes into the 2030s.
Land platforms rely on modular launchers like HIMARS that fire rockets and precision missiles, offering deployability that offsets lower range than air assets in the smart weapons market. Naval platforms are re-emerging as standoff arsenals; Maritime Strike Tomahawk and forthcoming HALO hypersonic variants extend blue-water strike envelopes beyond 1,500 km, enabling fleet-in-being deterrence in contested seas. Integration of vertical-launch and deck-mounted laser arrays on next-generation destroyers will blend kinetic and directed-energy engagements from a single hull.
By End-User: Military budgets dominate; homeland security demand accelerates
Military customers represented 92.11% of smart weapons demand in 2025, reflecting mission alignment with state-on-state deterrence and expeditionary warfare. Bulk procurement of air-delivered weapons for stockpile replenishment after real-world usage in Ukraine sustains elevated production tempos. Army, navy, and air force roadmaps across NATO and Indo-Pacific forces prioritize indigenous smart weapon integration to maximize sovereignty over ammunition resupply.
Homeland security agencies, though small, show a 9.41% CAGR to 2031 as border-security doctrines adopt calibrated force solutions in the smart weapons market. The US DHS fielded smart rifle scopes with facial recognition, while European interior ministries trial counter-UAS missiles capable of precise kinetic intercepts within urban perimeters. Budgetary appetite for precision is rising amid drone incursions, critical-infrastructure protection, and counter-terror raids where minimizing bystander risk is paramount.
Geography Analysis
North America captured 36.35% of the smart weapons market share in 2025 as the US obligated USD 4.94 billion to Precision Strike Missile and USD 6.9 billion to Small Diameter Bomb production lines. Canada’s involvement in multinational missile programs and its Stand-Off Weapons Optimization Project further anchors continental demand. A mature industrial base featuring vertical integration from seeker fabs to warhead foundries shields the region from the worst supply-chain shocks, yet semiconductor scarcity is prompting strategic stockpiles.
Europe’s trajectory is steepening post-Ukraine. Germany’s 180% budget hike to USD 88.5 billion and the union-level ReArm Europe fund are underwriting expanded final-assembly halls for MBDA and Saab. The continent’s focus on technological sovereignty, epitomized by Franco-German FC/ASW development and BAE-led laser demonstrators, is diluting reliance on US export licensing. Eastern-flank allies are accelerating orders for precision rocket artillery, creating distributed production offsets from Poland to the Baltic.
Asia-Pacific posts the fastest 9.12% CAGR to 2031 in the smart weapons market. China’s A2/AD escalation is catalyzing Japanese railgun and hypersonic counters, Indian QRSAM rollouts, and Philippine missile purchases under a USD 35 billion plan. Taiwan is expediting orders for AIM-120D and indigenous Sky Sword-2 variants. At the same time, Australia’s AUKUS pillar ensures long-range strike cooperation with the US and UK. South Korea’s exports of the KF-21 fighter and precision glide bombs are adding competitive pressure and supply-chain diversification. Regional industrial partnerships—such as Hanwha’s investment in Australian guided-rocket plants—signal a shift toward local co-production in the smart weapons market.

Competitive Landscape
A moderate consolidation defines the smart weapons industry: the top five firms—Lockheed Martin Corporation, RTX Corporation, The Boeing Company, Northrop Grumman Corporation, and BAE Systems plc—hold more than 50% of revenue share, balancing scale advantages with room for niche entrants. Vertical integration strategies protect intellectual property across seekers, fuzes, and propulsion, and create high switching costs for governments. Nevertheless, inflation and component shortages erode fixed-price margins, prompting primes to invest in digital twins and additive manufacturing that compresses qualification timelines.
Competitive heat intensified in 2025 when General Atomics secured a Pentagon contract for low-cost missiles to saturate adversary defenses.[4]Asia Times, “General Atomics Wins Low-Cost Missile Bid,” asiatimes.com This award legitimizes disruptors that champion affordability over exquisite performance. Saab’s AI integration success on Gripen fighters demonstrates how software-centric upgrades can outpace traditional hardware refresh cycles, emphasizing agility as a determinant of market share. Directed-energy niches attract defense stalwarts and dual-use photonics startups; the latter exploit commercial laser-communications know-how to shortcut defense R&D loops.
Supply-chain resilience is a focal point. Primes are re-shoring gallium-nitride foundry capacity and establishing multi-sourcing for IMUs to hedge geopolitical risk. Collaborative frameworks such as the European Guided Multiple Launch Rocket System (GMLRS) consortium illustrate how allied governments encourage cross-border production to distribute risk while preserving strategic autonomy.
Smart Weapons Industry Leaders
Lockheed Martin Corporation
RTX Corporation
The Boeing Company
BAE Systems plc
Northrop Grumman Corporation
- *Disclaimer: Major Players sorted in no particular order

Recent Industry Developments
- June 2025: Australia and the United States signed a memorandum of understanding for the Precision Strike Missile (PrSM) production and development, enabling the Australian Armed Forces to access the tactical ballistic missile system used by the US military.
- February 2025: Bharat Electronics Limited (BEL) and Safran Electronics & Defence formed a joint venture to manufacture, customize, and maintain HAMMER (Highly Agile Modular Munition Extended Range) smart precision-guided air-to-ground weapons in India.
- January 2024: The US Air Force awarded Raytheon (RTX Corporation), a USD 400 million contract to produce and deliver over 1,500 StormBreaker smart weapons. StormBreaker is an air-to-surface, network-enabled weapon that engages moving targets in all weather conditions using its multi-effects warhead and tri-mode seeker.


Global Smart Weapons Market Report Scope
Smart weapons are computer-guided munitions equipped with radio, infrared, laser, global positioning system, and satellite guidance systems, which give extraordinary accuracy and precision. Smart weapons are also termed precision-guided weapons that are intended to hit the target precisely and reduce collateral damage and lethality. Smart weapons are operated and assisted using external operating systems located far away in the geographical area.
The smart weapons market is segmented based on product, technology, platform, end user, and geography. By product, the market is segmented into missiles, ammunition, and others. By technology, the market is segmented into satellite guidance, radar guidance, infrared guidance, and laser guidance. By platform, the market is segmented into land, sea, and air. By end user, the market is segmented into law enforcement and military. The report also covers the market sizes and forecasts for the smart weapons market in major countries across different regions. For each segment, the market size is provided in terms of value (USD).
| Smart Missiles |
| Smart Bombs |
| Guided Rockets and Projectiles |
| Loitering Munitions |
| Directed Energy Weapons |
| Satellite/GNSS Guidance |
| Laser Guidance |
| Radar Guidance |
| Infra-Red/Imaging Guidance |
| Multi-mode and AI-enabled Guidance |
| Land |
| Airborne |
| Naval |
| Military |
| Homeland Security |
| North America | United States | |
| Canada | ||
| Mexico | ||
| Europe | United Kingdom | |
| Germany | ||
| France | ||
| Rest of Europe | ||
| Asia-Pacific | China | |
| India | ||
| Japan | ||
| South Korea | ||
| Rest of Asia-Pacific | ||
| South America | Brazil | |
| Rest of South America | ||
| Middle East and Africa | Middle East | Saudi Arabia |
| United Arab Emirates | ||
| Rest of Middle East | ||
| Africa | South Africa | |
| Rest of Africa | ||
| By Product | Smart Missiles | ||
| Smart Bombs | |||
| Guided Rockets and Projectiles | |||
| Loitering Munitions | |||
| Directed Energy Weapons | |||
| By Technology | Satellite/GNSS Guidance | ||
| Laser Guidance | |||
| Radar Guidance | |||
| Infra-Red/Imaging Guidance | |||
| Multi-mode and AI-enabled Guidance | |||
| By Platform | Land | ||
| Airborne | |||
| Naval | |||
| By End-User | Military | ||
| Homeland Security | |||
| By Geography | North America | United States | |
| Canada | |||
| Mexico | |||
| Europe | United Kingdom | ||
| Germany | |||
| France | |||
| Rest of Europe | |||
| Asia-Pacific | China | ||
| India | |||
| Japan | |||
| South Korea | |||
| Rest of Asia-Pacific | |||
| South America | Brazil | ||
| Rest of South America | |||
| Middle East and Africa | Middle East | Saudi Arabia | |
| United Arab Emirates | |||
| Rest of Middle East | |||
| Africa | South Africa | ||
| Rest of Africa | |||


Key Questions Answered in the Report
What is the current value of the smart weapons market?
The smart weapons market stands at USD 22.26 billion in 2026 and is forecasted to hit USD 31.89 billion by 2031.
Which product segment leads the market?
Smart missiles hold the leading 41.62% revenue share, owing to their versatility across multiple mission profiles.
Why are directed-energy weapons attracting attention?
They promise near-zero to cost per shot and unlimited magazine depth, critical for defeating swarms of low-cost threats.
Which region is growing the fastest?
Asia-Pacific posts the highest 9.12% CAGR, driven by Chinese A2/AD challenges and regional modernization programs.
How are export regulations affecting the industry?
ITAR and related controls extend delivery schedules up to 18 months and force separate domestic and export product lines, curbing economies of scale.
What strategic moves are primes making to control costs?
Contractors are adopting digital engineering, additive manufacturing, and low-cost missile lines to counter inflation and maintain affordability.
Page last updated on:


