
Chemicals & Materials
7th MayStrategic Expansion of Floor Coatings in the MEIA Region
4 Min Read
The Tartaric Acid Market Report is Segmented by Type (Natural Tartaric Acid, Synthetic Tartaric Acid), Application (Preservative and Additive, Laxative, Intermediate, and Other Applications), End-User Industry (Food and Beverage, Pharmaceutical, Cosmetics, Construction, and Other End-User Industries), and Geography (Asia-Pacific, North America, Europe, South America, and Middle-East and Africa).
Market Overview
| Study Period | 2020 - 2031 |
|---|---|
| Market Volume (2026) | 141.97 kilotons |
| Market Volume (2031) | 181.39 kilotons |
| CAGR | 5.02 % |
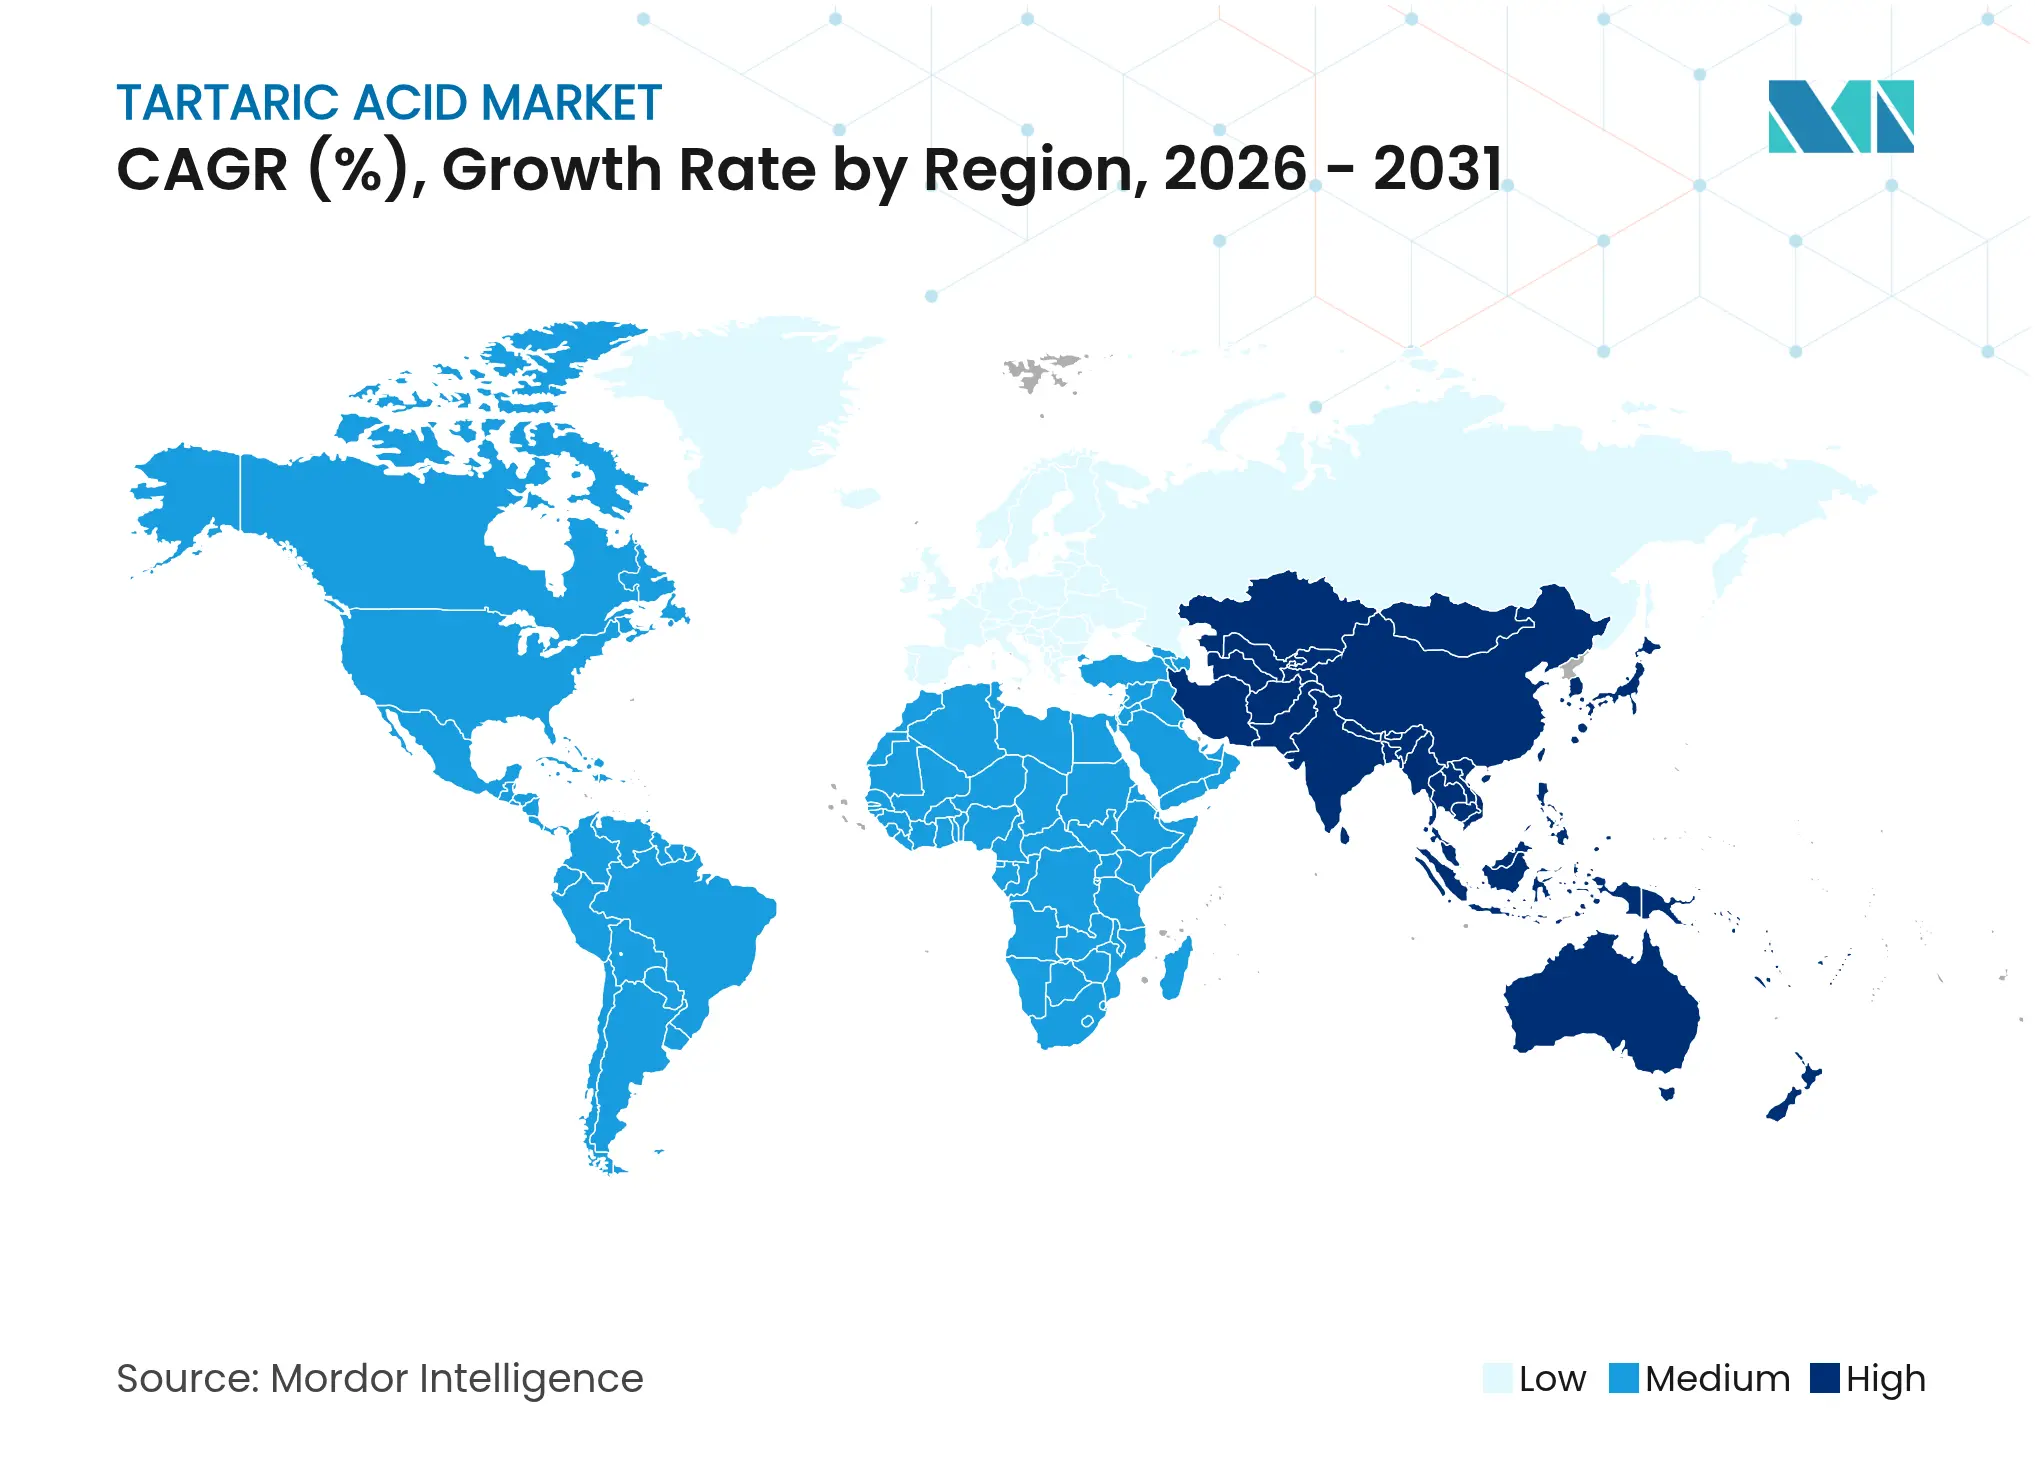
| Fastest Growing Market | Asia Pacific |
| Largest Market | Asia Pacific |
| Market Concentration | High |
Major Players *Disclaimer: Major Players sorted in no particular order. Image © Mordor Intelligence. Reuse requires attribution under CC BY 4.0. |
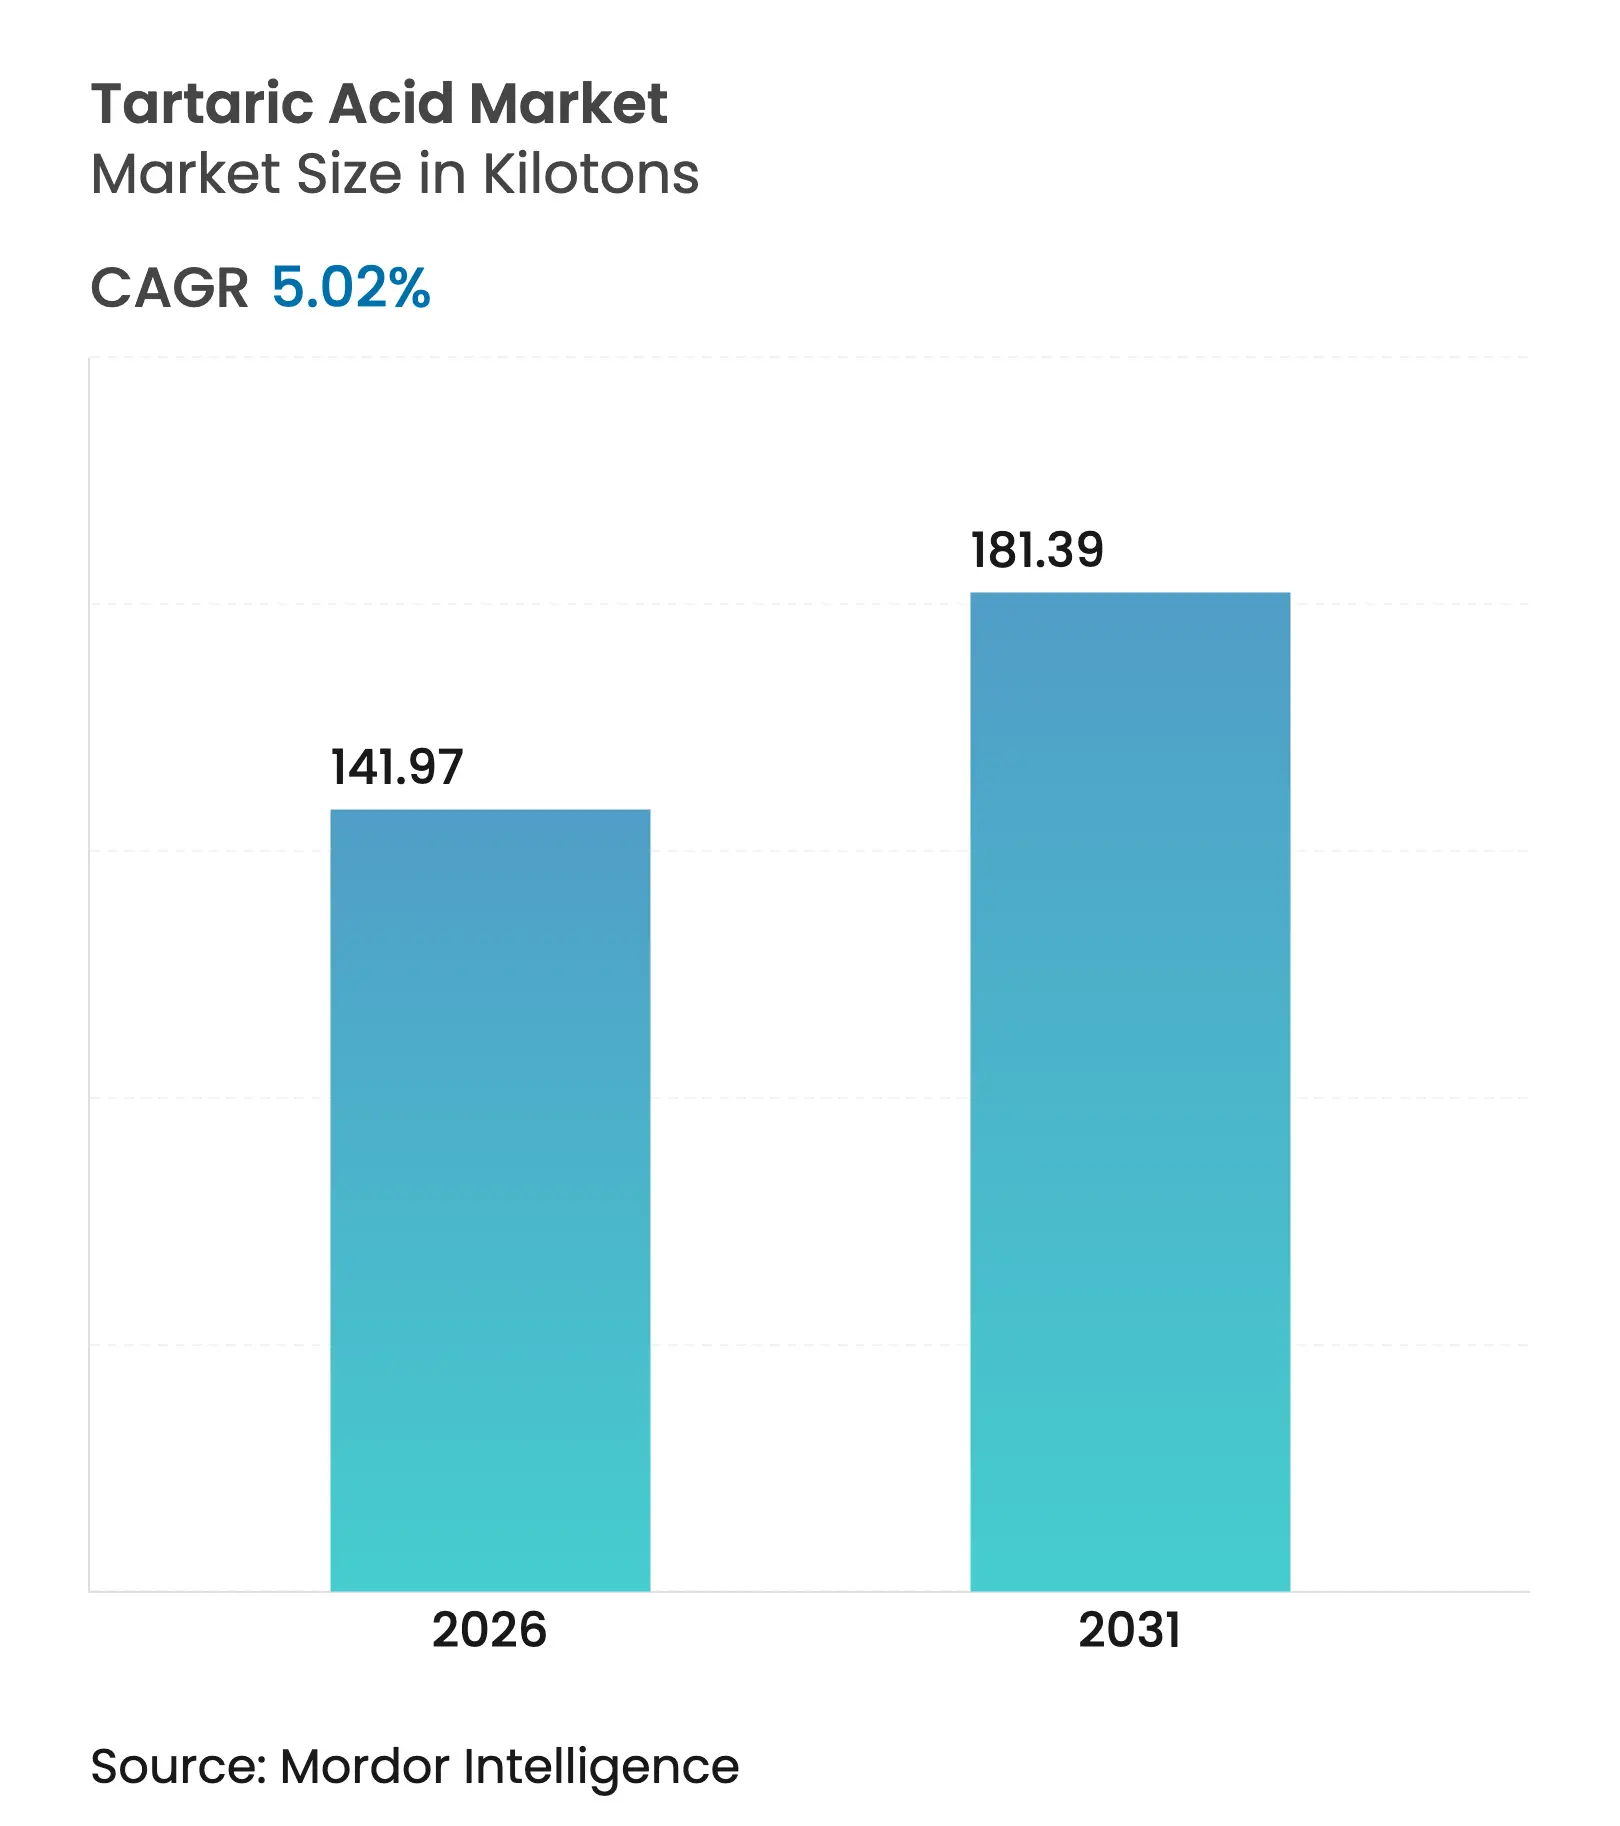
The Tartaric Acid Market size was valued at 135.19 kilotons in 2025 and estimated to grow from 141.97 kilotons in 2026 to reach 181.39 kilotons by 2031, at a CAGR of 5.02% during the forecast period (2026-2031). This progression mirrors the compound’s broad utility, stretching from wine stabilization to advanced pharmaceutical excipients. Supply resilience anchors the tartaric acid market because producers can toggle between grape-derived recovery and maleic anhydride synthesis, cushioning raw-material shocks. Elevated purity specifications in wine making, rising clean-label food preferences, and steady pharmaceutical formulations are together widening the commercial base. At the same time, sustainability pressures spur investment in electrodialysis and other energy-saving processes that trim production costs for synthetic grades without eroding the quality edge held by natural variants.
Key Report Takeaways
Note: Market size and forecast figures in this report are generated using Mordor Intelligence's proprietary estimation framework, updated with the latest available data and insights as of 2026.
Drivers Impact Analysis
| Driver | (~) % Impact on CAGR Forecast | Geographic Relevance | Impact Timeline | |||
|---|---|---|---|---|---|---|
Growing demand for wine production
Growing demand for wine production
| +0.8% | Europe, North America, South America | Medium term (2-4 years) | (~) % Impact on CAGR Forecast:
+0.8%
|
Geographic Relevance
:
Europe, North America, South America
|
Impact Timeline
:
Medium term (2-4 years)
|
Rising pharmaceutical excipient demand
Rising pharmaceutical excipient demand
| +1.2% | Global, with concentration in Asia-Pacific | Long term (≥ 4 years) | |||
Micro-encapsulation adoption in nutraceuticals
Micro-encapsulation adoption in nutraceuticals
| +0.6% | North America, Europe | Medium term (2-4 years) | |||
Shift toward natural acidity regulators in clean-label
foods
Shift toward natural acidity regulators in clean-label
foods
| +1.0% | Global | Short term (≤ 2 years) | |||
Emerging use in bee-mite biocontrol formulations
Emerging use in bee-mite biocontrol formulations
| +0.3% | Global, early adoption in Europe | Long term (≥ 4 years) | |||
| Source: Mordor Intelligence | ||||||
Growing Demand for Wine Production
Lower global wine output, which fell to 226 million hectoliters in 2024, has paradoxically lifted demand for external tartaric acid supplies as producers rely less on in-house grape waste recovery. Scarcity premiums enable European natural producers to secure 15–20% higher prices over synthetic offerings. Trials in Virginia show that potassium-based tartaric additions before fermentation deliver superior sensory scores versus post-fermentation use. Climate-driven rises in grape potassium further increase routine acidification needs. The International Organisation of Vine and Wine now stipulates 99.5% purity, a threshold favoring established natural suppliers. Producers also valorize distillery vinasses, reaching 69.7% purity via electrodialysis, aligning quality goals with circular-economy mandates.
Rising Pharmaceutical Excipient Demand
The tartaric acid market benefits from the compound’s chiral properties that aid drug dissolution, tablet disintegration, and bioavailability. Banana-starch complexes outperform standard super-disintegrants in disintegration time. FDA guidance treats tartaric acid as GRAS, lowering regulatory hurdles. Patent filings for metalloproteinase inhibition and antimicrobial actives underscore therapeutic potential. Growth in laxative formulations accelerates at 6.06% CAGR as aging populations seek gentle natural options. Harmonized daily-intake limits of 240 mg/kg in the United States and European Union streamline global product rollouts.
Micro-Encapsulation Adoption in Nutraceuticals
Nutraceutical labels incorporate micro-encapsulated tartaric acid to blunt sourness and shield antioxidants, broadening adoption across sports blends, functional beverages, and anti-aging mixes. Non-polar beverage emulsions and spray-dried powders now include the compound to stabilize flavor systems. Encapsulation also tempers hygroscopicity in liquids, extending shelf life. In metabolic-health concepts, tartaric acid combines with citric and malic acids for phased energy release, though confirmatory trials remain scarce. Regulatory acceptance is higher in Europe, while many Asian markets take a cautious stance on novel encapsulates.
Shift toward Natural Acidity Regulators in Clean-Label Foods
Consumer push for recognizable ingredients propels the tartaric acid market as manufacturers replace synthetic acidulants. EU quantum status gives formulators flexibility with dosing under Regulation 1333/2008. Stable isotopic fingerprinting confirms grape origin, securing brand integrity. USDA organic rules favor plant-derived supply, benefiting processors that recover acid from grape pomace usda.gov. Ethnic food growth within Europe and North America heightens demand for authenticity that synthetic variants struggle to match.
Restraints Impact Analysis
| Restraint | (~) % Impact on CAGR Forecast | Geographic Relevance | Impact Timeline | |||
|---|---|---|---|---|---|---|
Regulatory scrutiny on synthetic tartaric acid residues
Regulatory scrutiny on synthetic tartaric acid residues
| -0.7% | Global, particularly Asia-Pacific | Short term (≤ 2 years) | (~) % Impact on CAGR Forecast:
-0.7%
|
Geographic Relevance
:
Global, particularly Asia-Pacific
|
Impact Timeline
:
Short term (≤ 2 years)
|
Availability of suitable substitutes
Availability of suitable substitutes
| -0.9% | Global | Medium term (2-4 years) | |||
Price pressure from alternative organic acids
Price pressure from alternative organic acids
| -0.6% | Global, concentrated in price-sensitive markets | Short term (≤ 2 years) | |||
| Source: Mordor Intelligence | ||||||
Regulatory Scrutiny on Synthetic Tartaric Acid Residues
Traceability gaps exposed by the European Parliament spur stricter oversight that raises compliance outlays for Chinese synthetic plants[1]European Parliament, “Traceability of Organic Acids,” europarl.europa.eu. Heavy-metal limits introduced in EFSA’s 2024 opinion require costlier purification. Coupled with isotope testing, regulators can now discern fermentation-derived and petrochemical origins, tightening import inspections.
Availability of Suitable Substitutes
Citric, malic, lactic, and ascorbic acids vie for the same acidity, chelation, and antioxidant roles. Citric acid undercuts tartaric prices by up to 30% in beverages and confectionery. Lactic acid from corn fermentation gains traction in pharmaceutical excipients for its biocompatibility. Blended systems further dilute single-acid dependence, depressing volume prospects.
By Type: Natural Dominance Faces Synthetic Challenge
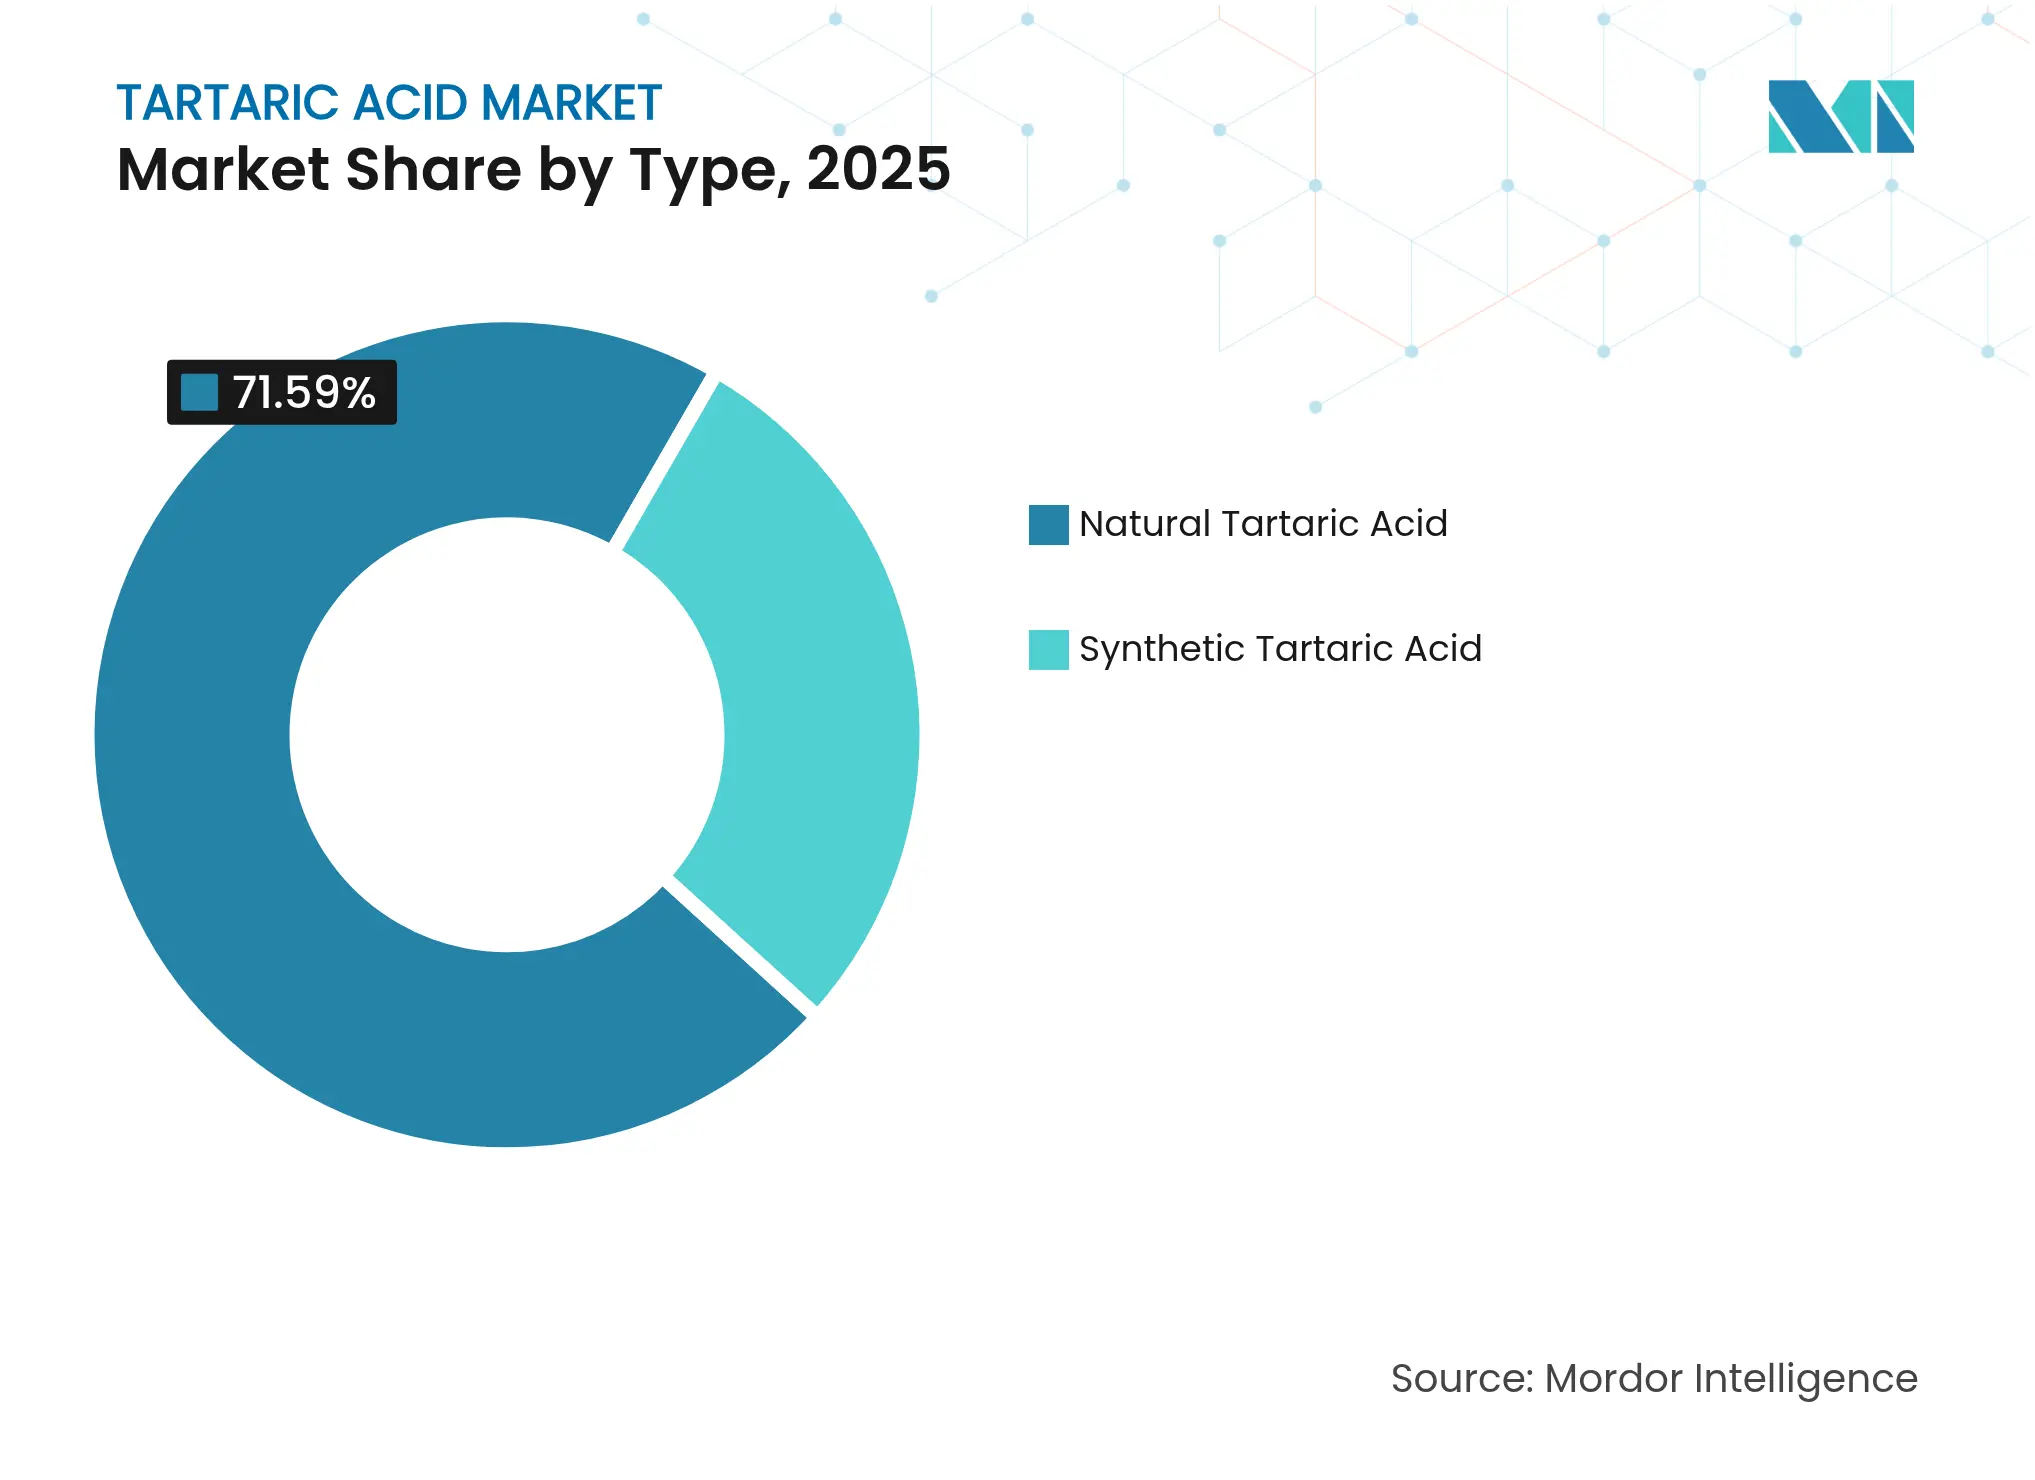
The natural grade of the tartaric acid market commanded 71.59% share in 2025 on the strength of integrated grape-waste processing. Natural recovery thrives in Europe, where wine producers extract acid as a byproduct, slashing feedstock costs. Synthetic capacity, concentrated in China, is gaining pace at a 5.66% CAGR because maleic anhydride furnishes an agricultural-cycle-free route. Sustainable membrane electrodialysis cuts energy use by 30%, narrowing cost gaps.
Synthetic producers tout uniform purity and year-round availability, attracting buyers focused on predictable specifications. Natural suppliers counterbalance with organic certification advantages and premium positioning in clean-label foods. Alvinesa’s acquisitions in Chile and Argentina underpin continuous grape-waste flows across hemispheres. As regulatory bodies favor plant-origin acids in organic labeling, natural volumes are likely to hold majority share even as synthetics gain numerical ground within the tartaric acid market.
Note: Segment shares of all individual segments available upon report purchase
By Application: Preservatives Lead, Laxatives Accelerate
Preservative and additive uses retained 57.10% of tartaric acid market size in 2025, reflecting the compound’s proven role in shelf-life extension and pH control. Growth also emerges from novel construction admixtures in cement, where tartaric acid slows chloride-induced corrosion. Though mature, the preservative segment benefits from brand shifts toward natural labels that discourage benzoates and phosphates.
Laxative demand marks the swiftest rise at 5.84% CAGR, driven by consumer preference for mild, plant-based relief and an expanding senior demographic. Tartaric acid’s stereochemical fit enhances drug dispersibility, supporting fixed-dose combinations in over-the-counter digestive aids. Chiral intermediate use in APIs adds another steady offtake. Together these outlets underpin a broader application mix that stabilizes pricing spreads in the tartaric acid market.
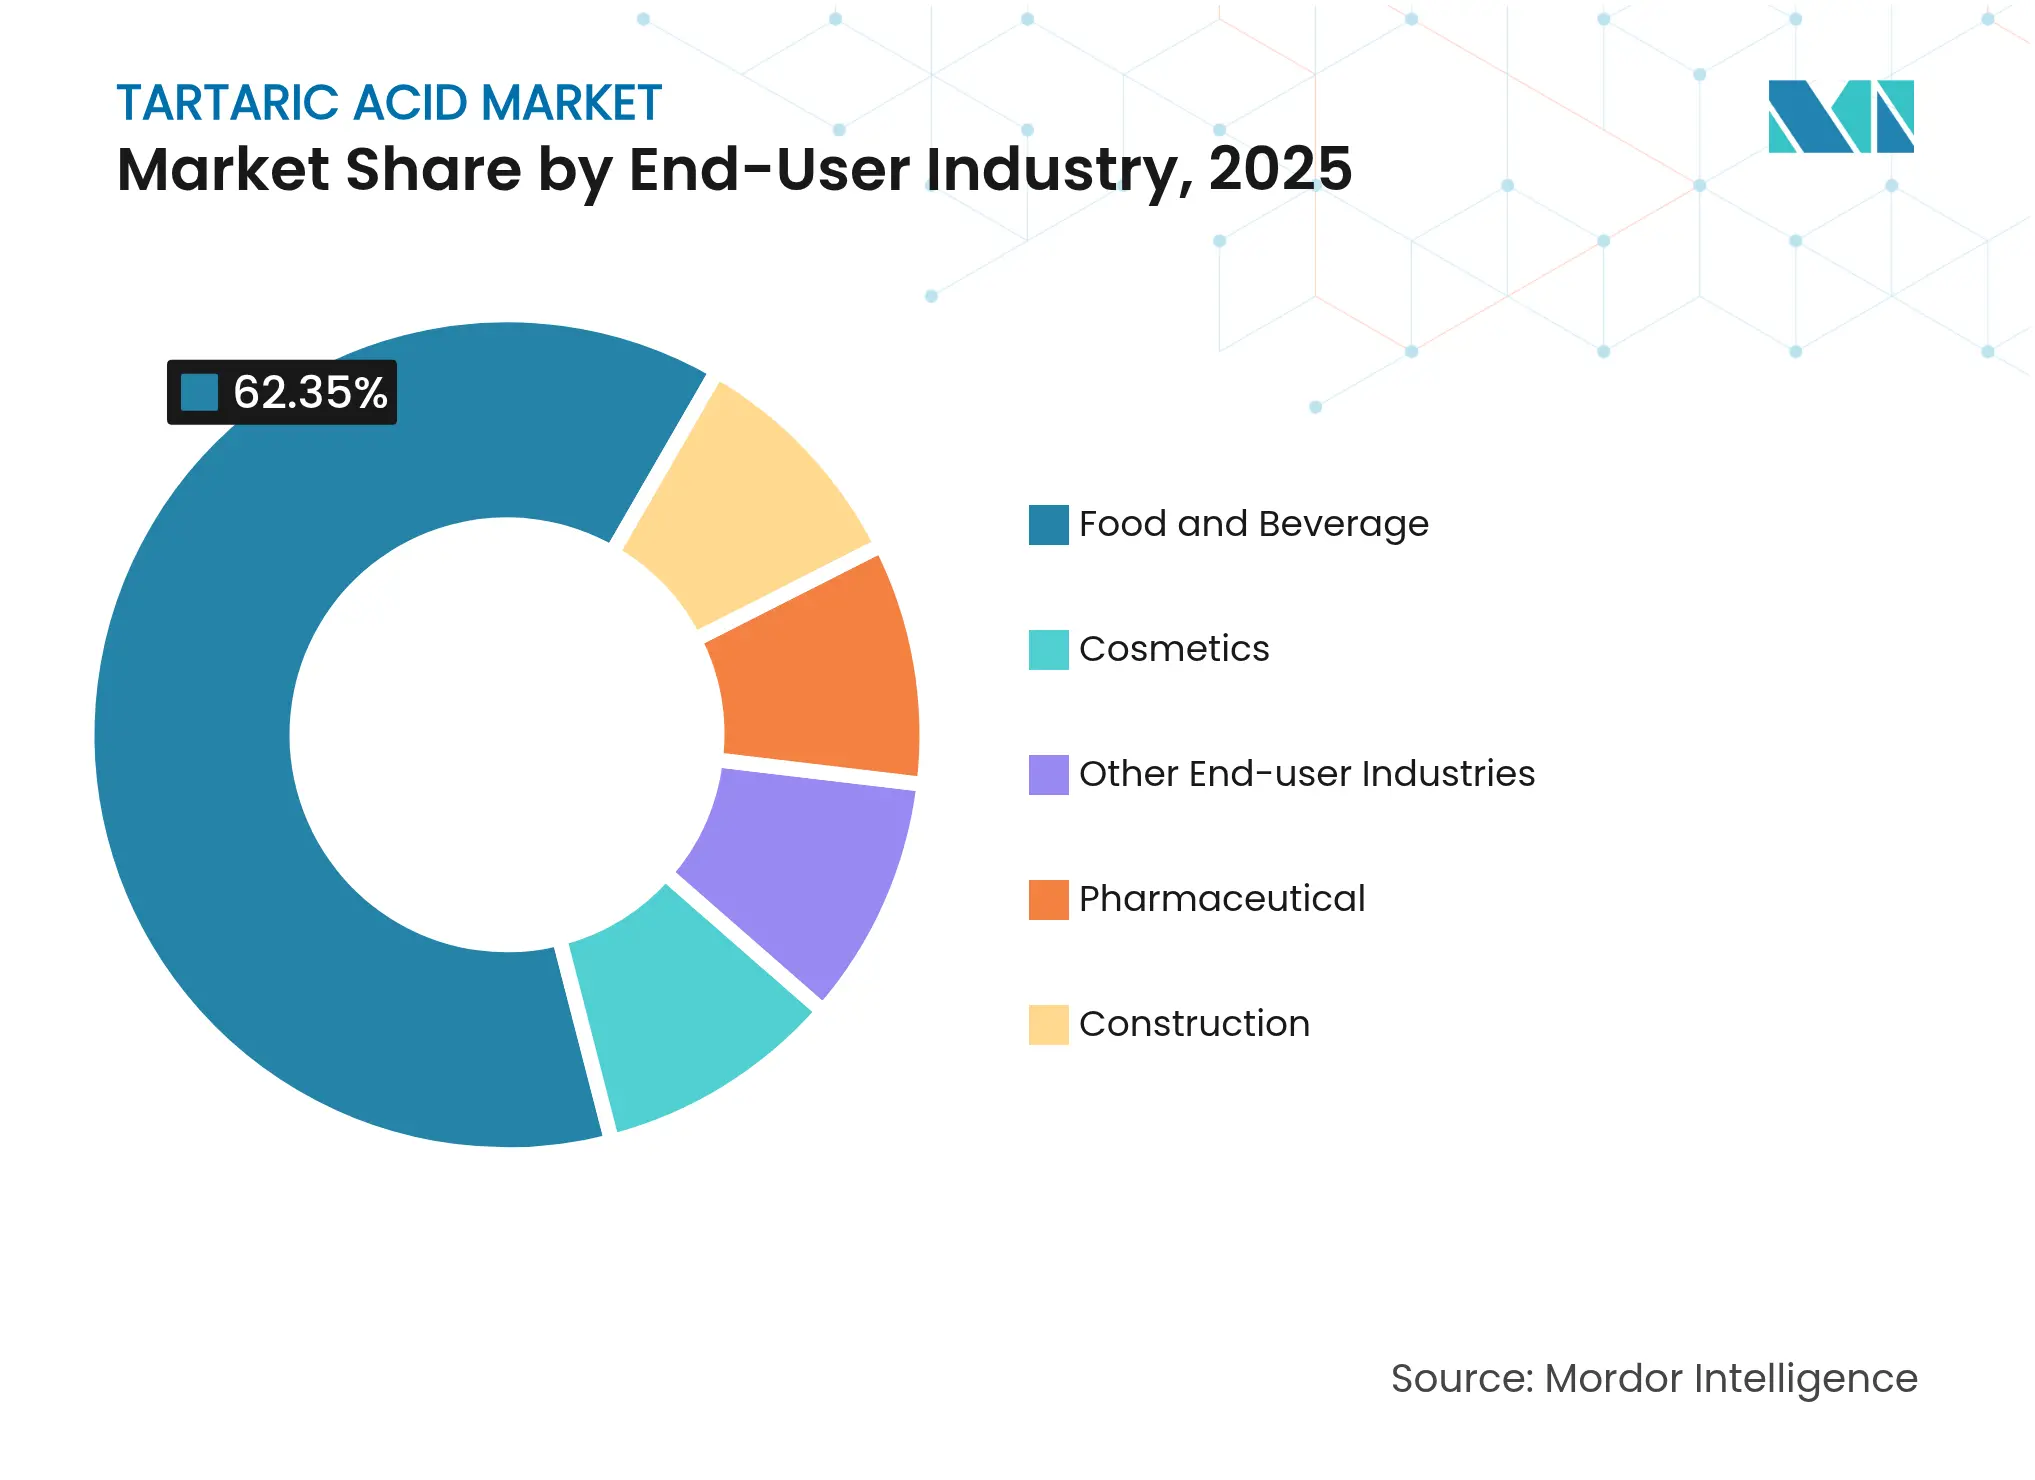
By End-user Industry: Food Dominance, Cosmetics Surge
Food and beverage maintained 62.35% leadership of tartaric acid market share in 2025 due to irreplaceable roles in wine adjustment, baking powders, and flavor balancing. Growth continues in ready-to-drink beverages and ethnic specialties relying on authentic acidity profiles. Pharmaceutical buyers sustain baseline demand for excipients, while construction engineers turn to tartaric acid for eco-friendly concrete retardation.
Cosmetics revenue, though smaller, is projected to expand at 5.92% CAGR as alpha-hydroxy acid skin-care lines multiply across mass and prestige channels. Studies show tartaric acid improves skin texture by encouraging controlled exfoliation. Biocontrol in agriculture, while still nascent, signals another end-use vector. These trends widen the tartaric acid market opportunity set beyond its historical food anchor.
Note: Segment shares of all individual segments available upon report purchase
Asia-Pacific stands at the forefront of the tartaric acid market with 46.10% share in 2025 and a 5.62% CAGR outlook to 2031. China’s integrated petrochemical complexes supply competitively priced maleic anhydride, allowing synthetics to undercut European offers by 15–20%. Pharmaceutical production in India and Southeast Asia further bulks demand for high-purity grades. Authorities in Japan, South Korea, and Singapore encourage low-carbon manufacturing, spurring trials in electrochemical synthesis that curb energy use.
Europe upholds a strong position anchored in natural extraction linked to its wine sector. Grape-processing hubs in Italy, Spain, and France enable continuous raw-material access and ensure compliance with the 99.5% purity threshold. EU authentication rules using isotope analysis strengthen domestic suppliers against synthetic imports. Downstream food and beverage brands within Germany and the Nordics value organically certified inputs, bolstering intra-regional flows.
North America forms a mature yet steady slice of the tartaric acid market. The United States drives consumption through generic drug production and clean-label formulations, while Canada emphasizes natural ingredients in ready meals. Mexico’s expanding confectionery and beverage exports add incremental demand. USDA organic standards, which mandate plant-derived acids, direct buyers toward grape-waste processors. Regional research fosters innovations such as bee-mite biocontrol, hinting at fresh avenues for volume diversification.
Market Concentration
Competition in the tartaric acid market is consolidated and regionally tiered. European firms dominate natural grades through entrenched wine-industry synergies, whereas Asian producers excel in cost-focused synthetic output. Vertical integration intensifies as Alvinesa’s 2024 acquisitions in Chile and Argentina unlocked hemispheric supply balancing and lifted targeted revenue above EUR 150 million. Synthetic manufacturers deploy bipolar membrane electrodialysis to cut unit energy and reduce emissions, an edge in contracts that incorporate greenhouse-gas metrics.
Pharmaceutical differentiation pivots on patent portfolios. Firms are filing intellectual property around tartaric-based antimicrobials and anti-inflammatory agents, aiming to open prescription-drug royalties beyond commodity acid sales. Agricultural white space attracts innovators developing mite control products that exploit the compound’s 75.8% efficacy, giving early licensees a defensible niche in organic apiculture solutions. Market entry barriers remain moderate because raw materials are widely accessible; however, purity thresholds, isotope audits, and organics certifications raise the bar for newcomers.
Growing price pressure from citric and malic acids keeps margins modest, so strategic alliances around waste valorization and green processing have become decisive. Participants that secure year-round feedstocks and lower utility inputs position themselves best for long-run profitability within the tartaric acid market.

*Disclaimer: Major Players sorted in no particular order
1. Introduction
2. Research Methodology
3. Executive Summary
4. Market Landscape
5. Market Size and Growth Forecasts (Volume)
6. Competitive Landscape
7. Market Opportunities and Future Outlook
Tartaric acid is a strong dicarboxylic acid of plant origin. It is a white, crystalline organic acid that occurs naturally in fruits such as grapes, tamarinds, citrus, etc. The tartaric acid market is segmented by type, application, and end-user industries. The market is segmented by type into natural and synthetic tartaric acid. By application, the market is segmented into preservative and additive, laxative, intermediate, and other applications. By end-user industry, the market is segmented into food and beverage, pharmaceutical, cosmetics, construction, and other end-user industries. The report also covers the market size and forecasts for the Tartaric Acid market in 16 countries across major regions. The market sizing and forecasts for each segment are based on volume (kilo tons).
Strategic Expansion of Floor Coatings in the MEIA Region
4 Min Read
Unlocking Supplier Partnerships in the Africa Lubricants Market
5 Min Read
Deep-Dive Analysis of Feed Probiotics Across Key Regions
5 Min Read
When decisions matter, industry leaders turn to our analysts. Let’s talk.