
Market Overview
| Study Period | 2020 - 2031 |
|---|---|
| Forecast Data Period | 2026 - 2031 |
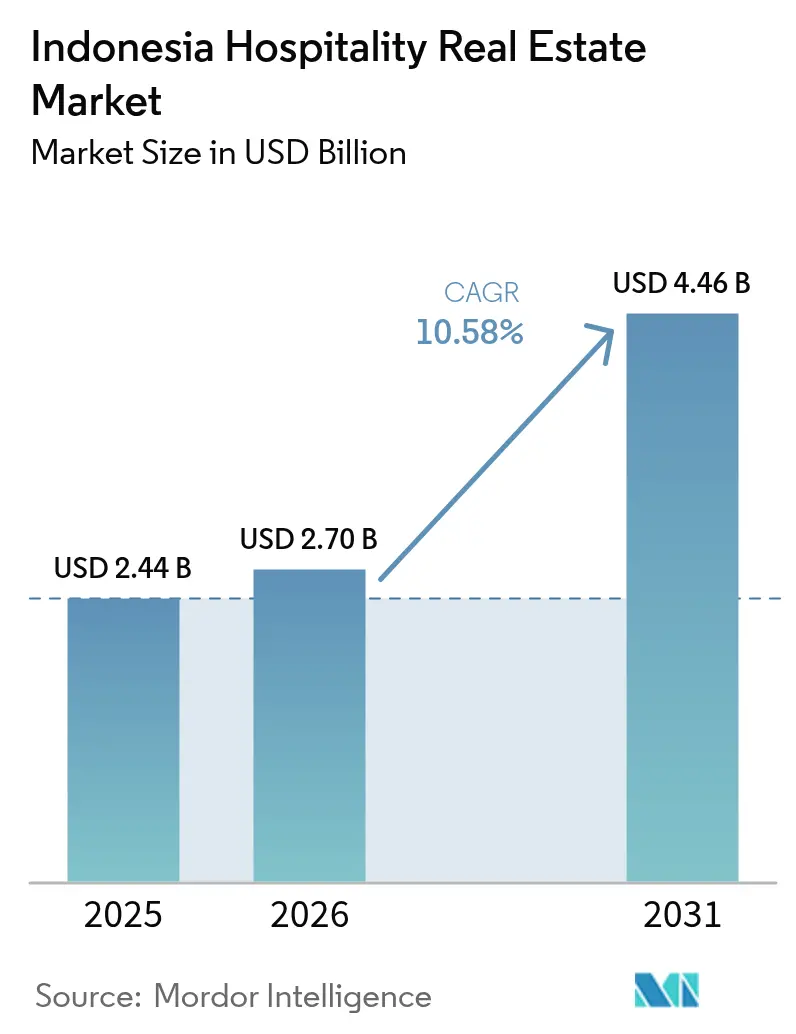
| Base Year Market Size (2025) | USD 2.44 Billion |
| Market Size (2026) | USD 2.7 Billion |
| Market Size (2031) | USD 4.46 Billion |
| Growth Rate (2026 - 2031) | 10.58 % |
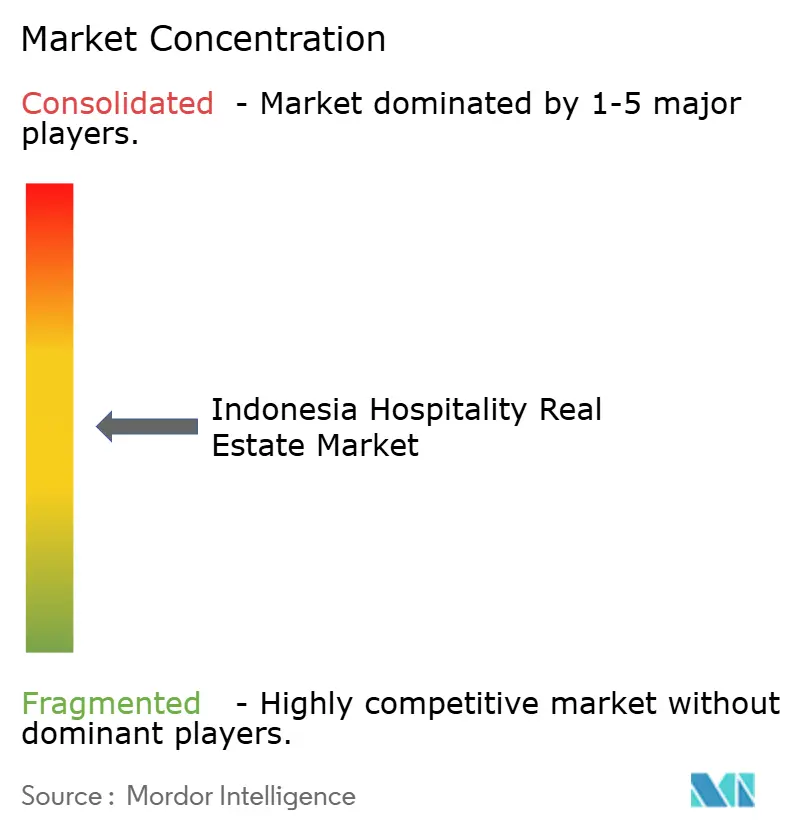
| Market Concentration | Medium |
Major Players *Disclaimer: Major Players sorted in no particular order Image © Mordor Intelligence. Reuse requires attribution under CC BY 4.0. | |
Indonesia Hospitality Real Estate Market Analysis by Mordor Intelligence
The Indonesia Hospitality Real Estate Market size is expected to grow from USD 2.44 billion in 2025 to USD 2.7 billion in 2026 and is forecast to reach USD 4.46 billion by 2031 at 10.58% CAGR over 2026-2031. Government infrastructure spending of USD 25.5 billion in 2025, combined with the ongoing Nusantara Capital City program, anchors the sector’s long-run demand. Tourism’s USD 72.5 billion contribution to 2024 GDP demonstrates strong post-pandemic resilience. New air routes, tax-friendly Special Economic Zones, and visa-on-arrival expansions further stimulate pipeline activity, while cautious monetary conditions and complex land rules temper foreign investor appetite. Institutional capital continues to favor branded assets, yet locally owned independents retain pricing agility across secondary cities.
Key Report Takeaways
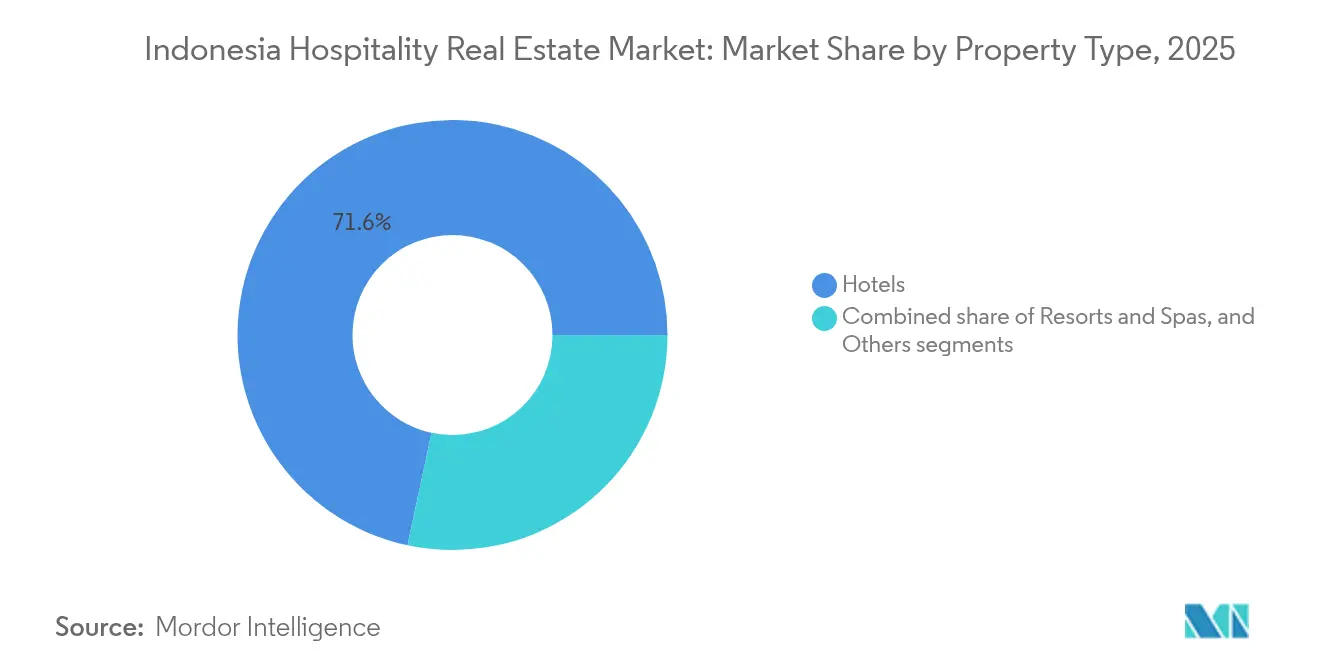
- By property type, hotels led with 71.64% revenue share of the Indonesia hospitality real estate market in 2025; resorts and spas are advancing at an 10.92% CAGR to 2031.
- By type, independent hotels held 62.85% of the Indonesia hospitality real estate market share in 2025, while chain hotels are projected to expand at an 11.14% CAGR through 2031.
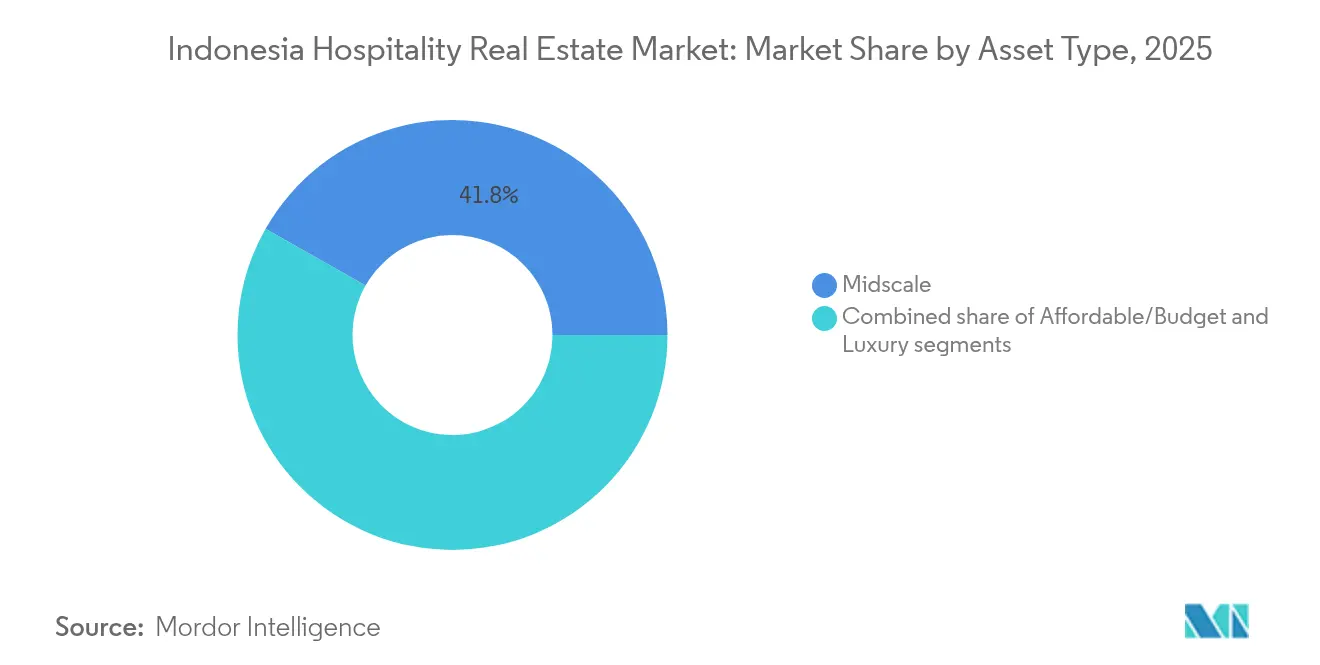
- By asset class, midscale properties accounted for a 41.78% share of the Indonesia hospitality real estate market size in 2025, whereas luxury developments are forecast to grow at an 11.46% CAGR to 2031.
- By geography, Jakarta captured a 27.14% share in 2025, and the Rest of Indonesia category is set to log the fastest 11.74% CAGR through 2031.
Note: Market size and forecast figures in this report are generated using Mordor Intelligence’s proprietary estimation framework, updated with the latest available data and insights as of 2026.
Indonesia Hospitality Real Estate Market Trends and Insights
Drivers Impact Analysis*
| Drivers | (~) % Impact on CAGR Forecast | Geographic Relevance | Impact Timeline |
|---|---|---|---|
| Government-backed destination development programs unlocking new hotel corridors | +3.1% | National, with priority focus on super-priority destinations and IKN | Long term (≥ 4 years) |
| Visa liberalization and streamlined arrivals procedures increasing international visitation | +2.4% | Gateway cities, major tourist destinations with international airports | Short term (≤ 2 years) |
| Large-scale public works creating sustained business/MICE room nights | +2.2% | IKN Nusantara, Jakarta, major industrial zones and government centers | Medium term (2-4 years) |
| Air connectivity upgrades improving access and RevPAR potential | +1.8% | Hub airports, secondary destinations with new route development | Medium term (2-4 years) |
| Investment incentives accelerating hospitality project viability | +1.2% | Special Economic Zones, designated tourism areas, priority regions | Short term (≤ 2 years) |
| Source: Mordor Intelligence | |||
Government-Backed Destination Development Programs Unlocking New Hotel Corridors
Dedicated federal spending is opening new demand corridors beyond Bali and Jakarta. The USD 3.7 billion private hospitality commitments tied to Nusantara Capital City underscore investor confidence in the government’s long-horizon strategy. Super-priority sites spanning Lake Toba to Labuan Bajo receive direct budget allocations, creating predictable construction timelines and de-risked feasibility models. North Sulawesi’s USD 50.0 million influx into hotels and restaurants illustrates capital migration toward lesser-known islands. State guarantees under the National Strategic Projects framework streamline licensing, compress financing costs, and differentiate Indonesia from neighboring tourism markets that rely on ad-hoc growth[1]Bambang Susantono, “Nusantara Capital City Investor Guide 2025,” IKN Authority, ikn.go.id.
Visa Liberalization and Streamlined Arrivals Procedures Increasing International Visitation
Simplified entry rules produced 4.09 million foreign arrivals in the first four months of 2024, a 24.85% jump year-over-year. Malaysia, Australia, and China collectively represent 36% of total visitors, reducing single-market vulnerability. Occupancy of star-rated hotels reached 47.14% in April 2024, up 5.77 percentage points from 2023. Traffic spikes at Ngurah Rai and Soekarno Hatta airports confirm the immediate linkage between policy change and RevPAR gains. Streamlined screening minimizes arrival friction and positions the Indonesia hospitality real estate market for share gains against regional competitors still operating tight border controls[2]Ida Bagus Kade Subagia, “International Visitor Arrivals April 2024,” BPS-Statistics Indonesia, bps.go.id.
Large-Scale Public Works Creating Sustained Business/MICE Room Nights
Road, rail, and port upgrades underpin steady corporate travel flows. The relocation program for Nusantara Capital City guarantees a decade-long stream of contractors, officials, and consultants requiring extended-stay inventory. Jakarta properties initially absorbed a 10–20% dip in government bookings but quickly diversified into commercial events and transient business. Special Economic Zones, many attached to industrial estates, stimulate meetings demand that stabilizes occupancy during tourism shoulder months. The predictable MICE base helps hotel developers lock in debt at fixed rates, improving underwriting for new assets.
Air Connectivity Upgrades Improving Access and RevPAR Potential
Aviation expansion directly influences hotel metrics: Jakarta RevPAR rose 17.8% and Bali climbed 21.5% through August 2024 amid seat growth and LCC penetration. Major capex, such as the USD 3 billion Bali airport enhancement, enhances premium room pricing power by funneling higher-spend travelers into the island. Secondary hubs from Lombok to Makassar obtain first-time international links, creating first-mover advantages for early hotel projects. The correlation between flight frequency and pipeline velocity remains strongest in destinations previously hindered by limited lift capacity.
Restraints Impact Analysis*
| Restraints | (~) % Impact on CAGR Forecast | Geographic Relevance | Impact Timeline |
|---|---|---|---|
| Land/title structuring and foreign-ownership limits complicating acquisitions and timelines | -2.3% | National, acute in high-demand areas like Bali and Jakarta | Long term (≥ 4 years) |
| Regulatory unpredictability raising development risk | -1.9% | Variable by region, higher impact in tourism-dependent areas | Medium term (2-4 years) |
| Currency volatility and elevated financing costs lifting capex and return hurdles | -1.5% | National, with higher impact on foreign-funded projects | Short term (≤ 2 years) |
| Source: Mordor Intelligence | |||
Land/Title Structuring and Foreign-Ownership Limits Complicating Acquisitions and Timelines
Equity structures must navigate the Building Use Rights framework that restricts outright foreign ownership to 85% in designated zones. Tenure uncertainty complicates 25-year management contracts typical for global flags. Protracted multilevel approvals can stretch land closing by up to two years, inflating interest carry and eroding IRRs. The Mandalika case, fraught with disputes, illustrated how unresolved titles derail marquee resort schemes despite federal support. Savvy sponsors now allocate greater contingency for land due diligence to keep the Indonesia hospitality real estate market timetable credible.
Regulatory Unpredictability Raising Development Risk
Regional autonomy means sudden moratoriums, zoning shifts, or density caps that disrupt pro-forma assumptions. New franchise rules introduced in 2024 demand a minimum three-year operating record and two-year profitability proof, tilting the playing field toward incumbents. Enforcement crackdowns on unlicensed villas in Bali elevate compliance costs but also remove unfairly priced competitors. Inconsistent environmental reviews push design revisions that add capex yet may preserve community goodwill when handled early[3]Prijandaru Effendi, “Government Regulation No. 35 of 2024 on Franchising,” Ministry of Law and Human Rights, kemenkumham.go.id.
*Our forecasts treat driver/restraint impacts as directional, not additive. The impact forecasts reflect baseline growth, mix effects, and variable interactions.
Segment Analysis
By Property Type: Hotels Retain Core Dominance, Resorts Propel Growth
Hotels controlled 71.64% of the Indonesia hospitality real estate market size in 2025, supported by corporate contracts, government allotments, and stopover traffic in Jakarta and Surabaya. Full-service formats maintain baseline occupancy even during leisure slumps, shielding cash flows amid demand cycles. Resorts and spas, though holding a smaller base, deliver the fastest 10.92% CAGR as wellness and experiential travel accelerate. The segment benefits from upgraded island airports and the SEZ toolkit that offsets heavy upfront infrastructure spend. Developers leverage master-planned tourism zones to cluster resorts with retail and attractions, enhancing the average length of stay. Pipeline data indicates seven new five-star resorts scheduled in Bali by 2027, while North Sulawesi and Flores record their first international flag announcements. Rising domestic affluence sustains weekday resort occupancy, a notable shift from pre-2024 patterns dominated by weekend peaks. Regulatory clarity favoring eco-sensitive designs supports investor sentiment for resort assets positioned away from congested beaches.
The hotel sub-sector continues to attract institutional capital targeting stabilized yield, especially in transit-oriented developments near rail and toll-road junctions. Brands prioritize flexible room mixes that combine traditional keys with serviced-suite wings to capture extended-stay demand. Resorts, meanwhile, deploy asset-light management agreements allowing owner participation in F&B, spa, and activity revenues. Both categories underscore the Indonesia hospitality real estate market as a dual-track opportunity: steady urban income plays versus higher-beta leisure plays with stronger ADR upside.



By Type: Independents Lead Volumes, Chains Accelerate Professionalization
Independent operators accounted for 62.85% of the Indonesia hospitality real estate market share in 2025, reflecting local entrepreneurs’ ability to align product with nuanced consumer preferences and municipal regulations. Their lean cost base enables competitive pricing and quicker refurb cycles. Chain hotels, although smaller in number, grow at an 11.14% CAGR, propelled by loyalty ecosystems and bankable brand standards attractive to lenders. The Marriott–Pakuwon agreement for five new hotels totaling 1,300 rooms exemplifies symbiotic tie-ups where local developers gain global demand engines, while chains secure a pipeline without greenfield land risk. New franchising criteria introduced in 2024 could concentrate growth among experienced chains able to certify profitability. Independents counteract by embracing digital distribution and hyper-local design that resonates with Gen-Z domestic travelers. Conversion of unbranded properties into soft-brand collections emerges as a low-capex entry for chains seeking fast market penetration, further professionalizing operations across secondary cities.
Hybrid ownership structures now blend strata-titled condo-hotels with traditional leases, unlocking retail investor pools yet maintaining unified brand control. As the Indonesia hospitality real estate market evolves, independents are expected to maintain leadership in under-indexed towns, while chains dominate tier-1 and high-profile resort destinations where institutional capital demands standardized governance.
By Asset Class: Midscale Anchors Demand, Luxury Outperforms on Yield
Midscale assets held 41.78% of the Indonesia hospitality real estate market size in 2025 due to cost-conscious business travel and family holiday patterns. Their balanced positioning between affordability and service quality sustains a solid 65–70% occupancy across economic cycles. Limited F&B and standardized room prototypes facilitate efficient staffing models that cushion margin compression when ADR softens. Luxury properties, however, record an 11.46% CAGR, buoyed by rising disposable incomes and Indonesia’s pivot to higher-spend tourism. PT Jakarta Setiabudi Internasional booked USD 115.4 million in hotel revenue during 2024, illustrating the luxury’s earnings potency. Premium resorts tap integrated wellness, culinary, and cultural programming to lift ancillary spend, while smart-building tech lowers operating intensity per square foot. Budget stock faces price undercutting from informal rentals, prompting regulators to intensify enforcement, thereby indirectly supporting branded economy chains.
Midscale projects remain favored by domestic banks offering construction loans with shorter tenors, whereas luxury developments increasingly rely on offshore joint ventures and mezzanine slices. Asset managers optimize mixed-use footprints that pair luxury towers with midscale annexes, spreading risk yet preserving top-tier positioning on flagship frontage. This blend aligns with travel demand stratification and elevates the Indonesia hospitality real estate market as a diversified investment landscape.
Geography Analysis
Jakarta produced 27.14% of the total transaction value in 2025, underpinned by corporate travel, MICE events, and the capital’s status as the key air gateway. Soekarno Hatta recorded a 38.31% rise in international traffic during early 2024, immediately boosting citywide RevPAR. Institutional plays persist, typified by Astra Group’s USD 85 million acquisition of the Mandarin Oriental Jakarta stake. However, gradual government relocation to Nusantara tempers future official travel budgets, prompting hoteliers to cultivate commercial accounts and domestic leisure short breaks. Developers redeploy equity into transit-linked sub-markets such as BSD City, where integrated township plans promise stable weekday demand.
West and East Java clusters offer lower land cost and lighter red tape relative to Jakarta, prompting chain expansion in Surabaya, Bandung, and emerging industrial towns. Strong manufacturing FDI spurs weekday corporate stays, while weekend domestic tourism fills rooms. New four-star projects in Situbondo and Pekalongan illustrate confidence in secondary corridors, supported by toll-road upgrades shortening travel times. Central Java secures pipeline commitments from Swiss-Belhotel and Amaris, signaling brand conviction that secondary cities can sustain standardized service models.
The Rest of Indonesia group registers the highest 11.74% CAGR through 2031, reflecting super-priority destination funding and improved inter-island air links. Bali remains the flagship, with seven five-star openings announced for 2027 and the USD 6.7 billion Kura Kura SEZ steering high-end supply. Eagle Hills’ USD 3.1 billion commitment around Soekarno Hatta Airport shows foreign capital’s readiness to bankroll infrastructure-adjacent hospitality ecosystems. North Sulawesi’s USD 50.0 million hotel inflow and Kalimantan’s brand signings tied to Nusantara broaden spatial diversification. Enhanced digital connectivity permits remote resorts to access online distribution, lowering customer-acquisition costs and spreading the Indonesia hospitality real estate market footprint across 17,000 islands.
Regulatory Landscape
Indonesia hospitality real estate development and operations increasingly sit under the risk-based licensing regime administered through the Online Single Submission (OSS) Risk-Based Approach. Government Regulation No. 28 of 2025 reinforces that building prerequisites, notably PBG and SLF, must be verified in OSS before a tourism business license can be processed, pushing developers to align zoning (KKPR), building compliance, and business registration earlier in the project cycle.
Sector supervision tightened further under Ministry of Tourism Regulation No. 6 of 2025, which sets tourism business standards, monitoring mechanisms, and administrative sanctions. The regulation emphasizes license integrity and correct business classification (KBLI) for accommodation. In May 2026, the Ministry of Tourism announced development of an API-based verification system intended to integrate with OTAs to validate license elements such as NIB, KBLI, and related registrations for listed accommodations, pointing to more automated enforcement across digital distribution channels.
Value Chain Analysis
The value chain for Indonesia hospitality real estate runs from land assembly and permitting (KKPR, PBG/SLF and OSS processing) through development advisory and design, construction and procurement, fit-out and commissioning, and then operations, distribution, and asset management. Developers typically coordinate multi-disciplinary advisory inputs, including feasibility, architect and operator advisory, legal and finance and modeling, and a construction manager, to align brand back-of-house standards with local buildability constraints. Financing and underwriting increasingly incorporate permitting completeness and compliance readiness.
Construction and operations are shaped by Indonesia's archipelagic logistics, where high transport friction encourages localization of materials and supplier networks around priority corridors and SEZ destinations. Recent project evidence includes Kalla Beton supplying instant mortar and lightweight bricks to a hotel project in Morowali (May 2026), underscoring how domestic building-material suppliers affect schedule risk. On the demand-enablement side, destination infrastructure and access nodes, for example Mandalika's growing tourism investment base and the Bakauheni Harbour City cruise-transit initiative announced by PT ASDP Indonesia Ferry and Lampung Province in July 2026, influence where developers prioritize sites, pre-leasing, and operator selection.
Competitive Landscape
Ownership fragmentation keeps competition moderate, encouraging both consolidation and niche specialization. Domestic players leverage local permitting expertise and relationship banking, while global operators contribute distribution heft and standardization. PT Jakarta Setiabudi Internasional’s 2024 hotel revenue concentration of 77% within total group earnings underlines the segment’s profitability for conglomerates that balance property and hospitality arms. State plans to consolidate 103 SOE-owned hotels into a dedicated holding, aim to rationalize operations and enhance scale economics.
Technology adoption proves decisive: operators deploying cloud PMS and AI-driven pricing report up to 30% cost efficiency improvements, freeing capital for refurbishments. OTA penetration democratizes market visibility, but commissions compress net ADR for independents lacking direct-booking infrastructure. Regulatory tightening on illegal accommodations, chiefly in Bali, may favor compliant operators by removing predatory price competition. Partnerships such as Marriott–Pakuwon illustrate the prevalent growth template: local land control plus international brand equity.
Future competition will revolve around ESG alignment and halal-certified offerings, segments where early movers can secure premium rate positioning. The Indonesia hospitality real estate market thus offers a balanced field: incumbents hold local leverage, yet foreign entrants wield brand and capital, producing a dynamic yet orderly competitive setting.
Indonesia Hospitality Real Estate Industry Leaders
Sinar Mas Land
Agung Podomoro Land
Ciputra Group
Duta Anggada Group
Lippo Karawaci
- *Disclaimer: Major Players sorted in no particular order

Market Opportunities and Future Outlook
There is a visible opportunity around compliant, professionally managed accommodation that can be distributed through OTAs without regulatory friction. The Ministry of Tourism's May 2026 initiative to build an API-based license verification link with OTAs, with a compliance roadmap extending to June 2027, raises the relative advantage of assets that secure correct KBLI classification, complete OSS documentation, and building approvals. It also creates conversion pathways for informal or misclassified inventory into licensed, bankable products.
Geographically, investment vehicles and mixed-use anchors are expanding the addressable pipeline beyond traditional cores through tourism SEZs and integrated urban nodes. Evidence includes reported cumulative investment of IDR 45 trillion in tourism SEZs as of Q1 2026, along with brand-led expansion into secondary cities such as Hyatt's June 2026 management agreement for the 154-room Hyatt Place Semarang integrated with BINUS education facilities and a shopping mall. Large-format resort land plays also continue to attract capital, illustrated by Westgrove-backed Samara Lombok (150 hectares, with multiple boutique hotels and villas), supporting opportunities across resort master-plans, branded residential hospitality, and phased development tied to infrastructure and permitting milestones.
Recent Industry Developments
- July 2026: Orange Sky Indonesia signed an MoU with PT Cipta Vista Persada to develop a 3-star OS Style Airport Batam near Hang Nadim International Airport. The project adds pipeline in an airport-driven submarket and reflects the continued shift of new supply toward transit and secondary-city demand pools beyond Jakarta and Bali.
- June 2026: Hyatt Hotels Corporation announced a management agreement for Hyatt Place Semarang, a 154-room hotel planned within an integrated ecosystem that includes BINUS education facilities and a shopping mall. The asset-light agreement highlights how international brands are using mixed-use nodes to broaden weekday demand sources and improve underwriting for new developments in Central Java.
- July 2024: Eagle Hills signed a USD 3.1 billion memorandum covering hotel assets and tourism infrastructure near Soekarno Hatta International Airport. The commitment reinforced investor appetite for infrastructure-adjacent hospitality ecosystems tied to Indonesia's main air gateway and supported land and mixed-use positioning around the airport corridor.


Research Methodology Framework and Report Scope
Market Definition and Coverage
This market covers the value of hospitality-focused real estate in Indonesia, where the asset is primarily used to host short-stay guests and is monetized through room-led accommodation services (including supporting guest facilities that are part of the property).
Scope exclusions: We exclude pure residential real estate, long-lease apartments not operated for short stays, and land banking that is not yet tied to a running hospitality asset.
Segmentation Overview
- By Property Type
- Hotels
- Resorts & Spas
- Others (Serviced Apartments, boutique inns, etc)
- By Type
- Chain Hotels
- Independent Hotels
- By Asset Class
- Affordable/Budget
- Midscale
- Luxury
- By Region
- DKI Jakarta
- West Java (Jawa Barat)
- East Java (Jawa Timur)
- Rest of Indonesia
Data Sources, Market Sizing, and Validation
Desk Research
Desk research was used to set the demand and supply context for Indonesia and to anchor assumptions that can be checked against public signals. We mainly pulled time series for Indonesia travel demand, hotel operating metrics, and construction activity, and we only retained datasets that were consistently updated and easy to reconcile across years.
For public and official references, we relied on sources such as Statistics Indonesia (BPS) for tourism and macro indicators, Bank Indonesia for inflation and exchange-rate context, the Ministry of Tourism and Creative Economy for visitor and program updates, and investment releases from BKPM where relevant. We also reviewed airport and port authority publications for traffic direction, plus credible press, company filings, and investor presentations to understand announced openings, renovations, and positioning shifts. Where company financials and patent-intelligence subscriptions were available, they were used to speed up cross-checks on operator footprints and renovation activity. This list is not exhaustive, and other public sources were used for data collection, validation, and clarifying gaps.
Primary Interviews and Surveys
Primary work was done through expert interviews and short surveys with property owners, developers, hotel operators, brokers, lenders, and advisors who track deals and performance. Respondent input was used to confirm the direction of occupancy and ADR, how cap rates and required returns are shifting, and which Indonesia regions are moving from planning to openings.
Distribution of primary research fieldwork respondents
| Company type | Respondent position |
|---|---|
| Top tier: 35% | CXOs: 16% |
| Mid tier: 45% | Functional/Unit leaders: 31% |
| Smaller Players: 20% | Managers: 53% |
Market-Sizing & Forecasting
Sizing starts from a top-down build that reconstructs the value pool from Indonesia hospitality operating reality, and then converts that into real estate value using sector-typical pricing and yield logic. In practice, we link demand indicators to monetization metrics (such as occupancy and ADR), then apply capitalization and development cost checks so the implied market value stays consistent with what the asset class can support.
A selective bottom-up layer is used to keep totals grounded, especially where local disclosure is uneven. We sample key hospitality corridors and asset types, roll up approximate room inventory additions, and apply observed ADR bands and stabilization timelines. If the implied results drift away from known supply pipelines, we adjust the totals and document the driver.
For forecasting, scenario analysis is used, supported by simple time-series smoothing on tourism and hotel KPI baselines. Scenario weights are refined using what interviewees expect on supply delivery timing and rate recovery. Where gaps exist in bottom-up checks (for example, projects without clear room counts or delayed openings), conservative assumptions are applied first, and then they are revisited once corroborating signals appear from multiple sources.
Data Validation & Update Cycle
Validation is handled through triangulation across independent signals, so no single dataset decides the final number by itself. Model outputs are checked against travel-demand direction, hotel KPI consistency, and the plausibility of implied real estate values under reasonable yields, and then outliers are reviewed before sign-off.
Anomalies trigger a second pass where assumptions are stress-tested, and respondents may be re-contacted when a variance is driven by a specific region, asset class, or unusual price shift. Reports are refreshed annually, and interim updates are made when a material event changes demand, financing, or supply timing. Before delivery, a final analyst pass is completed so clients receive the latest updated view.
Mordor Intelligence's Indonesia Hospitality Real Estate Sector Market Size Compared With Other Published Estimates
Published market sizes for Indonesia hospitality real estate can vary even when they appear to cover the same scope. The differences usually come from how each study handles currency conversion timing, how ADR and occupancy assumptions flow into pricing, and whether pipeline projects are counted before they stabilize.
A refresh-led gap is common in this market because hotel KPIs in Indonesia can move quickly with travel shocks and rate resets, and exchange-rate changes can swing the USD view within the same year. When model inputs are updated more frequently and validated against current ADR and occupancy checks, the implied asset values tend to shift, which is where Mordor Intelligence separates operating assets from softer pipeline estimates more clearly.
Benchmark comparison
| Source | Market Size | Gaps in Research Methodology |
|---|---|---|
| Mordor Intelligence | USD 2.44 B (2025) | |
| Industry Publisher A | USD 2.02 B (2025) | Uses a broader narrative definition of hospitality property and may apply more conservative ADR and occupancy recovery assumptions, which can compress implied values in the same base year. |
| Research Portal B | USD 1.84 B (2025) | Appears to anchor the base-year value using higher discounting and a less explicit treatment of stabilization and opening delays, which can undercount assets that are already operating or near-stabilized. |
Across the three figures, the spread is mainly explained by how quickly assumptions are refreshed and how operating performance is translated into USD asset value. By tying the inputs to observable hotel KPIs and keeping the conversion timing and pipeline treatment explicit, the final number stays easier to trace and repeat.


Key Questions Answered in the Report
What is the 2026 revenue projection for Indonesia’s hospitality property segment?
The Indonesia hospitality real estate market size is valued at USD 2.7 billion in 2026.
How quickly is hospitality real estate expanding across Indonesia?
The sector is forecast to grow at a 10.58% CAGR, reaching USD 4.46 billion by 2031.
Which property type currently dominates Indonesia’s hotel space?
Hotels account for 71.64% of revenue, driven by business travel and urban demand.
Why are chain hotels gaining ground despite independents’ leadership?
Chains deliver brand recognition and financing advantages, enabling an 11.14% CAGR to 2031.
Page last updated on:


 Your data is secure and never sold or shared.


