
High Performance Tires Market Size and Share
Market Overview
| Study Period | 2020 - 2031 |
|---|---|
| Market Size (2026) | USD 59.82 Billion |
| Market Size (2031) | USD 89.57 Billion |
| Growth Rate (2026 - 2031) | 8.43 % |
| Fastest Growing Market | Europe |
| Largest Market | Europe |
| Market Concentration | Medium |
Major Players *Disclaimer: Major Players sorted in no particular order Image © Mordor Intelligence. Reuse requires attribution under CC BY 4.0. | |
High Performance Tires Market Analysis by Mordor Intelligence
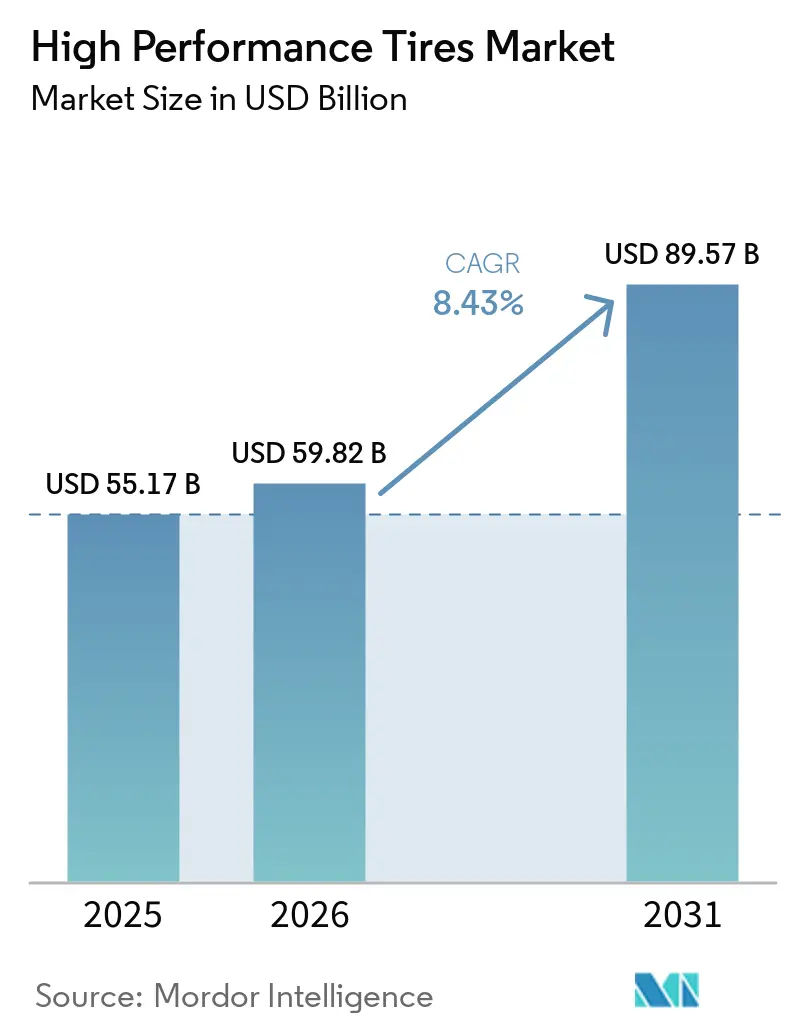
The high-performance tire market size is expected to grow from USD 55.17 billion in 2025 to USD 59.82 billion in 2026 and is forecast to reach USD 89.57 billion by 2031 at 8.43% CAGR over 2026-2031. Electrification is reshaping carcass architecture, while silica-rich compounds balance rolling resistance with grip, keeping premium demand resilient. Large-diameter wheels on luxury SUVs anchor ultra-high-performance (UHP) fitments, and Euro 7 particulate caps are accelerating low-wear tread programs. Motorsport technology is quickly migrating to street tires, sustaining brand pricing power, and AI-enabled smart-tire platforms are opening up subscription revenue streams. Incumbents that co-locate R&D, compounding, and testing are shortening product cycles to three to four years, outpacing regional challengers.
Key Report Takeaways
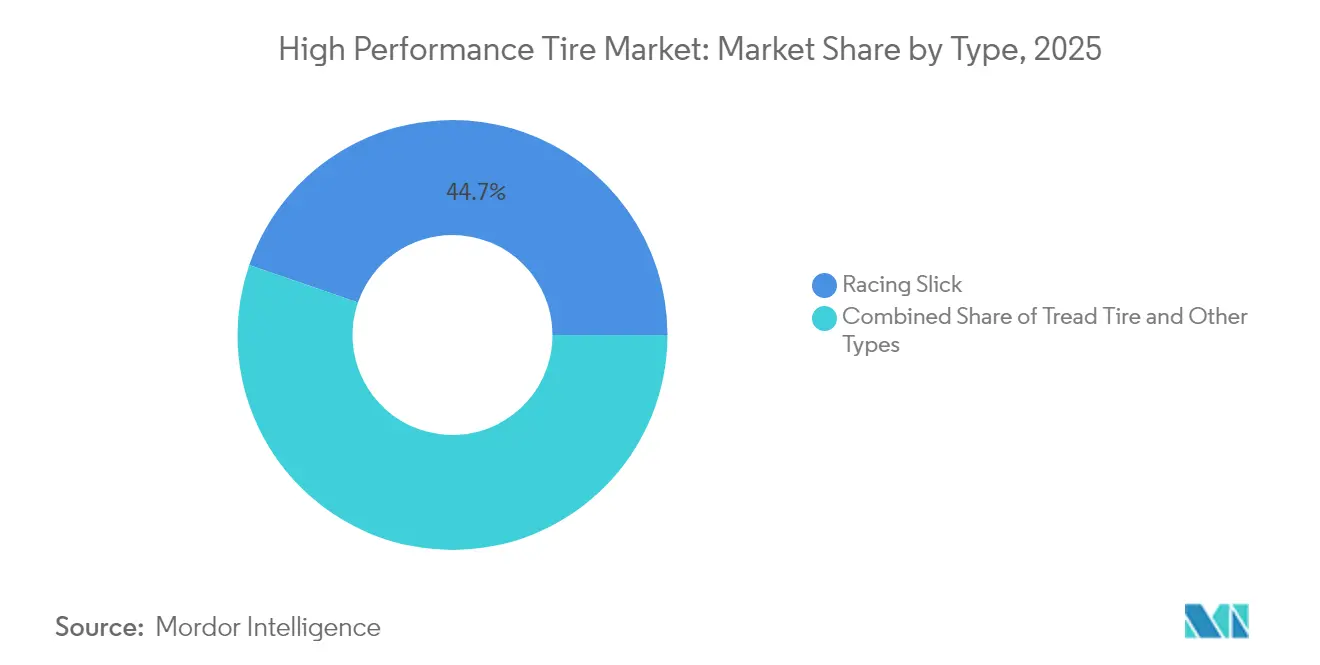
- By type, racing slicks captured 44.72% of the high-performance tire market share in 2025 and are also the fastest-rising category, advancing at an 8.49% CAGR through 2031.
- By sales channel, OEM fitment dominated with a 78.10% revenue share in 2025, while the aftermarket segment is forecasted to grow at an 8.55% CAGR through 2031.
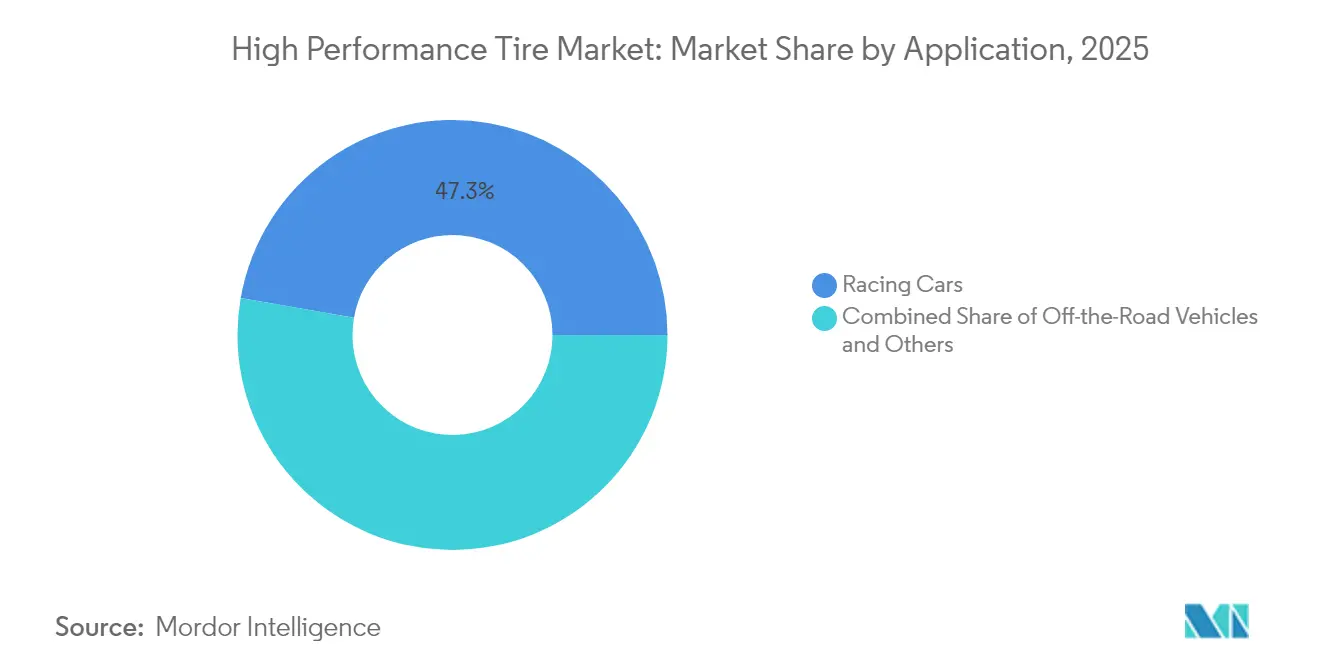
- By application, racing cars held 47.25% of the high-performance tire market size in 2025; off-the-road vehicles are on track for the quickest expansion at an 8.58% CAGR through 2031.
- By tire type, summer tires accounted for 67.05% of the 2025 volume, whereas winter tires are poised to register the highest 8.51% CAGR to 2031.
- By region, Europe led the high-performance tire market with a 38.35% share in 2025 and is projected to post an 8.52% CAGR through 2031, the fastest pace among the reported regions.
Note: Market size and forecast figures in this report are generated using Mordor Intelligence’s proprietary estimation framework, updated with the latest available data and insights as of 2026.
Global High Performance Tires Market Trends and Insights
Drivers Impact Analysis*
| Driver | (~) % Impact on CAGR Forecast | Geographic Relevance | Impact Timeline |
|---|---|---|---|
| Electrified-Vehicle Torque and Weight | +1.8% | Global, with concentration in Europe, China, North America | Medium term (2-4 years) |
| SUV / Luxury Rim-Size Upsizing | +1.5% | Europe, North America, Middle East premium segments | Short term (≤ 2 years) |
| CO2 / Rolling-Resistance | +1.4% | Europe (EU tire label), China (GB standards), North America (CAFE) | Long term (≥ 4 years) |
| Euro 7 Particulate Caps | +1.3% | Europe (primary), with regulatory diffusion to Japan, South Korea | Medium term (2-4 years) |
| Expanding Motorsport and Enthusiast Culture | +1.2% | Asia Pacific core, spill-over to Middle East and South America | Medium term (2-4 years) |
| AI-Enabled Smart-Tire Platforms | +1.0% | Global, led by Europe and North America fleet operators | Long term (≥ 4 years) |
| Source: Mordor Intelligence | |||


Electrified-Vehicle Torque & Weight Require Purpose-Built HP Tires
Battery-electric vehicles weigh 250-350 kg more than comparable internal-combustion models, which increases contact-patch loads and accelerates tread wear by up to two-fifths under hard acceleration [1]“Turanza EV Launch Press Kit,” Bridgestone, bridgestone.com. Bridgestone’s Turanza EV, launched in May 2024, combines aramid belts with high-silica rubber to dissipate heat, while Hankook’s iON evo SUV reinforces sidewalls for silent highway running. The Tire and Rim Association introduced the High Load (HL) symbol in 2024 to standardize EV-specific load indices. Continental’s EcoContact Next applies a dual-compound tread that maintains braking grip despite EV torque spikes. With global EV sales expected to exceed 20 million units in 2025, dedicated EV lines are earning margin premiums of one-fourth over conventional UHP tires.
SUV / Luxury Rim-Size Upsizing Drives OEM UHP Fitment
In recent years, a significant portion of new vehicles in the premium segment has been equipped with larger wheels, showcasing a notable increase compared to earlier periods. Porsche has opted for large tires on its Taycan Cross Turismo, while Mercedes-Benz is pushing the envelope with even bigger options on its EQS, solidifying the demand for low-profile UHP tires. While larger rims enhance responsiveness by reducing sidewall flex, they also heighten the risk of impact. In response, Pirelli has integrated noise-canceling foam layers into its P Zero Elect series. This trend finds strong backing in the Middle East, where luxury SUVs represent a considerable share of light-vehicle sales in the Gulf region.
CO₂ / Rolling-Resistance Mandates Accelerate Silica-Rich Compounds
The EU’s revised tire label, effective since May 2021, encourages lower fuel consumption and thus reduced CO₂ emissions by rating tires based on their rolling resistance. Still, it does not directly link these ratings to OEM fleet-wide CO₂ targets [2]“Revised EU Tire Label Directive,” European Commission, europa.eu. Evonik scaled up a major expansion of its precipitated silica production in Charleston, South Carolina, in 2024 [3]“ULTRASIL 7000 GR Expansion,” Evonik, evonik.com . Michelin’s e.Primacy, with one-third silica by weight, earned an AA grade and became the standard on Renault Megane E-Tech models. China harmonized its GB 29753 test with ISO 28580 in 2024, thereby accelerating the adoption of silica in the world’s largest automotive market. North America’s CAFE standard tightening to 49 mpg by 2026 is expected to further widen adoption.
Euro 7 Particulate Caps Spur Low-Wear Tread Designs
UNECE approved a 7 mg/km abrasion ceiling for passenger-car tires in February 2024, effective July 2028. Continental’s UltraContact NXT cuts particulate emissions by one-third through a renewable-content rubber blend. Goodyear is trialing embedded tread-wear telemetry, sending real-time abrasion data to fleets. Bridgestone and Versalis are co-developing SBR grades that maintain wet grip while shedding fewer microparticles.
Restraints Impact Analysis*
| Restraint | (~) % Impact on CAGR Forecast | Geographic Relevance | Impact Timeline |
|---|---|---|---|
| Price Premium Curbs Uptake | -0.9% | South America, Middle East and Africa, Southeast Asia | Short term (≤ 2 years) |
| Natural-Rubber & Petro-Polymer Volatility | -0.7% | Global, with acute impact in Asia Pacific manufacturing hubs | Medium term (2-4 years) |
| Euro 7 Abrasion Tests | -0.5% | Europe (primary), with secondary effects in export-oriented markets | Medium term (2-4 years) |
| Emerging Airless / 3-D-Printed Concepts | -0.4% | North America and Europe pilot markets | Long term (≥ 4 years) |
| Source: Mordor Intelligence | |||
Price Premium Curbs Uptake in Cost-Sensitive Regions
According to the World Bank, high-performance tires are significantly more expensive than mid-tier alternatives, making them less accessible in markets with lower per-capita income levels. In Brazil, rising inflation and high import tariffs on premium tires encourage consumers to opt for budget options. Meanwhile, counterfeit tires have captured a notable share of the market in both South Africa and Egypt. In Southeast Asia, a fragmented distribution landscape limits profit margins, as price-sensitive consumers prioritize durability over grip.
Natural-Rubber & Petro-Polymer Volatility Squeezes Margins
In early 2024, refinery shutdowns caused a significant increase in styrene-butadiene rubber prices, putting pressure on tire gross margins. At the same time, rising energy prices in China and Europe drove up carbon-black costs. Players like Bridgestone, with their Indonesian plantations, maintain a notable cost advantage over those purchasing at spot prices. While efforts are underway to develop guayule and dandelion-derived latex to reduce dependence on unstable feedstocks, commercial-scale production is still expected to take several years.
*Our forecasts treat driver/restraint impacts as directional, not additive. The impact forecasts reflect baseline growth, mix effects, and variable interactions.
Segment Analysis
By Type: Slicks Dominate Track and OEM Co-Development
Racing slicks held 44.72% of the high-performance tire market share in 2025 and are projected to advance at an 8.49% CAGR to 2031. While their contact-patch advantage significantly enhances cornering grip, the lack of wet-weather traction limits their use to circuits. Treaded UHP summer and all-season tires, featuring balanced grooves and silica-rich compounds, cater to daily driving needs. Continental’s UltraContact NXT, now standard on the Mercedes EQE, boasts a blend of predominantly renewable materials and low noise, securing its place in OEM fitments.
Pirelli is steering its latest F1 tires towards a greener future, using FSC-certified rubber and recycled carbon black, while slick compounds are increasingly incorporating bio-based inputs. Michelin’s Pilot Sport 5, with its hybrid-compound tread, delivers lap times comparable to semi-slicks, all while maintaining superior wet grip. Catering to armored and remote-area vehicles, run-flat and self-sealing variants prioritize puncture resilience over comfort. The high-performance tire market continues to favor specialized slick production, enjoying significantly higher gross margins than their treaded counterparts.


By Sales Channel: Aftermarket Gains as Enthusiasts Seek Track Compounds
The OEM channel accounted for 78.10% of 2025 revenue, driven by multi-year homologation contracts with automakers. Pirelli’s Cyber Tyre sensors on BMW’s iX show the depth of technical integration. Yet, the aftermarket is forecast to grow faster, at 8.55% through 2031, driven by the Asia Pacific's track-day culture and the Middle East's desert rallies. Semi-slick replacements are required much sooner than those for daily drivers, resulting in a significant increase in transaction values.
While OEM volumes achieve scale, they face consistent annual price pressure as automakers competitively bid contracts. In contrast, considerably higher aftermarket margins depend on strategic distributor partnerships and the transparency offered by e-commerce. Goodyear’s Eagle F1 Asymmetric 6 capitalizes on safety credentials to appeal to daily drivers, whereas BFGoodrich’s off-road lineup dominates the desert-rally segment. This duality in the high-performance tire market allows it to benefit from consistent OEM orders while catering to the lucrative enthusiast demand.
By Application: Off-Road Vehicles Surge on Rally and Extreme-Terrain Demand
Racing cars accounted for 47.25% of 2025 demand, but off-the-road vehicles, including rally and desert racers, are projected to post the fastest 8.58% CAGR to 2031. BFGoodrich supplied more than 400 entrants in the 2024 Dakar Rally with Kevlar-reinforced sidewalls that cut puncture retirements by nearly one-third. High-performance motorcycle and specialty light-truck niches add fragmented yet profitable pockets.
Technology transfer is rapid: Pirelli’s P Zero Trofeo R delivers the majority of track-slick grip for road-legal usage. Off-road tires must combine self-cleaning tread, stone ejectors, and temperature-flexible compounds to provide optimal performance. Toyo’s Open Country M/T, with a three-ply sidewall and stone-ejector ribs, targets North American overlanders seeking week-long backcountry reliability. The application mix illustrates divergent engineering priorities within the high-performance tire market.
By Tire Type: Summer Leads, Winter Gains on Nordic Innovation
Summer models retained 67.05% of 2025 volume given their year-round suitability in temperate climates and motorsport dominance. Winter tires are projected to grow at an 8.51% pace to 2031 as Nordic regulators enforce studless tire mandates and North American SUV owners outfit their vehicles with. Nokian’s Hakkapeliitta 11 stays pliable at -40 °C, while Bridgestone’s Blizzak LM005 uses a hydrophilic coating for superior ice grip.
Summer compounds feature high silica and minimal siping for peak dry performance, but they harden below 7 °C. Winter tread features micro-pores and deep sipes for enhanced ice edge performance, yet degrades quickly above 15 °C. All-season models, such as Michelin’s CrossClimate 2, compromise dry grip for year-round flexibility, which suits buyers with limited storage space. Seasonal spikes let producers balance factory utilization, supporting overall high-performance tire market growth.
Geography Analysis
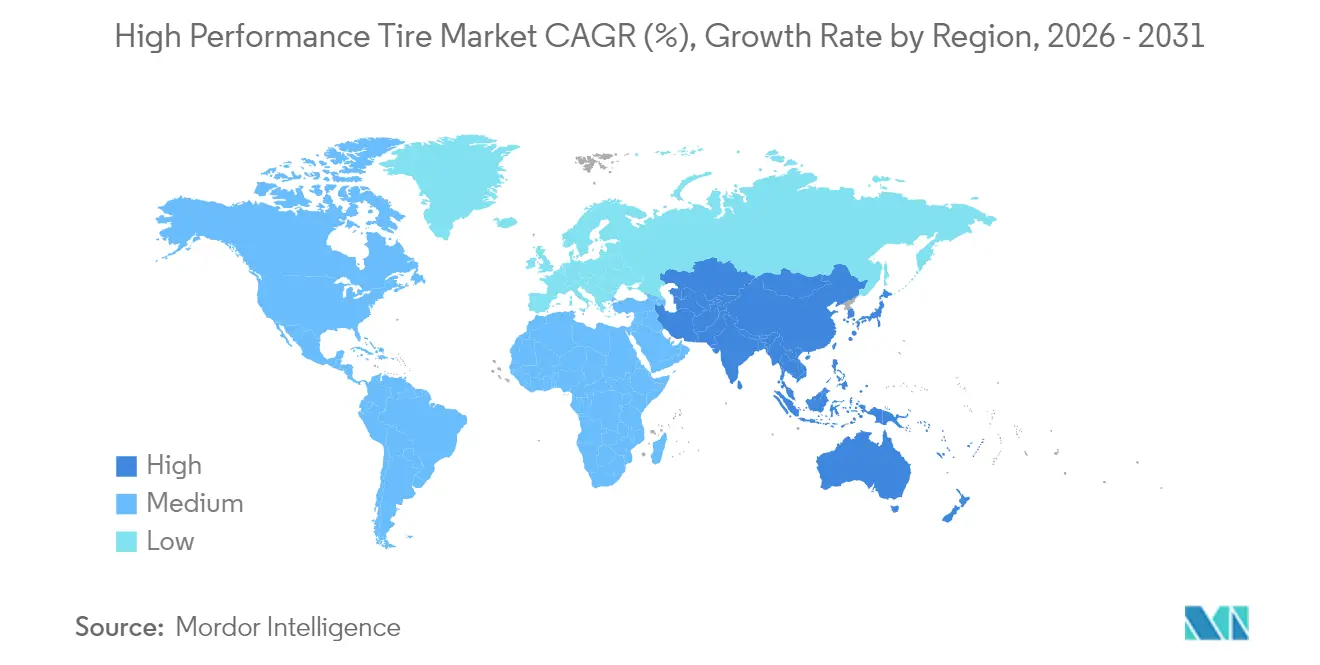
Europe controlled 38.35% of the high-performance tire market in 2025 and is projected to grow at an 8.52% CAGR through 2031. This growth is largely driven by the introduction of Euro 7 abrasion limits, which are accelerating innovations in low-wear technologies. German OEMs are increasingly focusing on tires with high rolling resistance ratings and integrated sensors, leading to the adoption of advanced products like Pirelli’s Cyber Tyre and Continental’s UltraContact NXT in their premium electric vehicles.
Asia Pacific, including countries such as China, Japan, South Korea, and those in Southeast Asia, is experiencing rapid growth in the adoption of ultra-high-performance (UHP) tires, fueled by increasing electrification and rising income levels. China's implementation of stricter standards is encouraging greater use of silica in tire production, helping domestic brands like Zhongce and Linglong enhance their performance offerings. Japan's Bridgestone and Yokohama are leveraging their expertise in winter tire technology for exports, while Hankook's exclusive supply to Formula E is strengthening its brand image. In India, Apollo and MRF are focusing on developing heat-resistant compounds suitable for tropical climates.

Regulatory Landscape
The high-performance tire market operates under an increasingly harmonized global compliance stack focused on safety, labeling, and performance requirements. Under the UNECE framework, UN Regulation No. 117 covers rolling resistance, wet grip, and external noise for new pneumatic tires (C1, C2, C3), with Supplement 2 to the 04 series of amendments entering into force in January 2025. The transition timetable allows Contracting Parties, until 6 July 2026, to accept type approvals issued to earlier 02/03 series (first issued before 7 July 2024), which affects homologation planning and test-lab capacity needs for premium and UHP lines.
In the United States, Federal Motor Vehicle Safety Standards continue to set baseline requirements by category, including FMVSS No. 119 for tires used on vehicles with GVWR above 4,536 kg (10,000 pounds). NHTSA rulemaking updates also shape vehicle labeling interfaces, including an April 2026 proposal to amend FMVSS No. 110 for ADS vehicle placard placement where a traditional driver-side may not exist. Trade policy remains a swing factor for supply, with the US Department of Commerce publishing final results in May 2026 from an expedited second sunset review of the antidumping duty order on passenger vehicle and light truck tires from China, maintaining a high-duty backdrop that affects sourcing decisions and pricing for imported performance fitments.
Value Chain Analysis
High-performance tires depend on a multi-stage chain that starts with upstream procurement of natural and synthetic rubber, carbon black, silica, steel cord, and specialty chemicals. This is followed by compounding and component preparation (mixing, calendaring/extrusion), tire building, curing, testing, and certification. Upstream risk is pronounced because natural rubber is a meaningful share of tire material inputs and is geographically concentrated. In India, industry reporting through the Automotive Tyre Manufacturers Association (ATMA) in January 2026 highlighted natural-rubber supply tightness versus projections, reinforcing the need for diversified sourcing, inventory buffers, and formulation flexibility in UHP and EV-rated compounds.
Midstream and downstream differentiation increasingly centers on OEM co-development, digital integration, and regionalized manufacturing and distribution. OEM channels dominate revenue in this market, and partnerships are deepening into joint development programs, including Hyundai Motor Group and Michelin signing a third MOU in November 2025 to co-develop next-generation tires (including high-performance and extreme-low rolling resistance products for EV applications). At the same time, circular-material initiatives are expanding supply beyond virgin feedstocks, illustrated by Bridgestone, Grupo BB&G, and Versalis commissioning a commercial-scale tire pyrolysis plant in Fatima, Portugal (announced September 2024). This supports tire-to-tire material loops that can stabilize access to recovered oils and polymers for premium compounding.
Competitive Landscape
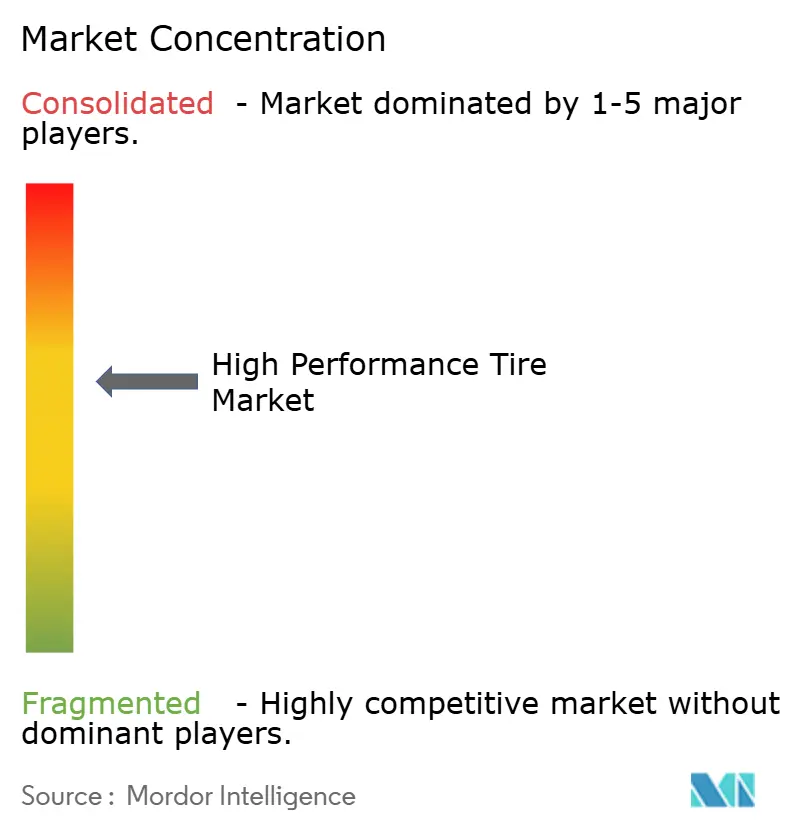
In 2024, the top five suppliers—Michelin, Bridgestone, Continental, Goodyear, and Pirelli—accounted for a significant share of global revenue, indicating moderate market concentration. These industry leaders allocate a notable portion of their sales to R&D, emphasizing advancements in sensor integration and sustainable materials. Bridgestone is channeling substantial investment into a U.S. expansion, with a focus on tires for electric vehicles (EVs). Meanwhile, Continental is making a significant financial commitment to enhance digital tire intelligence. Chinese companies, including Zhongce, Linglong, Sailun, and Triangle, are leveraging cost-efficient silica compounding processes. This strategy has enabled them to capture market share in price-sensitive areas, although they still lack the motorsport credentials that premium original equipment manufacturers (OEMs) typically demand.
Airless tire technology is experiencing a surge in innovation, with Michelin's Uptis in fleet trials with General Motors, with a potential rollout in the near future. In niche markets, Toyo and Kumho carve out their specialties: Toyo's Open Country M/T leads the North American overlanding scene, while Kumho's Ecsta V720, priced competitively, lures track-day aficionados with its near-slick grip.
Platforms powered by artificial intelligence, such as Goodyear's SightLine and Sumitomo's Sensing Core, are pivoting the revenue model towards data subscriptions, boasting impressive profit margins. Compliance with Euro 7 regulations presents a challenge, but also a protective barrier, benefiting established players equipped with certified drum rigs. In contrast, the industry's rapid product cycles are pressuring smaller players, pushing many to either exit the market or seek consolidation.
High Performance Tires Industry Leaders
Bridgestone Corporation
The Goodyear Tire & Rubber Company
Continental AG
Pirelli & C. S.p.A.
MRF Tyres
- *Disclaimer: Major Players sorted in no particular order

Market Opportunities and Future Outlook
EV-specific high-performance fitments and software-enabled tires are expanding the addressable premium pool across OEM and aftermarket channels. Sumitomo Rubber Industries (Falken) announced in July 2026 that custom AZENIS FK520 (NG0) tires were selected for OE fitment on the Porsche Cayenne Electric, highlighting bespoke UHP development for low rolling resistance alongside high-speed stability. In March 2026, Pirelli also expanded its aftermarket UHP range with the P Zero R and P Zero Trofeo RS, developed using virtual simulation at its Milan R&D Center and manufactured with its MIRS process in Italy and the United States, indicating faster iteration pathways for specialty sizes and compounds.
Capacity and footprint investments point to regional supply whitespace for premium passenger and light-truck performance tires, particularly where exports to Europe and North America require consistent quality and homologation readiness. Continental inaugurated a Rayong, Thailand, plant expansion in May 2026 (over EUR 300 million), adding 3 million units of annual capacity for passenger car and light truck tires. India-based producers also announced sizable radial expansions that can support performance assortments: Apollo Tyres disclosed an INR 5,810 crore program in February 2026 to expand passenger car radial and truck and bus radial capacity at its Andhra Pradesh facility, and CEAT announced an INR 1,300 crore Chennai expansion in March 2026, adding 35 lakh units annually with an export focus. These moves align with shifts toward larger rim sizes, EV load requirements, and tighter durability and abrasion expectations, creating room for silica-rich compounds, low-wear tread programs, and connected-tire services that integrate with vehicle dynamics and fleet maintenance systems.
Recent Industry Developments
- July 2026: Continental launched the CrossContact A/T2 tire for SUVs, 4x4 vehicles, and light trucks, using reinforced sidewalls and an all-season compound tailored for mixed on-road and off-road use. The launch expands high-performance-oriented capability into adventure and light-truck fitments where higher loads and impact resistance are critical. It also broadens the premium product ladder for larger wheel sizes increasingly used on SUVs.
- May 2026: Pirelli began producing connected tires with Cyber Tyre technology at its Rome, Georgia facility in the United States, supported by deployment of its Modular Integrated Robotized System manufacturing approach. This adds localized capacity for sensor-integrated premium products and shortens supply lines for US OEM and replacement demand. Scaling connected-tire production also supports data-enabled services linked to vehicle dynamics and fleet applications.
- May 2024: Bridgestone launched the Turanza EV tire featuring aramid belt construction and a silica-rich compound aimed at managing heat and wear under EV torque and higher curb weights. The product underscores the shift toward EV-rated high-performance architectures, including stronger carcass designs and lower rolling resistance tradeoffs. It also reinforces premium pricing levers as automakers and consumers prioritize range, noise, and durability in performance-oriented EV fitments.


Research Methodology Framework and Report Scope
Market Definition and Coverage
This market covers the revenue generated from high performance tires sold through OEM and aftermarket channels, where the tire is designed for higher speed ratings, grip, and handling versus standard tires, and is used across performance-focused vehicle applications.
Scope exclusions: Retreaded tires and non-pneumatic tire products are excluded when they are not sold and priced as high performance tires.
Segmentation Overview
- By Type
- Racing Slick
- Tread Tire
- Other Types
- By Sales Channel
- OEM
- Aftermarket
- By Application
- Racing Cars
- Off-the-Road Vehicles
- Other Vehicle Types
- By Tire Type
- Summer
- Winter
- All-Season
- By Region
- North America
- United States
- Canada
- Rest of North America
- South America
- Brazil
- Argentina
- Rest of South America
- Europe
- United Kingdom
- Germany
- Spain
- Italy
- France
- Russia
- Rest of Europe
- Asia Pacific
- India
- China
- Japan
- South Korea
- Rest of Asia Pacific
- Middle East and Africa
- United Arab Emirates
- Saudi Arabia
- Turkey
- Egypt
- South Africa
- Rest of Middle East and Africa
- North America
Data Sources, Market Sizing, and Validation
Desk Research
Desk research was used to set the foundation for the model and keep assumptions realistic across regions and vehicle parc differences. We reviewed public road-transport and vehicle registration statistics, and we also checked trade-flow indicators that reflect tire movement and relative pricing pressure along major corridors.
Sources referenced included materials from government transport and highway agencies, customs and trade statistics portals, national statistics offices, and international bodies that publish mobility and vehicle indicators, plus technical publications and peer-reviewed journals that track tire materials, safety, and performance standards. We also used company annual reports, investor presentations, product catalogs, and credible press coverage for directional checks, with a paid subscription for company financials and a patent database for tracking product claims and technology intensity. These desk sources are illustrative only, and many other public and paid references were used to collect, validate, and clarify data points.
Primary Interviews and Surveys
Primary work was used to test what high performance means in day-to-day buying and fitment, and to validate pricing, channel mix, and replacement cycles by region. We interviewed stakeholders across tire manufacturing, distribution and retail, OE fitment ecosystems, and vehicle performance communities, covering APAC, EMEA, and the Americas so the assumptions did not over-rely on one demand pattern.
Distribution of primary research fieldwork respondents
| Company type | Respondent position | Region |
|---|---|---|
| Top tier: 33% | CXOs: 14% | APAC: 43% |
| Mid tier: 53% | Functional/Unit leaders: 30% | EMEA: 35% |
| Smaller Players: 14% | Managers: 56% | Americas: 22% |
Market-Sizing & Forecasting
Sizing starts with a top-down build that reconstructs the addressable tire value pool from vehicle parc and new vehicle output signals, and then narrows it using performance tire fitment and replacement behavior by region and channel. Once the demand pool is formed, we apply price ladders using observed premium-to-standard spreads, rim size mix shifts, and seasonality in summer versus winter and all-season demand.
To keep the totals grounded, we run selective bottom-up checks using sampled SKU pricing, channel checks on typical volumes, and supplier roll-ups for a limited set of large markets where disclosures and distribution structure are clearer. Where information gaps appear, we create ranges for ASP and replacement frequency, then tighten them using expert feedback until the inputs align with what buyers and retailers treat as feasible.
For forecasting, scenario analysis is used because performance tire demand tracks a mix of drivers that can change quickly, including sports car and premium SUV sales, wheel size trends, track and motorsport activity, and raw material and freight cost pass-through. The final outlook is then adjusted using the most consistent primary feedback on how quickly EV fitments, regulation on tire labeling, and premiumization are expected to shift mix and pricing.
Data Validation & Update Cycle
Outputs are validated through several checks, starting with internal consistency tests across regions, channels, and tire types so the totals add up and do not violate basic demand logic. We flag anomalies when growth rates, implied ASPs, or replacement volumes fall outside reasonable bands, and then we revisit assumptions before sign-off.
We also compare the model against independent signals such as premium vehicle sales direction, import and export movement, and visible pricing shifts in key markets, followed by a second analyst review to reduce avoidable errors. Reports are refreshed annually, and interim updates are made when material events occur, after which a final pre-delivery pass is completed so clients receive the latest view.
Mordor Intelligence's High Performance Tire Market Size Versus Other Published Estimates
Published market sizes for high performance tires often differ because the scope line is drawn differently, and then the pricing and replacement assumptions get applied to different demand pools. Some studies treat high performance as a broad premium tire bucket, while others restrict it closer to speed rating and performance-oriented fitments.
Evidence such as the stated channel coverage (OEM plus aftermarket) and the explicit segmentation across tire types and regions is what ties Mordor Intelligence's estimate to a measurable demand pool, and it also limits category bleed into adjacent premium touring or general passenger tire demand. Differences also come from base year choice, how currency conversion timing is handled, and whether the forecast assumes aggressive premiumization versus a more measured mix shift.
Benchmark comparison
| Source | Market Size | Gaps in Research Methodology |
|---|---|---|
| Mordor Intelligence | USD 59.82 B (2026) | |
| Trade Publisher A | USD 51.60 B (2024) | Uses a different base year and often blends vehicle-type coverage that can pull in off-the-road and adjacent performance categories, which changes the implied replacement and pricing levels. |
| Industry Report B | USD 52.60 B (2024) | Anchors the estimate to a 2024 base and applies its own channel and mix assumptions, and the premiumization and tire-type splits used for revenue build can shift totals when compared year to year. |
Overall, the spread is mainly explained by base year selection and how tightly high performance is separated from nearby premium tire demand, and then by the pricing ladder applied to the channel mix. By keeping inputs traceable to vehicle output signals, replacement behavior, and observed price spreads, the estimate stays repeatable and easier to reconcile when assumptions are updated.


Key Questions Answered in the Report
What is the projected value of the high-performance tire market by 2031?
The high-performance tire market is expected to reach USD 89.57 billion by 2031, growing at an 8.43% CAGR.
Which region holds the largest share today?
Europe led the way in 2025 with a 38.35% share, supported by the Euro 7 regulations and OEM partnerships.
Why are EVs reshaping high-performance tire design?
Electric vehicles add weight and deliver instant torque, requiring aramid belts, HL load indices, and silica-rich compounds to manage heat and wear.
How fast is the aftermarket segment growing?
Replacement sales are forecast to expand at a rate of 8.55% per year, as enthusiasts switch to semi-slick and off-road compounds more frequently than OEM cycles.
Which tire type is gaining popularity in Nordic countries?
Winter tires with studless, ice-grip compounds such as Nokian’s Hakkapeliitta 11 are expanding rapidly due to regulatory mandates.
What digital innovations are manufacturers offering?
AI-enabled platforms, such as Michelin’s connected fleet service and Goodyear’s SightLine, predict maintenance needs and generate subscription revenue streams.
Page last updated on:


 Your data is secure and never sold or shared.


