Herbal Medicinal Products Market Size and Share
Market Overview
| Study Period | 2021 - 2031 |
|---|---|
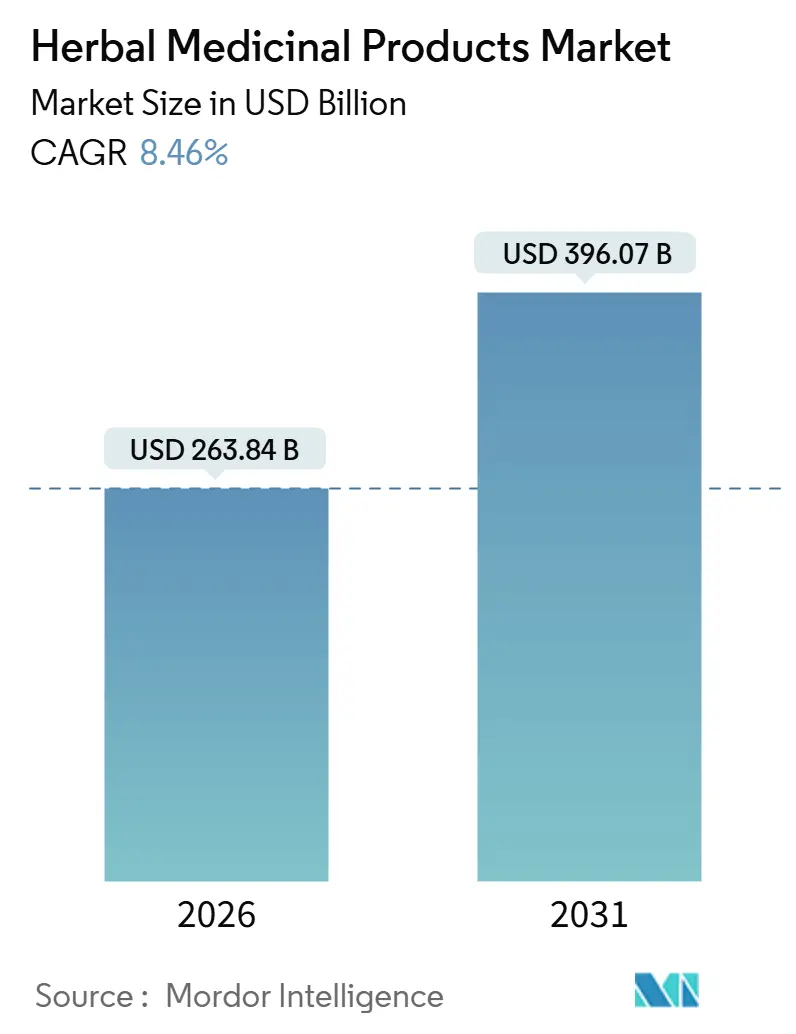
| Market Size (2026) | USD 263.84 Billion |
| Market Size (2031) | USD 396.07 Billion |
| Growth Rate (2026 - 2031) | 8.46% CAGR |
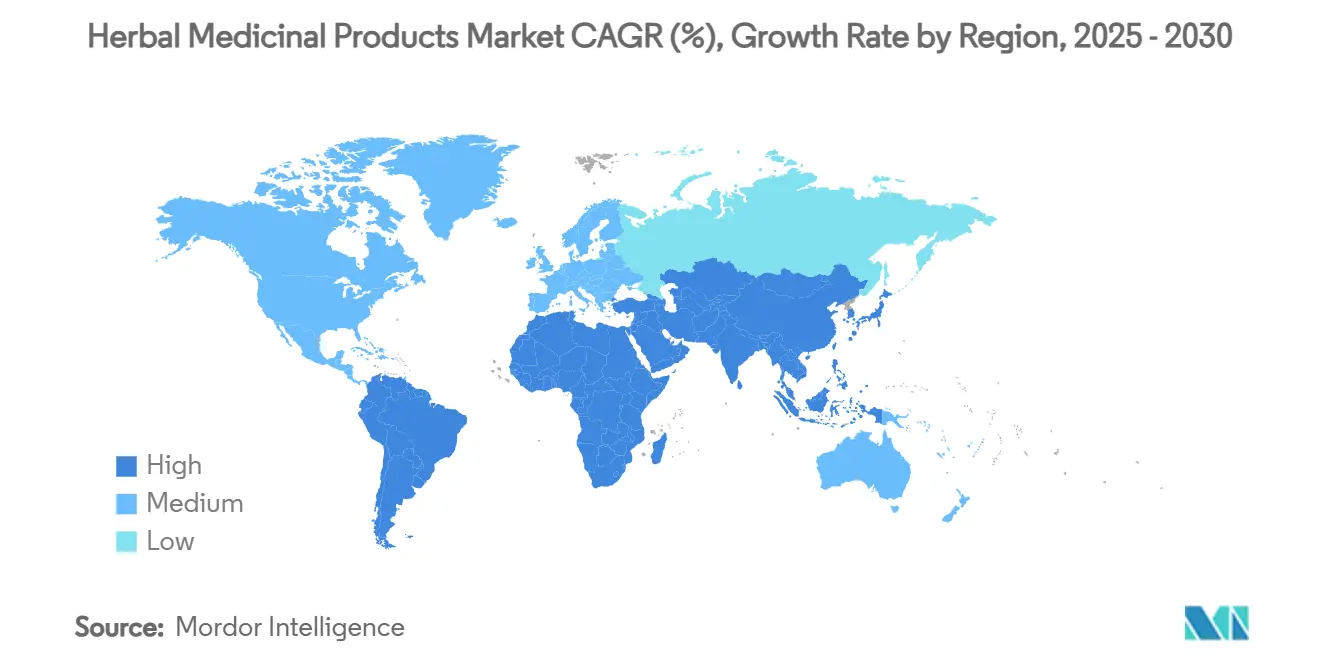
| Fastest Growing Market | Europe |
| Largest Market | Asia Pacific |
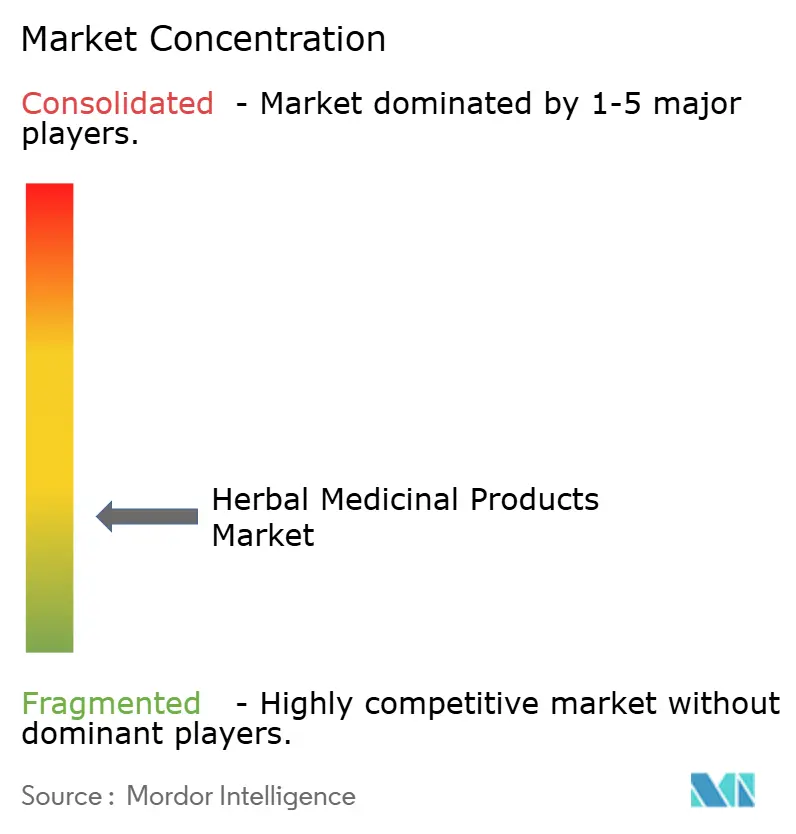
| Market Concentration | Low |
Major Players *Disclaimer: Major Players sorted in no particular order Image © Mordor Intelligence. Reuse requires attribution under CC BY 4.0. | |
Herbal Medicinal Products Market Analysis by Mordor Intelligence
The Herbal Medicinal Products Market size is estimated at USD 263.84 billion in 2026, and is expected to reach USD 396.07 billion by 2031, at a CAGR of 8.46% during the forecast period (2026-2031).
Rising consumer preference for plant-based therapies, AI-enabled phytochemical discovery, and fermentation-based biomanufacturing underpin the sector’s durability. Regulatory agencies in the United States, China, and the European Union have issued streamlined pathways that shorten launch timelines for innovative botanicals, prompting faster commercialization and wider product diversity. Digital channels amplify direct-to-consumer engagement, while blockchain traceability and advanced analytics mitigate adulteration risks. Together, these trends sustain the herbal medicinal products market momentum and encourage investment across all value-chain stages.
Key Report Takeaways
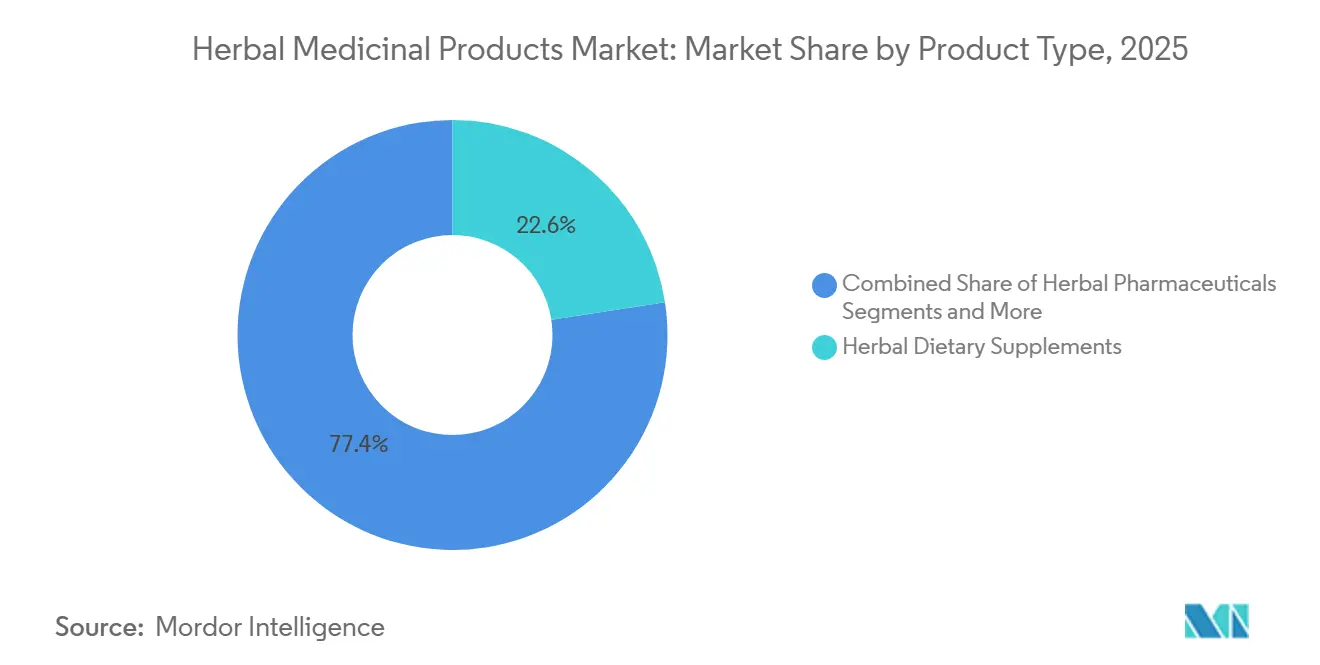
- By product type, herbal pharmaceuticals led with 30.44% of the herbal medicinal products market share in 2025, while herbal dietary supplements are projected to expand at a 9.42% CAGR through 2031.
- By source, roots & rhizomes commanded 42.76% share of the herbal medicinal products market size in 2025, are set to grow at 9.05% CAGR to 2031.
- By form, tablets and capsules held 45.73% revenue share in 2025; teas & infusions are pacing ahead at 10.99% CAGR through 2031.
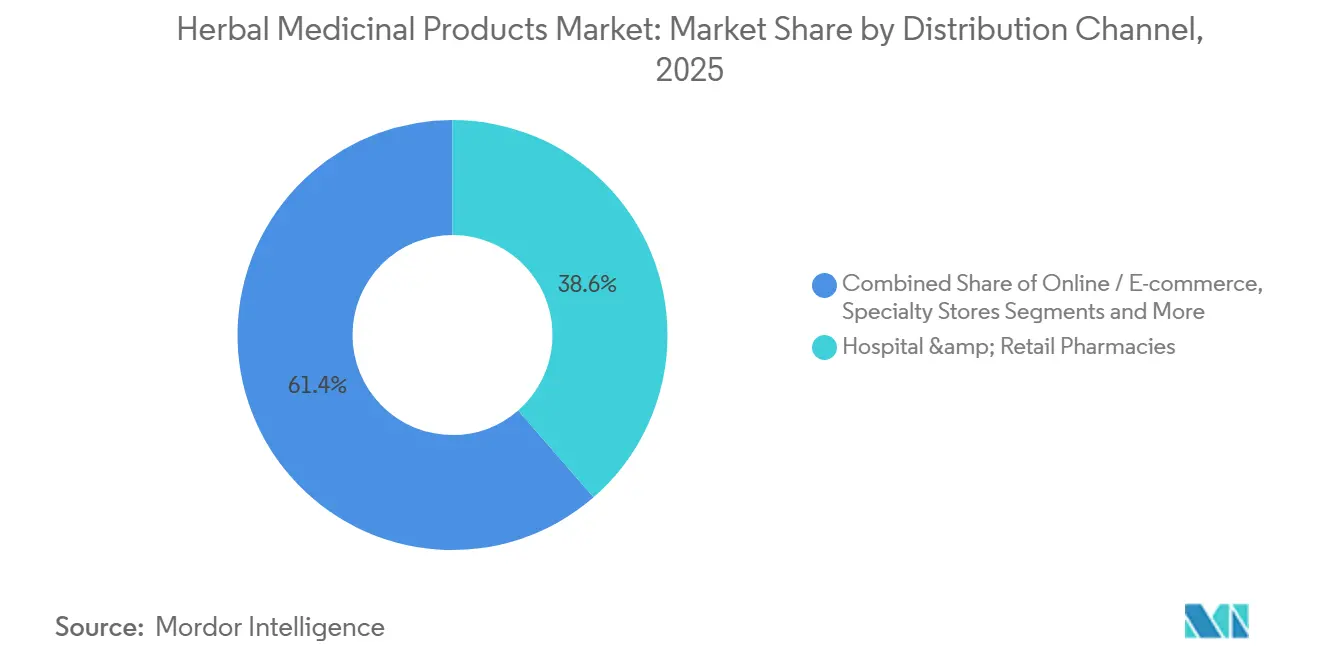
- By distribution channel, hospital and retail pharmacies retained 38.61% share of the herbal medicinal products market size in 2025, while e-commerce is advancing at 9.97% CAGR toward 2031.
- By medicinal plant type, turmeric accounted for 19.68% share in 2025; ginseng registers the fastest growth at 10.26% CAGR during the forecast period.
- By geography, Asia-Pacific led with 51.81% revenue share in 2025, while Europe is forecast to expand at a 10.57% CAGR through 2031.
Note: Market size and forecast figures in this report are generated using Mordor Intelligence’s proprietary estimation framework, updated with the latest available data and insights as of January 2026.
Global Herbal Medicinal Products Market Trends and Insights
Drivers Impact Analysis*
| Driver | (~) % Impact on CAGR Forecast | Geographic Relevance | Impact Timeline |
|---|---|---|---|
| Consumer shift toward natural OTC remedies | +1.2% | Global, strongest in North America & EU | Medium term (2–4 years) |
| Progressive regulators shortening launches | +0.8% | North America, EU, select APAC | Short term (≤ 2 years) |
| Rapid e-commerce & DTC nutraceutical brands | +1.1% | Global, led by North America & APAC | Short term (≤ 2 years) |
| AI mining of phytochemical databases | +0.7% | North America, EU, China | Long term (≥ 4 years) |
| Adaptogen uptake in sports nutrition drinks | +0.9% | North America, EU, APAC urban centers | Medium term (2–4 years) |
| Fermentation-based pharma-grade production | +0.6% | North America, EU, Japan | Long term (≥ 4 years) |
| Source: Mordor Intelligence | |||
Consumers worldwide have shifted toward natural, plant-based OTC remedies
Global sales data from 2023 showed resilient growth for botanical supplements, even amid economic uncertainty, highlighting sustained demand across age groups seeking preventive wellness. Expanding scientific validation of ingredients such as psyllium and beetroot reinforces purchase confidence. European consumer behavior mirrors this trend as regulatory structures encourage evidence-based claims without restricting traditional knowledge. The ongoing behavioral pivot underpins steady expansion of the herbal medicinal products market.
Progressive regulators are shortening launch timelines
Revised New Dietary Ingredient Notification guidance in 2024 allows companies to reference Master Files, cutting development cycles by up to two years.[1]U.S. Food and Drug Administration, “Revised Draft Guidance for Industry: New Dietary Ingredient Notifications,” fda.gov China’s Traditional Chinese Medicine Regulatory Science initiative employs AI for faster dossier evaluation, broadening opportunities for small innovators. While resource constraints at the FDA could slow inspections, overall regulatory clarity continues to buoy the herbal medicinal products market.
Rapid penetration of e-commerce and direct-to-consumer nutraceutical brands
Digital platforms give brands global reach, lower customer acquisition cost, and enable personalized recommendations through AI analytics. Transparent supply-chain dashboards reassure buyers about purity, a critical trust factor. ASEAN regulatory harmonization further accelerates cross-border trade, lifting online sales volume and sustaining the herbal medicinal products market growth trajectory.
AI-driven platforms are mining phytochemical databases and predicting herb-drug interactions
Large-language models catalog more than 14,000 botanical profiles, dramatically shortening discovery cycles.[2]Tian Xu, “ShennongAlpha: An AI-Driven Platform for Natural Medicinal Material Knowledge,” Nature Reviews Drug Discovery, nature.com Machine-learning tools also flag metabolic pathway conflicts, lowering clinical-trial risk and boosting physician confidence. The resulting data precision broadens therapeutic adoption and deepens the herbal medicinal products market penetration.
Restraints Impact Analysis*
| Restraint | (~) % Impact on CAGR Forecast | Geographic Relevance | Impact Timeline |
|---|---|---|---|
| Raw-material adulteration & supply shocks | −1.4% | Global, highest impact on developing markets | Short term (≤ 2 years) |
| Fragmented global regulatory frameworks | −0.9% | Global, severe in emerging markets | Medium term (2–4 years) |
| Climate-driven loss of wild plant species | −0.7% | Biodiversity hotspots worldwide | Long term (≥ 4 years) |
| Synthetic-biology actives as substitutes | −0.5% | North America, EU, select APAC | Long term (≥ 4 years) |
| Source: Mordor Intelligence | |||
Raw-material adulteration & supply shocks
Economic adulteration of bilberry, cranberry, and saw palmetto undermines brand reputation and compels investment in DNA barcoding to confirm authenticity. Climate volatility further disrupts harvests, creating price spikes that compress margins across the herbal medicinal products market.
Fragmented global regulatory frameworks
Divergent heavy-metal limits and classification rules force firms to prepare multiple dossiers, elevating compliance costs.[3]Isa Inada, “Comparison of Regulations for Heavy Metals in Herbal Medicines,” Therapeutic Innovation & Regulatory Science, springer.com Smaller enterprises struggle most, delaying product launches and tempering the growth rate of the herbal medicinal products market.
*Our forecasts treat driver/restraint impacts as directional, not additive. The impact forecasts reflect baseline growth, mix effects, and variable interactions.
Segment Analysis
By Product Type: Functional foods and beverages eclipse traditional supplements in growth
Herbal dietary supplements captured 22.56% of the herbal medicinal products market share in 2025, reflecting mature consumer trust in capsules and tablets. Functional foods and beverages are charting a 8.29% CAGR to 2031 as shoppers fold botanicals into daily eating rituals rather than separate pill regimens. Sports-nutrition brands now blend ashwagandha, cordyceps, and rhodiola into hydration drinks to replace synthetic stimulants. This shift expands usage occasions and nudges retailers to allocate more shelf space to ready-to-consume formats.
Fermentation and precision-extraction technologies stabilize bioactive content, allowing manufacturers to promise consistent dosing in palatable products. These advances also mitigate raw-material shortages by producing key compounds such as artepillin C in yeast, boosting supply security. Higher margin potential fuels marketing spend that widens consumer reach, reinforcing functional foods’ role as the primary engine of future herbal medicinal products market expansion.


By Source: Flowers and bark outpace leaves on premium potency appeal
Leaves generated 20.93% of the herbal medicinal products market size in 2025 thanks to entrenched green-tea and ginkgo pipelines. Flowers and bark now deliver the highest 7.38% CAGR because they contain dense anthocyanins, salicins, and proanthocyanidins prized for targeted benefits. Limited harvest windows and specialized processing underpin premium pricing that lifts revenue even on moderate volumes.
Enhanced extraction hardware unlocks delicate floral and woody matrices, while sustainability certifications reassure buyers about ethical sourcing. Brands highlight terroir and seasonal narratives to justify higher ticket sizes. As consumers seek niche bioactives, demand migrates toward these once-secondary plant parts, diversifying supply chains and elevating average selling prices in the herbal medicinal products market.
By Form: Softgels and gummies reshape convenience expectations
Tablets and capsules held 45.73% share in 2025, supported by efficient tooling and widespread familiarity. Softgels and gummies are advancing at 9.49% CAGR, powered by better taste, ease of swallowing, and improved absorption for lipophilic actives. Younger buyers view gummies as snack-adjacent, driving repeat purchases.
Formulators curb sugar by using modified starches and low-glycemic sweeteners, widening appeal to health-focused cohorts. Softgel producers leverage optimized lipid carriers that raise bioavailability without altering flavor. These innovations boost compliance rates and elevate brand loyalty, positioning novel formats for outsized influence on the herbal medicinal products market trajectory.
By Distribution Channel: E-commerce scales faster than brick-and-mortar pharmacies
Hospital and retail pharmacies retained 38.61% revenue share in 2025, benefitting from pharmacist guidance and regulated storage environments. Online platforms, however, are racing ahead at an 9.97% CAGR on the strength of doorstep delivery, dynamic pricing, and endless-aisle product depth.
AI-driven recommendation engines personalize bundles by parsing health data, lifting basket sizes and repeat-order rates. ASEAN e-commerce harmonization allows cross-border shipments with simpler customs clearance, opening new markets for small brands. Transparent sourcing dashboards combat adulteration fears, cementing digital channels as pivotal growth levers inside the herbal medicinal products market.
By Medicinal Plant Type: Ginseng innovation narrows turmeric’s lead
Turmeric accounted for 19.68% of 2025 sales, sustained by extensive clinical evidence for curcumin’s anti-inflammatory action. Genomic decoding of Panax ginseng unlocks new saponin pathways, propelling a 10.26% CAGR that challenges turmeric’s dominance. Rare ginsenosides now target cognitive, metabolic, and gut-brain indications, widening clinical interest.
Precision fermentation and advanced extraction raise yields of these scarce actives, reducing cost barriers. Marketing campaigns spotlight centuries-old heritage alongside modern science to attract both tradition-minded and evidence-seeking consumers. As a result, competitive intensity within the medicinal-plant mix is rising, reshaping future revenue distribution across the herbal medicinal products market.
Geography Analysis
North America generated 28.94% of 2025 revenue for the herbal medicinal products market, benefiting from transparent regulatory frameworks and high discretionary spending. Updated FDA guidance cuts bureaucratic friction, enticing innovation. Consumers increasingly choose evidence-based botanicals such as beetroot, whose sales climbed 108% in 2023.
Asia-Pacific achieves the fastest 7.90% CAGR through 2031, propelled by government initiatives that integrate traditional medicine into national healthcare systems. China's ethnic-medicine policy and India's expanded nutraceutical rules create fertile ground for startups and multinationals alike. India active pharmaceutical ingredients from botanical sources are emerging as key differentiators in the global herbal medicine supply chain. Japan’s demographic aging intensifies demand for cognitive and joint-support formulations, while Southeast Asian biodiversity supports raw-material sourcing.
Europe sustains steady growth under Directive 2004/24/EC, which balances traditional use with safety documentation. Germany’s naturopathic culture anchors regional demand, and the UK maintains relevance despite post-Brexit realignment. Emerging markets in the Middle East and Africa show potential but face infrastructure and regulatory gaps that must be bridged to unlock fuller participation in the herbal medicinal products market.

Competitive Landscape
The herbal medicinal products market remains moderately fragmented, with multinational incumbents, regional specialists, and agile digital natives vying for share. Leaders pursue vertical integration to secure raw materials and deploy AI-driven R&D tools that predict herb-drug interactions, improving speed-to-market for compliant formulations.
Blockchain systems document farm-to-bottle provenance, differentiating premium brands amid pervasive adulteration concerns. Partnerships between biotech firms and traditional medicine houses accelerate fermentation-based production of scarce actives, exemplified by artepillin C’s 10-fold yield increase via engineered yeast.
Direct-to-consumer disruptors lean on influencer marketing, subscription logistics, and personalized quiz engines to capture younger cohorts. Consolidation continues as ingredient suppliers acquire formulation specialists, illustrated by Roquette’s agreement to purchase IFF Pharma Solutions, bolstering excipient capabilities vital for botanical dosage forms. Sustained technological investment and strategic alliances define the playbook for companies intent on outpacing rivals within the herbal medicinal products market.
Herbal Medicinal Products Industry Leaders
Schwabe Group
Tsumura & Co
Himalaya Global Holdings
Blackmores Ltd
Nature’s Bounty
- *Disclaimer: Major Players sorted in no particular order

Recent Industry Developments
- March 2025: Roquette completed acquisition of IFF Pharma Solutions, expanding its excipient portfolio for botanical formulations.
- February 2025: India’s National Institute of Ayurveda introduced a cosmetic line promoting chemical-free skincare.
- November 2024: Kobe University researchers achieved a 10-fold increase in artepillin C output using bioengineered yeast, mitigating supply constraints for propolis-derived compounds.


Global Herbal Medicinal Products Market Report Scope
| Herbal Pharmaceuticals |
| Herbal Dietary Supplements |
| Herbal Functional Foods & Beverages |
| Herbal Cosmetics & Personal Care |
| Leaves |
| Roots & Rhizomes |
| Whole Plant |
| Fruits & Seeds |
| Flowers & Bark |
| Tablets & Capsules |
| Powders & Granules |
| Liquid Extracts & Syrups |
| Teas & Infusions |
| Softgels & Gummies |
| Topicals & Ointments |
| Hospital & Retail Pharmacies |
| Online / E-commerce |
| Specialty Stores |
| Hypermarkets & Supermarkets |
| Aloe vera |
| Echinacea |
| Turmeric (Curcuma longa) |
| Ginseng |
| Ginger |
| Garlic |
| Others |
| North America | United States |
| Canada | |
| Mexico | |
| Europe | Germany |
| United Kingdom | |
| France | |
| Italy | |
| Spain | |
| Rest of Europe | |
| Asia-Pacific | China |
| Japan | |
| India | |
| Australia | |
| South Korea | |
| Rest of Asia-Pacific | |
| Middle East and Africa | GCC |
| South Africa | |
| Rest of Middle East and Africa | |
| South America | Brazil |
| Argentina | |
| Rest of South America |
| By Product Type | Herbal Pharmaceuticals | |
| Herbal Dietary Supplements | ||
| Herbal Functional Foods & Beverages | ||
| Herbal Cosmetics & Personal Care | ||
| By Source (Plant Part) | Leaves | |
| Roots & Rhizomes | ||
| Whole Plant | ||
| Fruits & Seeds | ||
| Flowers & Bark | ||
| By Form | Tablets & Capsules | |
| Powders & Granules | ||
| Liquid Extracts & Syrups | ||
| Teas & Infusions | ||
| Softgels & Gummies | ||
| Topicals & Ointments | ||
| By Distribution Channel | Hospital & Retail Pharmacies | |
| Online / E-commerce | ||
| Specialty Stores | ||
| Hypermarkets & Supermarkets | ||
| By Medicinal Plant Type | Aloe vera | |
| Echinacea | ||
| Turmeric (Curcuma longa) | ||
| Ginseng | ||
| Ginger | ||
| Garlic | ||
| Others | ||
| By Geography | North America | United States |
| Canada | ||
| Mexico | ||
| Europe | Germany | |
| United Kingdom | ||
| France | ||
| Italy | ||
| Spain | ||
| Rest of Europe | ||
| Asia-Pacific | China | |
| Japan | ||
| India | ||
| Australia | ||
| South Korea | ||
| Rest of Asia-Pacific | ||
| Middle East and Africa | GCC | |
| South Africa | ||
| Rest of Middle East and Africa | ||
| South America | Brazil | |
| Argentina | ||
| Rest of South America | ||


Key Questions Answered in the Report
What is the current size of the global herbal medicinal products market in 2025?
The herbal medicinal products market is valued at USD 155.77 billion in 2025.
What CAGR is projected for the herbal medicinal products market through 2030?
The market is set to grow at a 7.58% CAGR through 2030.
Which product category leads the herbal medicinal products market?
Herbal dietary supplements lead with 39.89% market share in 2024.
Why is Asia-Pacific the fastest-growing regional market?
Government integration of traditional medicine into public health systems and rising middle-class wellness spending drive a 10.27% CAGR in Asia-Pacific.
Page last updated on:


