Market Overview
| Study Period | 2020 - 2031 |
|---|---|
| Forecast Data Period | 2026 - 2031 |
| Historical Data Period | 2020 - 2024 |
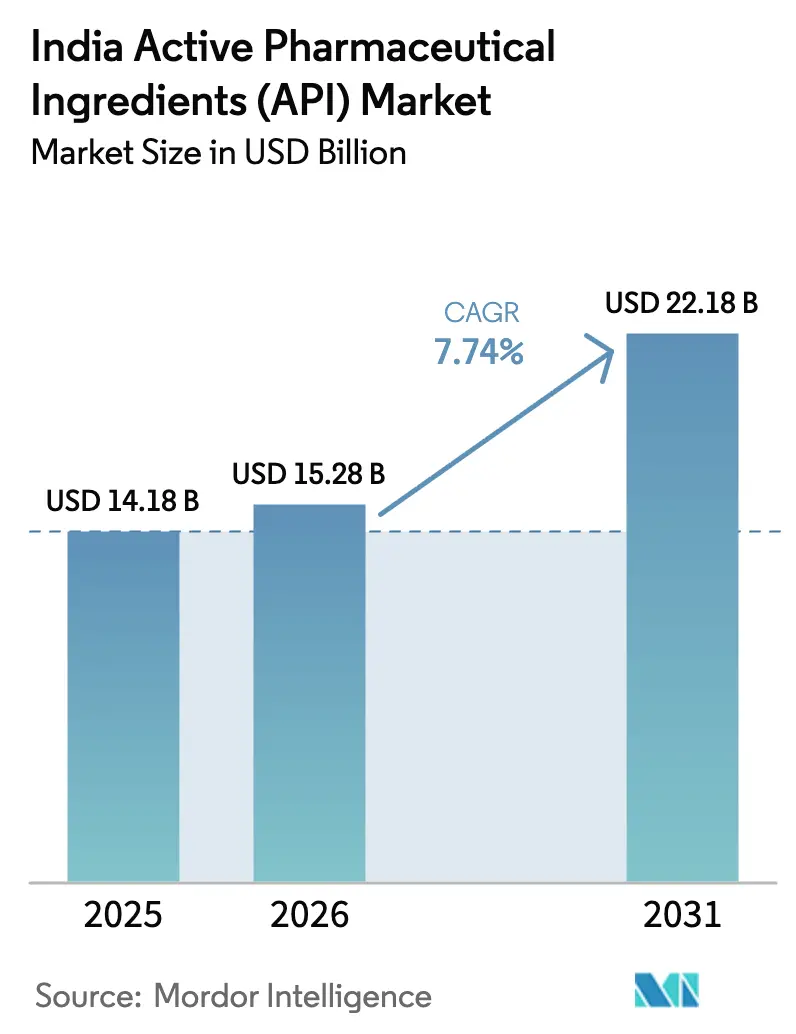
| Base Year Market Size (2025) | USD 14.18 Billion |
| Market Size (2026) | USD 15.28 Billion |
| Market Size (2031) | USD 22.18 Billion |
| Growth Rate (2026 - 2031) | 7.74% CAGR |
Major Players *Disclaimer: Major Players sorted in no particular order Image © Mordor Intelligence. Reuse requires attribution under CC BY 4.0. | |
India Active Pharmaceutical Ingredients (API) Market Analysis by Mordor Intelligence
The India API market size is expected to grow from USD 14.18 billion in 2025 to USD 15.28 billion in 2026 and is forecast to reach USD 22.18 billion by 2031 at 7.74% CAGR over 2026-2031. Solid policy incentives, accelerating export demand and rapid capacity additions collectively underpin this growth trajectory. The Production Linked Incentive (PLI) scheme is releasing patient capital for green-field plants and bulk-drug parks, compressing logistics costs and improving utility access for producers. At the same time, U.S. and European buyers are moving sourcing away from China after passage of the Biosecure Act, resulting in a 50% jump in request-for-quotation volumes at leading Indian contract manufacturers during 2024. Domestic firms are also upgrading fermentation, containment and continuous-manufacturing assets to capture premium Oncology and Biotech volumes, while AI-enabled process control is shaving cycle time and energy consumption. Counter-pressures stem from volatile prices of China-sourced key starting materials (KSMs) and compliance gaps at MSME facilities, yet both forces are driving the sector toward vertical integration and quality-system upgrades that strengthen long-run competitiveness.
Key Report Take Aways
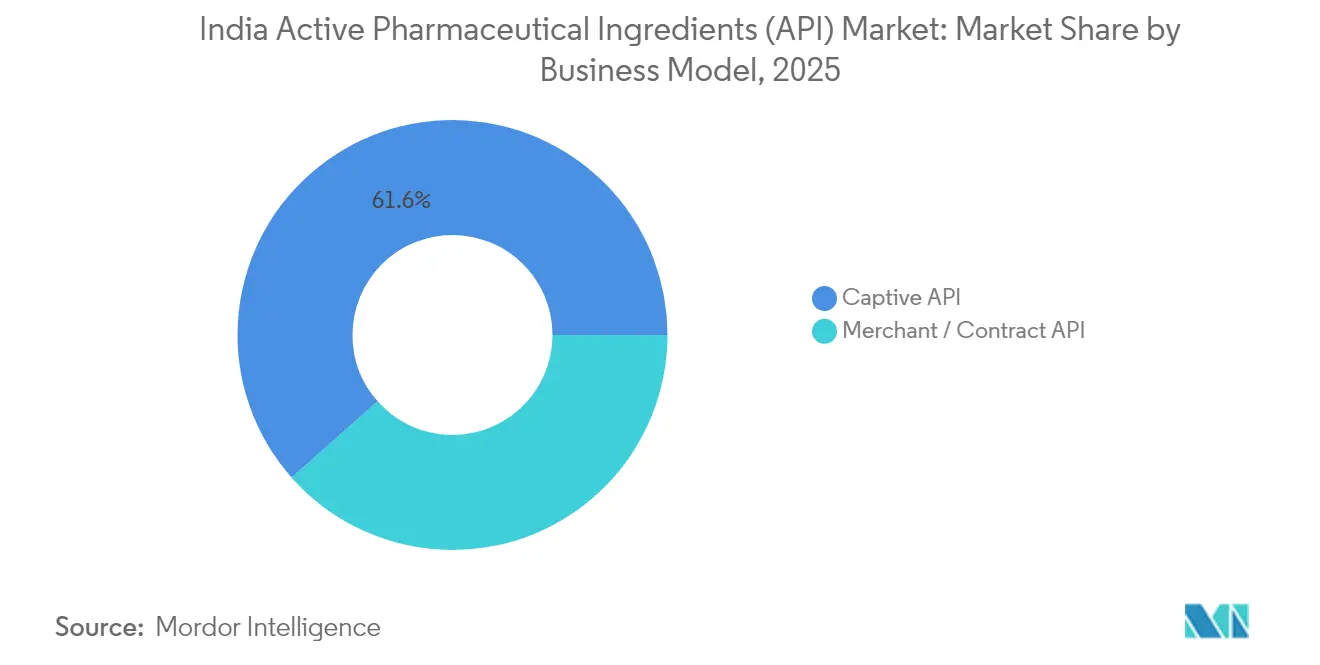
- By business model, captive production held 61.55% of the India API market share in 2025 while merchant operations are projected to rise at a 9.42% CAGR to 2031.
- By synthesis type, synthetic molecules controlled 72.80% of the India API market size in 2025; biotech APIs are on track for a 9.18% CAGR through 2031.
- By therapeutic area, cardiovascular ingredients led with 23.20% share of the India API market size in 2025, whereas oncology compounds are advancing at an 8.55% CAGR to 2031.
- By end-use, pharma and biopharma companies captured 75.82% of the India API market share in 2025; CDMOs/CMOs record the strongest outlook at an 8.44% CAGR to 2031.
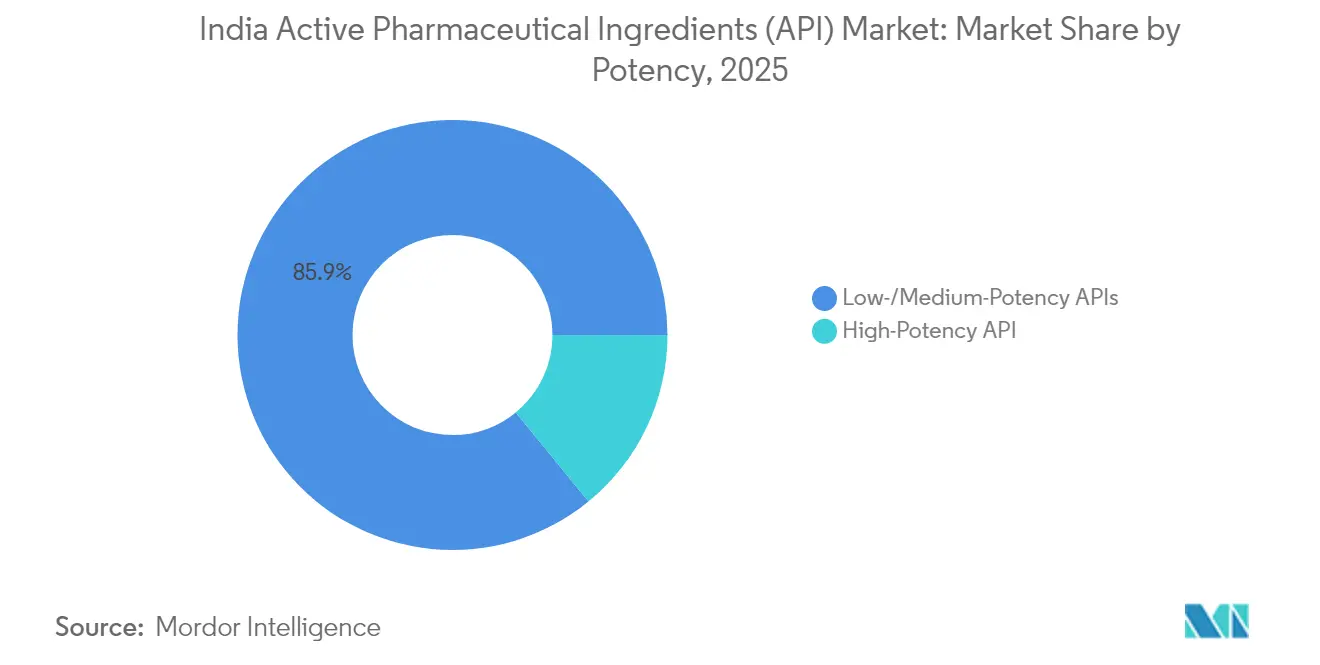
- By potency, low-/medium-strength molecules accounted for 85.90% of the India API market size in 2025, but high-potency APIs are forecast to expand at a 8.79% CAGR up to 2031.
Note: Market size and forecast figures in this report are generated using Mordor Intelligence’s proprietary estimation framework, updated with the latest available data and insights as of 2026.
India Active Pharmaceutical Ingredients (API) Market Trends and Insights
Driver Impact Analysis*
| Driver | (~) % Impact on CAGR Forecast | Geographic Relevance | Impact Timeline |
|---|---|---|---|
| Government PLI & Bulk-Drug-Park push for self-reliance | +2.1% | National, with concentration in Gujarat, Himachal Pradesh, Andhra Pradesh | Medium term (2-4 years) |
| Accelerated shift of US/EU orders to India post-Biosecure Act | +1.8% | Global, with primary impact on North America & EU sourcing | Short term (≤ 2 years) |
| Scale-up in oncology HPAPI blocks (Visakhapatnam, Hyderabad clusters) | +1.2% | Regional, concentrated in Andhra Pradesh and Telangana | Medium term (2-4 years) |
| Growth of CRDMO exports serving Phase-I/II innovators | +1.5% | Global, with focus on North America & EU clinical markets | Long term (≥ 4 years) |
| Green-chemistry route adoption to lower solvent import bill | +0.9% | National, with emphasis on West-coast manufacturing hubs | Long term (≥ 4 years) |
| AI-driven process-optimization cutting cycle-times ≤20% | +0.8% | National, with early adoption in major pharmaceutical clusters | Medium term (2-4 years) |
| Source: Mordor Intelligence | |||
Government PLI & Bulk-Drug-Park Push for Self-Reliance
Thirty-two PLI projects worth Rs 4,024 crore are operational, exceeding originally sanctioned investment and enabling domestic synthesis of critical molecules such as Penicillin G for the first time in three decades. Bulk-drug parks in Gujarat, Himachal Pradesh and Andhra Pradesh provide solvent-recovery units, effluent treatment and common utilities that lower operating costs. Aurobindo Pharma’s new 15,000 tpa Pen-G block exemplifies the turnaround in self-reliance. Import dependence on critical intermediates is forecast to halve once the green-field assets reach nameplate utilization, and the Ministry of Commerce & Industry pegs cumulative private pharma investment at Rs 1.61 lakh-crore since 2021. Faster environmental clearances and single-window approvals shorten project gestation, reinforcing policy impact.
Accelerated Shift of U.S./EU Orders to India Post-Biosecure Act
The 2024 U.S. Biosecure Act restricts federal procurement from firms tied to Chinese biotech entities, compelling originators to diversify supply chains. Indian producers, already running more than 750 U.S. FDA-approved sites, have seen a 50% spike in RFQs and audits since Q3 2024. Cost-per-kg parity favors India; landed quotes sit roughly 20% below Chinese averages for similar quality grades. Regulatory tech-transfer cycles still take 18-24 months, yet India’s dossier experience compresses timelines relative to first-time entrants. As Western sponsors sequence departures from Chinese suppliers, rolling contracts give Indian CDMOs multi-year revenue visibility.
Scale-up in Oncology HPAPI Blocks (Visakhapatnam & Hyderabad)
Visakhapatnam and Hyderabad clusters host specialized containment suites that handle occupational-exposure limits below 1 µg/m³. Divi’s Laboratories added 14,500 m³ of reaction volume at its Kakinada campus, investing Rs 1,200–1,500 crore to serve cytotoxic and antibody-drug conjugate payloads. Telangana now accounts for more than 30% of India’s API exports and has lined up Rs 5,260 crore in additional projects for oncology and specialty injectables. Local vocational colleges offer HPAPI-specific operator training, creating a sticky talent pool. Synergies across solvent recovery, toxic-waste incineration and shared cold-chain logistics further lower cluster costs, making the zone a preferred destination for global sponsors seeking dual-sourcing resilience.
Growth of CRDMO Exports Serving Phase I/II Innovators
Contract research, development and manufacturing organizations (CRDMOs) are on track to expand from USD 3–3.5 billion in 2025 to USD 22–25 billion by 2035. Sponsors outsource medicinal chemistry, process development and clinical supply to reduce fixed cost, benefiting India’s extensive scientific workforce. Laurus Labs opened a 300-scientist R&D center plus a 120-crore fermentation wing under its Laurus Bio arm, adding 62 pipeline molecules. Jubilant Biosys’ purchase of a French R&D hub expands antibody-drug conjugate capabilities and accelerates European regulatory navigation. Integrated “discovery-to-commercial” models shorten molecule timelines and lock in stickier contracts, reinforcing growth momentum.
Restraint Impact Analysis*
| Restraint | (~) % Impact on CAGR Forecast | Geographic Relevance | Impact Timeline |
|---|---|---|---|
| Volatile cost of China-sourced KSMs despite localization | -1.3% | National, with higher impact on import-dependent manufacturers | Short term (≤ 2 years) |
| Persistent compliance gaps at MSME API units (WHO-GMP) | -0.8% | National, concentrated in smaller manufacturing clusters | Medium term (2-4 years) |
| Talent crunch in large-molecule downstream & containment | -0.7% | Regional, primarily affecting Hyderabad and Visakhapatnam clusters | Medium term (2-4 years) |
| Rising energy tariffs eroding margins in West-coast plants | -0.5% | Regional, concentrated in Gujarat and Maharashtra manufacturing hubs | Short term (≤ 2 years |
| Source: Mordor Intelligence | |||
Volatile Cost of China-Sourced KSMs Despite Localization
Even with rising domestic capacity, India imported APIs worth Rs 377 billion in FY 2024, roughly 35% of total demand. A sudden 15–20% price surge in fermentation inputs during early 2025 compressed operating margins that analysts expected to climb to 12–14%. Larger corporates hedge via multi-region contracts and captive intermediate blocks; MSMEs, lacking scale, shutter production or defer capacity upgrades, disrupting supply chains. Delays in full PLI park commissioning mean dependence will persist through 2026, keeping input costs volatile.
Persistent Compliance Gaps at MSME API Units (WHO-GMP)
U.S. FDA warning letters in 2024–25 highlight data-integrity lapses and contamination risks at smaller facilities. Workforce skill deficits aggravate non-compliance; the National Skill Development Corporation flags analytical QC as a chronic shortage. A government extension moves the Schedule M GMP deadline for MSMEs to December 2025, providing breathing room for infrastructure repairs. However, rigid ICH Q12 matrix implementation will require continuous-process-verification data and quality-risk-management records, raising compliance costs. Non-upgraded plants risk market exclusion, nudging consolidation or strategic asset sales.
*Our forecasts treat driver/restraint impacts as directional, not additive. The impact forecasts reflect baseline growth, mix effects, and variable interactions.
Segment Analysis
By Business Model: Outsourcing Accelerates Manufacturing Shift
Merchant suppliers currently contribute under 39% of output but will post a 9.42% CAGR as originators divest legacy synthesis blocks in favor of variable-cost models. The India API market benefits when CDMOs assume regulatory dossier maintenance, validation batches and periodic site audits, freeing sponsor capital for biologics and digital therapeutics launches. Increasingly, innovators bundle early-stage chemistry, toxicology and Phase-I supply under single-vendor contracts that reward scale CDMOs with end-to-end capabilities. Captive manufacture remains viable for high-volume statins or metformin where single-plant economies outweigh transaction overhead. Nevertheless, stricter environmental mandates and inflationary utility tariffs tilt total cost of ownership toward merchant operators. Piramal Pharma Solutions’ USD 80 million sterile-injectables expansion in Kentucky underscores the scalability of outsourced platforms to serve global demand.
Second-order benefits include flexible tech-transfer windows, which help sponsors stagger launch waves across geographies, thereby smoothing utilization at merchant sites. The India API market also sees deeper backward integration among top CDMOs; reactor parks now co-locate with solvent-recovery and effluent incineration to streamline EH&S audits. Conversely, captive plants grapple with latent contamination risks tied to product-mix complexity, compelling larger quality-control staffing and higher cost per batch.


By Synthesis Type: Biotech APIs Drive Next-Generation Growth
Synthetic chemistry still anchors 72.80% of 2025 revenue due to lower capital intensity and well-trodden regulatory precedent. Yet biotech APIs, logging a 9.18% CAGR, will capture incremental value as monoclonal antibodies, recombinant hormones and mRNA vectors reach late-stage trials. Continuous-manufacturing skids and high-throughput crystallizers compress synthetic batch cycles, while fermentation reactors adopt real-time metabolite sensors to boost titers. Laurus Bio’s extra 120-crore fermentation block aims at amino-acid and enzyme intermediates demanded by biologics pipelines.
Regulatory complexity remains higher for biotech APIs, necessitating validated viral-clearance steps and advanced characterization platforms. However, price premiums of 3–5 × versus synthetic actives offset added capex. The India API market diversifies risk as hybrid manufacturers leverage existing small-molecule lines to cushion biotech scale-up volatility. Meanwhile, synthetic producers pursue green catalysts and micro-reactor technology to maintain cost leadership.
By Drug Type: Biosimilar Innovation Reshapes Portfolio Mix
Generics dominate volume as India supplies 40% of global finished doses, relying on a robust portfolio of legacy statins, proton-pump inhibitors and ARVs. Yet an impending USD 63.7 billion patent-expiration wave between 2025 and 2029 unlocks biosimilar APIs with superior margin potential. Branded API programs, though smaller, allow firms to capture lifecycle-management rents through differentiated particle sizes, polymorph control and fixed-dose combinations. Regulatory clarity under U.S. BPCIA and EMA biosimilar guidelines accelerates dossier filings, prompting co-development deals between Indian syntheses houses and Western biotech start-ups.
Portfolio re-balancing reduces exposure to generic price erosion, stabilizing EBITDA even as tender markets squeeze margins. The India API market thus shifts toward a tri-modal revenue model: high-volume generics, mid-scale branded hybrids and low-volume high-value biosimilars. Firms that master all three stand to buffer cyclical swings in any single category.
By Therapeutic Area: Oncology APIs Capture Premium Growth
The cardiovascular segment retained 23.20% of 2025 turnover due to chronic-disease prevalence, yet oncology APIs chart an 8.55% CAGR through 2031 on the back of demand for targeted therapies and cytotoxic payloads. HPAPI isolators and automated charging systems limit personnel exposure, meeting global occupational-health benchmarks. Investment clustering around Andhra Pradesh and Telangana not only reduces supply-chain duplication but also eases import container scheduling for high-risk substances. Anti-infective APIs remain a staple but face margin compression under antibiotic-stewardship initiatives. CNS and respiratory molecules receive renewed attention as mental-health and post-COVID therapy needs widen.
Pricing discipline is stronger in oncology; contracts often include volume commitments and inflation-linked price escalators. Conversely, cardiovascular generics fight for hospital-purchase tenders via lowest-cost bids, intensifying commoditization. The India API market benefits when players balance a high baseline volume from chronic-care molecules with high-margin contributions from oncology launches.
By End-Use: CDMO Growth Transforms Service Models
Pharma and biopharma companies directly procure 75.82% of APIs, but CDMOs/CMOs post an 8.44% growth rate as sponsors prioritize variable-cost structures. Domestic formulation houses supply Jan Aushadhi and Ayushman Bharat schemes, anchoring stable volumes. Export-oriented formulators chase ANDA approvals, further driving compliance and traceability requirements back to API suppliers. CRDMO players bundle discovery, CMC, IND filing and clinical supply, ensuring chemistry-to-clinic continuity. Such stickiness is evident in multi-program “preferred partner” agreements signed in 2024–25, often spanning five-year tenure and option clauses for commercial supply.
End-use dynamics influence asset allocation: GMP kilo labs for early-stage campaigns contrast with multi-ton reactors for chronic generics. The India API market thus witnesses bimodal capex patterns, with CDMOs erecting flexible, multi-product suites while captive plants invest in high-throughput continuous lines for off-patent staples.
By Potency: HPAPI Capabilities Drive Specialization
Low-/medium-potency actives deliver scale but limited margin; high-potency molecules, though only 14.10% of volume, command price premiums exceeding 5 × standard APIs. Divi’s new Kakinada site illustrates capital needs—dedicated HVAC, robotics and waste-neutralizing systems—but also locks in long-term oncology supply pacts with Big Pharma. Small firms struggle to fund such infrastructure, opening acquisition targets for scale players. Regulatory audits impose frequent containment-system re-validation, erecting an operational barrier that entrenches incumbents.
Downstream formulators increasingly prefer single-source HPAPI and fill-finish supply, amplifying integration premiums. The India API market thus rewards those that couple HPAPI blocks with sterile-injectable lines, minimizing cross-site transfer risks.
Geography Analysis
India exported APIs with North America absorbing just over one-third of the tally. The U.S. remains the largest customer given alignment with FDA filings and cost competitiveness. European buyers accelerated vendor-qualification programs in 2024-25, driven by strategic decoupling from China and supported by the EMA’s reliance-route recognition of CDSCO inspections. Proposed U.S. tariffs of 25% on Indian imports introduce price-hike risks, but essential-medicine waivers and supply-chain stickiness temper long-run volume impacts.
Domestically, Andhra Pradesh’s Visakhapatnam-Kakinada corridor focuses on beta-lactams and HPAPIs after Aurobindo’s multi-plant rollout. Telangana’s Genome Valley and upcoming Green Pharma City integrate research campuses, incubators and logistics hubs, promising 500,000 new jobs on a USD 2 billion platform. Gujarat leverages its petrochemical base for solvent supply and port connectivity, housing numerous PLI grant awardees. Himachal Pradesh offers concessional power and tax incentives, attracting hormone and vitamin API lines.
Beyond regulated markets, Africa and Latin America record double-digit import growth, aided by WHO-prequalification of Indian suppliers for donor-funded programs. Bilateral trade pacts underlined at G20 and BRICS forums streamline customs clearance, increasing speed-to-market for anti-malarials and antivirals. Rising middle-class healthcare spend in Indonesia, Egypt and Brazil further diversifies the India API market revenue mix, reducing over-exposure to any single geography. Supply chain resiliency underscores geographic strategy. Coastal clusters establish dedicated container yards and hazmat-compliant cold rooms that shorten port dwelling and cut demurrage. Landlocked clusters prioritize rail sidings and inland container depots. Integration of GST e-way bills with blockchain pilots enhances end-to-end traceability, satisfying overseas audit requirements.
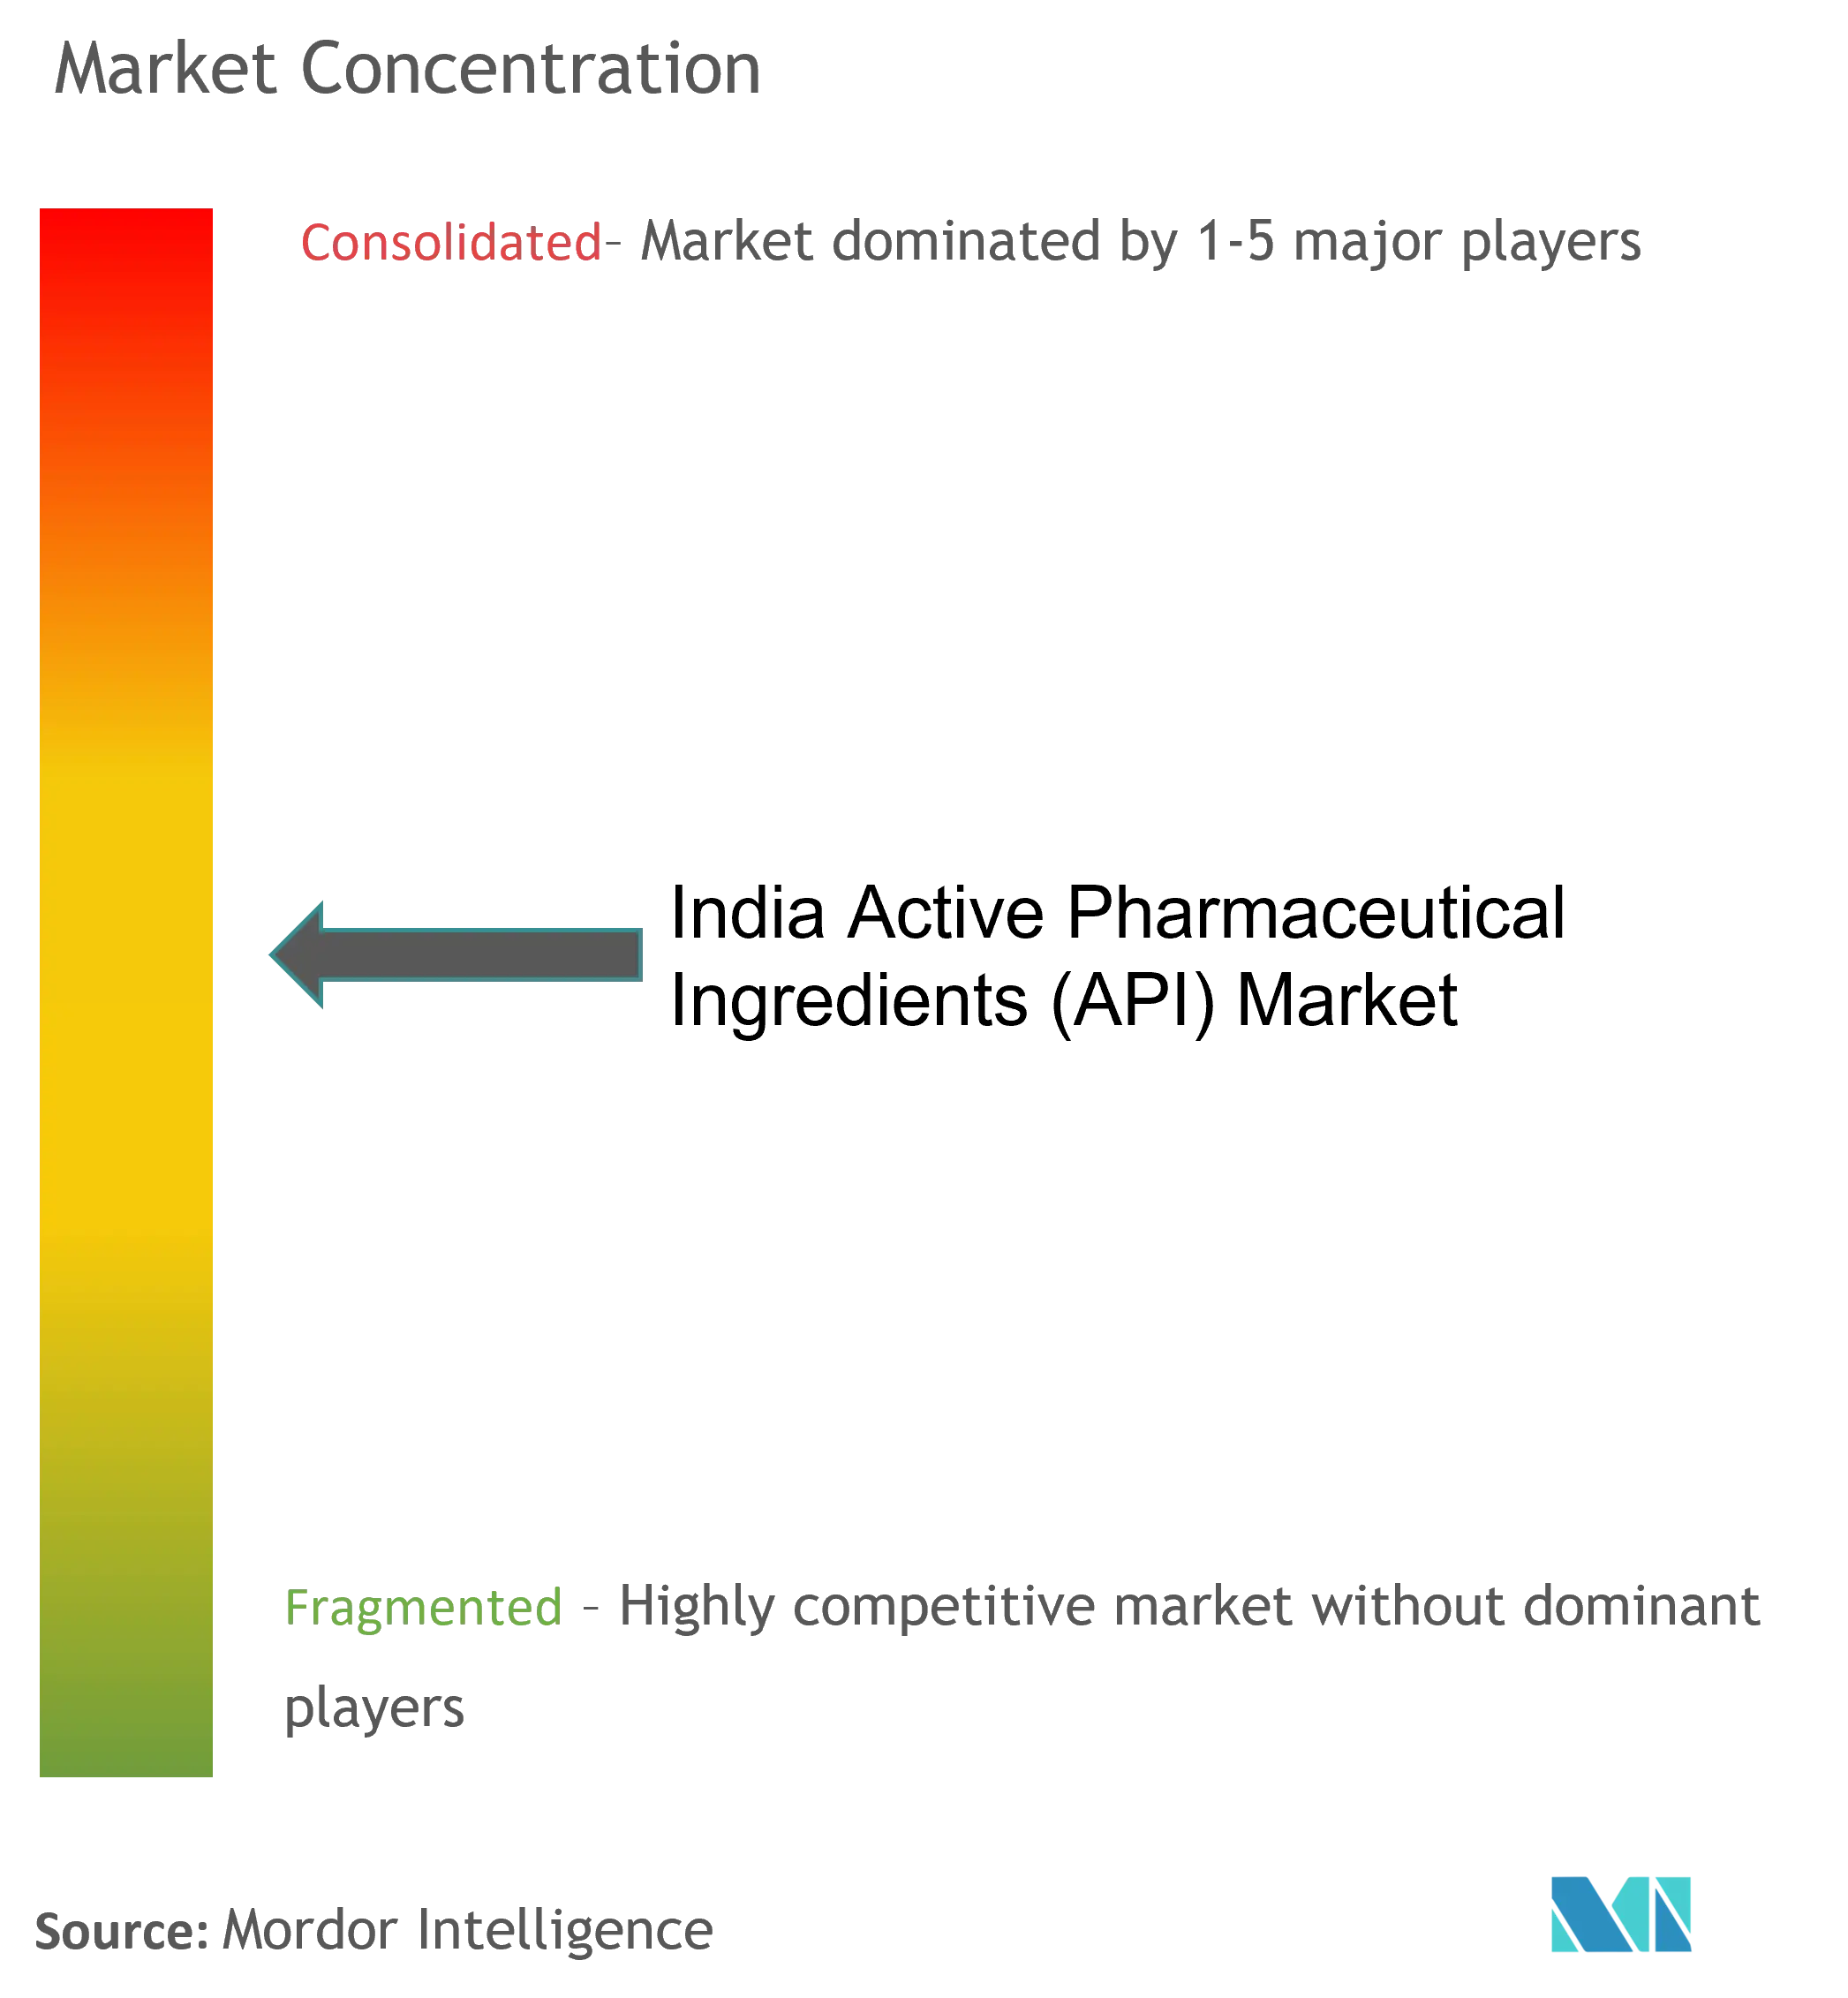
Competitive Landscape
The India API market is moderately fragmented; the top five producers control about half of revenue, while hundreds of MSMEs cater to commodity streams. That configuration yields a concentration score of 6. Larger firms, buoyed by stronger cash flow, funnel investments into continuous reactors, AI-driven analytics and HPAPI suites. Divi’s Laboratories, for instance, raised total reactor capacity above 14,500 m³, solidifying its position in complex molecules. Aurobindo Pharma completed four new plants, including a vertically integrated Pen-G block, to ensure raw-material security.
Strategic moves in 2024-25 illuminate consolidation trends. Jubilant Biosys’ acquisition of a French R&D center extends modality coverage into ADCs and biologics, while Vivek Pharma’s Rs 400 crore injectables plant broadens high-growth therapeutic exposure. Piramal Pharma Solutions’ U.S. expansion leverages proximity to sponsors seeking post-Biosecure dual sourcing.
Technology adoption drives differentiation. Plants deploying inline spectroscopy and digital twins report first-pass yield improvements, consolidating customer loyalty. Patents filed around green-chemistry processes and flow-photochemistry suggest a pivot toward sustainable competitive moats. Compliance remains a gatekeeper; FDA Establishment Inspection Reports with voluntary-action-indicated status confer credibility, enabling premium pricing. Those failing to meet Schedule M revisions face capital drain or acquisition by scale players, accelerating consolidation.
Intellectual-property and regulatory landscapes further shape rivalry. Firms owning DMFs across multi-generation synthetic routes lock in legacy business. Meanwhile, suppliers investing in modular continuous facilities can reconfigure lines quickly, grabbing short-notice orders. The India API industry therefore balances cost leadership with specialization, and the coming years will likely witness mergers aimed at domain expansion and compliance pooling.
India Active Pharmaceutical Ingredients (API) Industry Leaders
Aurobindo Pharma
Lupin Ltd
Viatris Inc.
Sun Pharmaceutical Industries Ltd
Teva Pharmaceutical Industries Ltd
- *Disclaimer: Major Players sorted in no particular order

Recent Industry Developments
- July 2022: Piramal Pharma Limited's Pharma Solutions business, a leading Contract Development and Manufacturing Organization (CDMO), launched a new active pharmaceutical ingredient (API) plant at the company's site in Aurora, Ontario.
- March 2022: India started the local manufacturing of 35 active pharmaceutical ingredients, for which the country was 90% dependent on the import activities from China under the production-linked incentives (PLI) scheme.


India Active Pharmaceutical Ingredients (API) Market Report Scope
An active pharmaceutical ingredient (API) is a part of any drug that produces its effects. Some drugs, such as combination therapies, have multiple active ingredients to treat different symptoms or act in different ways. They are produced using highly technological industrial processes, both during the research and development and the commercial production phase.
The India Active Pharmaceutical Ingredients (API) Market is Segmented by Business Mode (Captive API and Merchant API), Synthesis Type (Synthetic and Biotech), Drug Type (Generic and Branded), and Application (Cardiology, Oncology, Pulmonology, Neurology, Orthopedic, Ophthalmology, and Other Applications). The report offers the value (in USD billion) for the above segments.
By Business Model
| Captive API |
| Merchant / Contract API |
By Synthesis Type
| Synthetic API |
| Biotech API |
By Molecule Size
| Small-Molecule |
| Large-Molecule / Biologic |
By Potency
| High-Potency API |
| Low/Medium Potency API |
By Therapeutic Area
| Oncology |
| Cardiovascular |
| Infectious Diseases |
| Metabolic Disorders |
| CNS & Neurology |
| Respiratory |
| Others |
By End-User
| Pharma & Biopharma Companies |
| CDMOs / CMOs |
| CROs & Academia |
| Export-Oriented Formulators |
| CRDMOs / CDMOs |
| By Business Model | Captive API |
| Merchant / Contract API | |
| By Synthesis Type | Synthetic API |
| Biotech API | |
| By Molecule Size | Small-Molecule |
| Large-Molecule / Biologic | |
| By Potency | High-Potency API |
| Low/Medium Potency API | |
| By Therapeutic Area | Oncology |
| Cardiovascular | |
| Infectious Diseases | |
| Metabolic Disorders | |
| CNS & Neurology | |
| Respiratory | |
| Others | |
| By End-User | Pharma & Biopharma Companies |
| CDMOs / CMOs | |
| CROs & Academia | |
| Export-Oriented Formulators | |
| CRDMOs / CDMOs |


Key Questions Answered in the Report
How big is the India Active Pharmaceutical Ingredients (API) Market?
The India Active Pharmaceutical Ingredients (API) Market size is expected to reach USD 15.28 billion in 2026 and grow at a CAGR of 7.74% to reach USD 22.18 billion by 2031.
What is the current India Active Pharmaceutical Ingredients (API) Market size?
In 2026, the India Active Pharmaceutical Ingredients (API) Market size is expected to reach USD 15.28 billion.
Who are the key players in India Active Pharmaceutical Ingredients (API) Market?
Aurobindo Pharma, Lupin Ltd, Viatris Inc., Sun Pharmaceutical Industries Ltd and Teva Pharmaceutical Industries Ltd are the major companies operating in the India Active Pharmaceutical Ingredients (API) Market.
What years does this India Active Pharmaceutical Ingredients (API) Market cover, and what was the market size in 2025?
In 2025, the India Active Pharmaceutical Ingredients (API) Market size was estimated at USD 14.18 billion. The report covers the India Active Pharmaceutical Ingredients (API) Market historical market size for years: 2019, 2020, 2021, 2022, 2023, 2024 and 2025. The report also forecasts the India Active Pharmaceutical Ingredients (API) Market size for years: 2026, 2027, 2028, 2029, 2030 and 2031.
Page last updated on:


