Hearables Market Size and Share
Market Overview
| Study Period | 2020 - 2031 |
|---|---|
| Market Size (2026) | USD 62.22 Billion |
| Market Size (2031) | USD 107.10 Billion |
| Growth Rate (2026 - 2031) | 11.47% CAGR |
| Fastest Growing Market | Asia Pacific |
| Largest Market | North America |
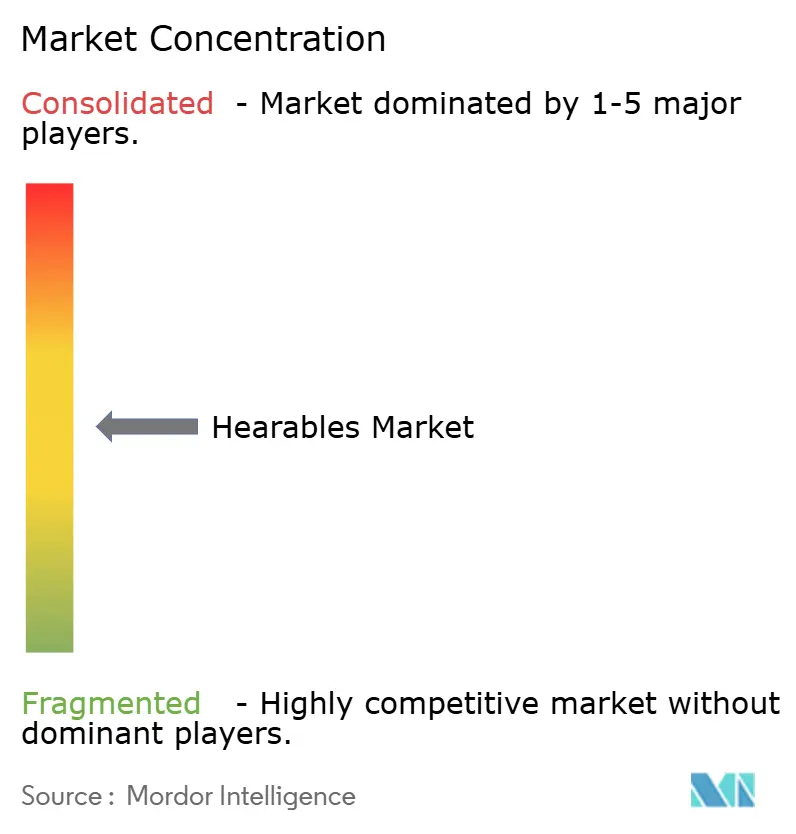
| Market Concentration | Medium |
Major Players*Disclaimer: Major Players sorted in no particular order Image © Mordor Intelligence. Reuse requires attribution under CC BY 4.0. | |
Hearables Market Analysis by Mordor Intelligence
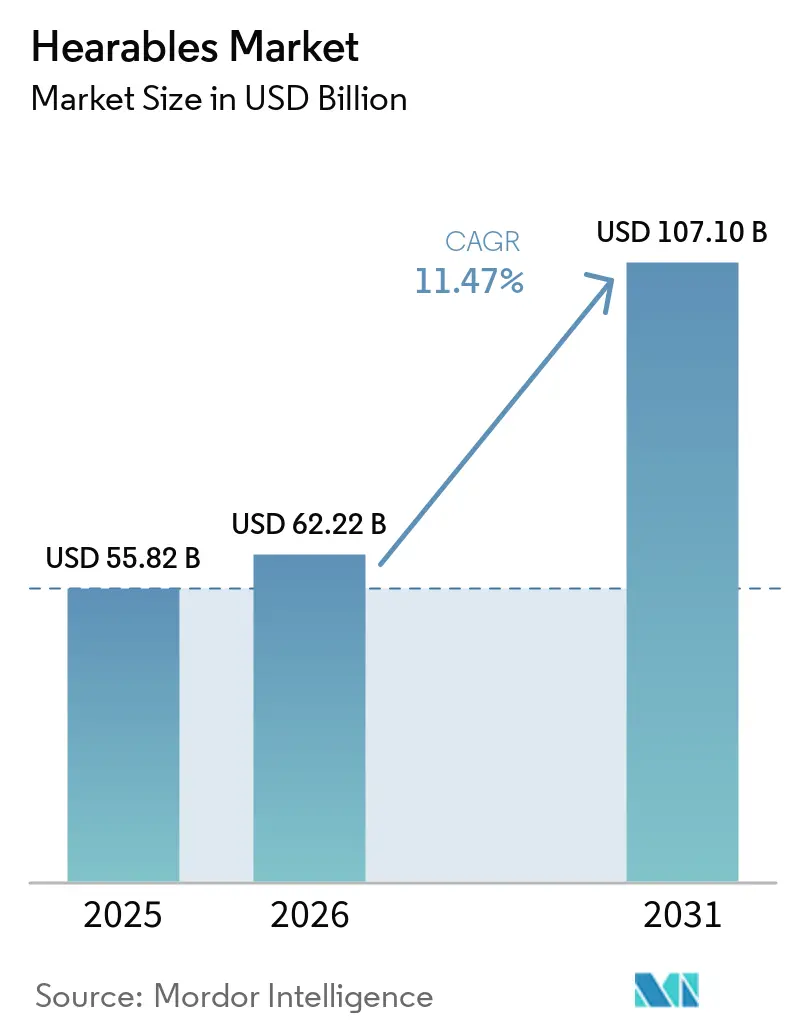
The hearables market size is expected to grow from USD 55.82 billion in 2025 to USD 62.22 billion in 2026 and is forecast to reach USD 107.1 billion by 2031 at 11.47% CAGR over 2026-2031. Steady demand for premium audio, the integration of over-the-counter (OTC) hearing‐aid functionality, and faster component innovation anchor that growth. Regulatory tailwinds, notably the FDA pathway that let Apple certify AirPods Pro 2 as a self-fitting hearing aid at a mainstream USD 250 price point, legitimized hearables as medical devices and unlocked latent demand among the 49.5 million U.S. adults with perceived mild-to-moderate hearing loss. Adoption also rises as Bluetooth LE Audio improves battery life while enabling new broadcast-audio services. At the same time, spatial-computing headsets now treat hearables as mandatory companions for immersive experiences, pushing developers to embed biometric sensors, real-time translation, and AI noise-filtering in a single form factor.
Key Report Takeaways
- By product type, true wireless stereo (TWS) earbuds led with 54.85% revenue share in 2025, while hearing aids are advancing at a 12.21% CAGR to 2031.
- By technology, wired solutions retained 68.10% of hearables market share in 2025, but wireless devices are expanding at a 12.74% CAGR through 2031.
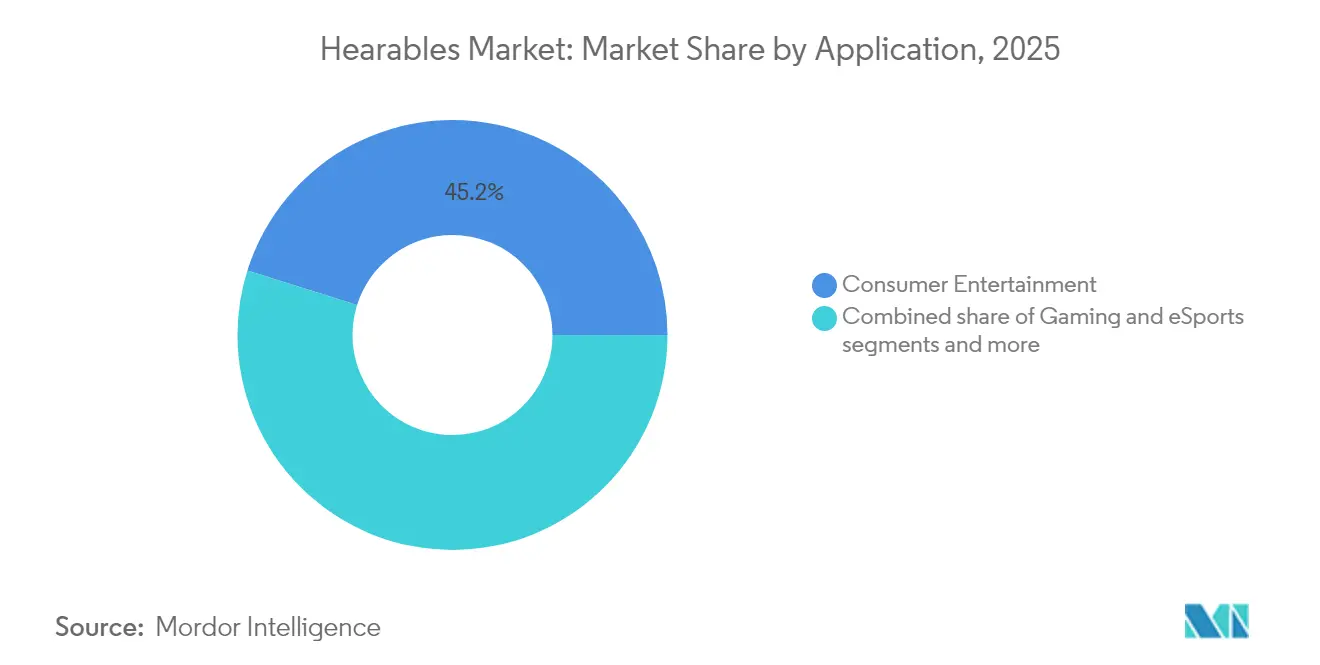
- By application, entertainment accounted for 45.15% of the hearables market size in 2025; healthcare and wellness monitoring is growing fastest at 11.55% CAGR.
- By distribution channel, offline retail held 61.00% share of the hearables market size in 2025, whereas online platforms are recording the highest projected CAGR at 13.06% to 2031.
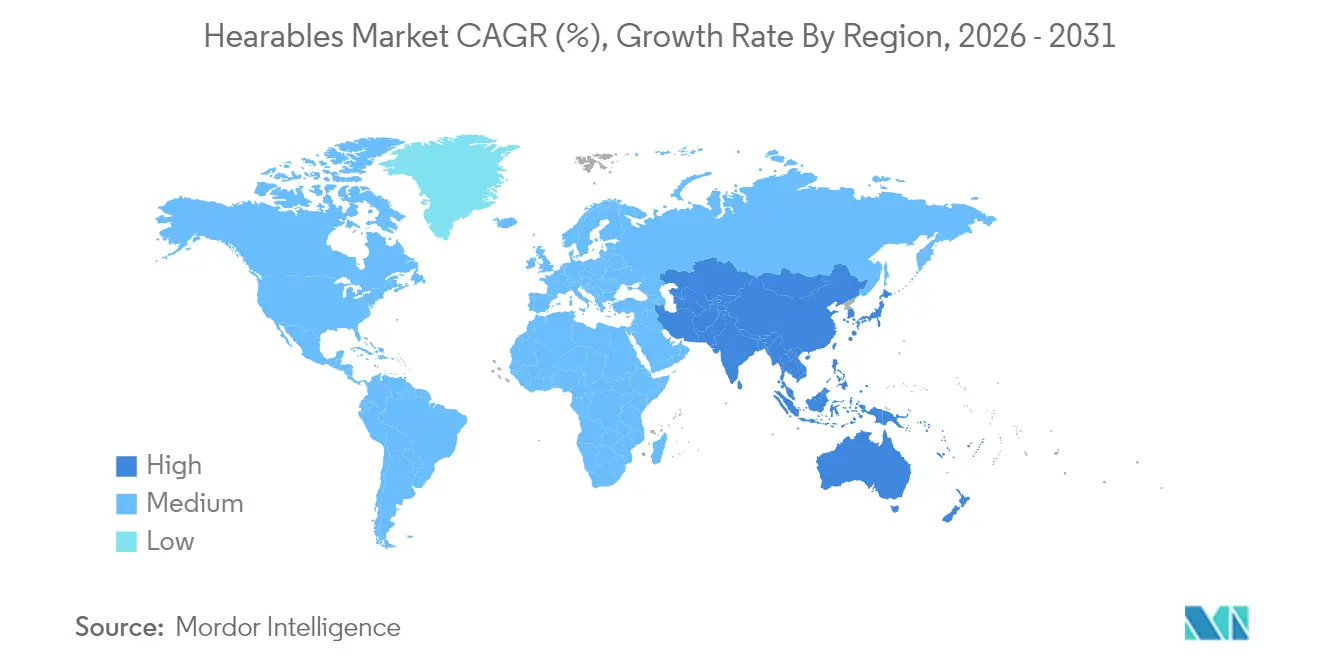
- By geography, North America commanded 37.30% of hearables market share in 2025, while Asia-Pacific is on track for a 11.92% CAGR through 2031.
Note: Market size and forecast figures in this report are generated using Mordor Intelligence’s proprietary estimation framework, updated with the latest available data and insights as of 2026.
Global Hearables Market Trends and Insights
Drivers Impact Analysis*
| Driver | (~) % Impact on CAGR Forecast | Geographic Relevance | Impact Timeline |
|---|---|---|---|
| Smartphone and streaming boom | +2.1% | Global with APAC leading adoption | Medium term (2–4 years) |
| Wire-to-wireless migration (TWS) | +2.8% | North America and EU mature, APAC accelerating | Short term (≤ 2 years) |
| OTC hearing-aid regulation unlocks volume | +1.9% | North America primary, EU following | Medium term (2–4 years) |
| Bluetooth LE Audio enables broadcast-as-a-service | +1.4% | Global, enterprise applications first | Long term (≥ 4 years) |
| In-ear bio-sensing for insurer wellness programs | +1.7% | North America and EU regulatory favorable | Long term (≥ 4 years) |
| Spatial-computing headsets rely on hearables | +1.2% | North America and APAC tech hubs | Long term (≥ 4 years) |
| Source: Mordor Intelligence | |||
Smartphone and streaming boom
High-resolution streaming services align with AI-powered personalization features that adjust audio profiles in real time, driving repeat purchases as users value tailored listening experiences. Dolby Atmos integration inside mid-tier earbuds broadens spatial audio to the mass market, encouraging frequent upgrades. Bluetooth headphone shipments in China reached 55.4 million units in H1 2024, up 20.8% year over year, underscoring APAC’s leadership in entertainment-driven demand. Edge-AI noise isolation demonstrated at CES 2025 further cements smartphones as the control hub for hearables. Continuous improvements in codec efficiency shorten time-to-stream, making the hearables market a default accessory category for video and music platforms. Manufacturers now embed custom voice assistants to tighten ecosystem lock-in and raise switching costs.
Wire-to-wireless migration (TWS)
TWS shipments grew 18% year over year in Q1 2025 after tariff concerns prompted inventory build-ups. Second-wave adoption focuses on open-ear designs that preserve situational awareness; the segment expanded 68.2% in Q4 2023 yet still forms only 2.9% of total units, signaling runway for growth. NTT’s wideband active-noise-control prototype widens usable frequencies for open-ear products, allowing fitness and outdoor use cases previously limited by low-bass performance[1]NTT Corporation, “Wideband Active Noise Control Technology,” group.ntt. Competitive differentiation is shifting from mere battery life to value-added services such as multilanguage translation and fitness tracking. Premium brands explore ultra-low-latency modes that cut end-to-end delay below 20 milliseconds, enabling mobile gaming without wired headsets. Hardware advancements dovetail with declining component prices, making wireless versions price-parity alternatives to legacy wired SKUs.
OTC hearing-aid regulation unlocks volume
FDA rules introduced in 2022 allowed consumer brands to enter the regulated hearing-care arena, reducing average selling prices to one-quarter of audiologist-fitted devices. Only 2% of eligible U.S. adults had bought an OTC hearing aid in the preceding six months, but the upcoming product cycles target that underserved cohort through self-fitting apps and remote counseling. Apple validated the approach when AirPods Pro 2 obtained medical clearance, proving that mainstream user interfaces can satisfy clinical requirements. The regulatory shift entices smartphone and TWS makers to bundle medical-grade amplification, which threatens incumbent hearing-aid companies reliant on clinic-based channels. Fashion-forward form factors such as hearing-aid glasses appeal to consumers who avoid traditional designs for aesthetic reasons, widening the accessible pool.
Bluetooth LE Audio enables broadcast-as-a-service
Auracast allows venues to beam synchronized audio to any compatible earbud, transforming theaters, airports, and conference halls into pay-per-stream environments. Lower power draw extends listening time by 25–30% on current battery footprints, freeing headroom for additional sensors. Venues foresee new revenue streams from tiered access—basic announcements free, premium commentary paid—while device makers can upsell superior antenna design for cleaner reception. Early deployments in North American sports arenas target crowd engagement, whereas European airports apply the technology to accessibility mandates. In hybrid workplaces, corporations test Auracast for on-demand translation feeds during large meetings, reducing hardware rental budgets.
Restraints Impact Analysis*
| Restraint | (~) % Impact on CAGR Forecast | Geographic Relevance | Impact Timeline |
|---|---|---|---|
| Battery life and thermal limits | -1.8% | Global, particularly affecting premium segments | Short term (≤ 2 years) |
| Hearing-safety and regulatory SPL limits | -1.2% | EU strict, North America moderate, APAC variable | Medium term (2–4 years) |
| MEMS mic and cobalt supply volatility | -1.5% | Global with APAC manufacturing concentration risk | Short term (≤ 2 years) |
| Codec / ANC patent-litigation overhang | -0.9% | Global with North America and EU litigation centers | Medium term (2–4 years) |
| Source: Mordor Intelligence | |||
Battery life and thermal limits
Expanding feature sets in AI-ready hearables intensify power drain and heat, squeezing the thermal envelope of devices that must stay skin-contact safe for hours. Solid-state speakers using 1 mm piezoelectric diaphragms from xMEMS promise higher efficiency and cut heat but remain early-stage[2]WHO, “Make Listening Safe Initiative,” who.int. Brand roadmaps now trade off high-resolution microphone arrays against battery depth, pushing suppliers to deliver denser, cooler chemistries. Designers opt for asymmetric earbud batteries, shifting mass for comfort, but production yields add cost pressures. Thermal throttling algorithms intervene during intensive translation sessions, occasionally degrading user experience. Over time, enhancements in power-management silicon are likely to offset part of the constraint yet not fully eliminate it.
Hearing-safety and regulatory SPL limits
The WHO safe-listening recommendation restricts daily exposure at 85 dB for eight hours, directly capping maximum volumes in EU-bound models. Gamers and commuters who override default limits strain brand liability policies; firms respond with predictive algorithms that lower peaks instead of imposing blanket caps. Draft EU regulation may mandate real-time risk alerts in 2026, forcing firmware updates across existing fleets. Volume limitation also conflicts with live-monitor mode for musicians, who demand ≥ 102 dB headroom. The compliance matrix across more than 30 jurisdictions elevates certification cost and elongates launch cycles, particularly for smaller entrants that lack regional testing labs.
*Our forecasts treat driver/restraint impacts as directional, not additive. The impact forecasts reflect baseline growth, mix effects, and variable interactions.
Segment Analysis
By Product Type: TWS Dominance Faces Healthcare Disruption
Earbuds and TWS devices captured 54.85% of hearables market share in 2025, fueled by annual refresh cycles and branded ecosystem pull. Feature velocity around spatial audio and biometric sensing keeps average selling prices stable even as unit volumes rise. Hearing aids remain the fastest-expanding category at 12.21% CAGR as regulatory change unlocks a self-fitting addressable population overdue for intervention. Consumers increasingly treat TWS as primary communication nodes, pushing traditional over-ear headsets toward specialized niches such as enterprise contact centers and esports.
The line between TWS and medical gear continues to blur after FDA approval turned AirPods Pro 2 into a class-II device, making self-fitting amplification a checkbox feature. Smart hearing-protection devices integrate environmental microphones that compress dangerous peaks yet pass through conversation, appealing to industrial safety officers. This convergence stimulates accessory ecosystems—custom eartips, charging jewelry, and acoustic filters—that add margin while extending brand presence. Category boundaries therefore reposition around software capabilities rather than physical form, redefining competitive segments inside the broader hearables market.


By Technology: Wireless Acceleration Despite Wired Resilience
Wired models still account for a 68.10% hearables market size share because professional audio users prefer deterministic latency and power autonomy. However, Bluetooth LC3 codecs now deliver sub-30 millisecond delays, eroding that advantage for many workflows. Wireless shipments will continue to expand at a 12.74% CAGR as manufacturers combine improved antenna tuning with battery chemistries that add 20% runtime without enlarging housings.
Hybrid cabled-plus-Bluetooth designs emerge for broadcasters needing fallback assurance against congested spectrums. Cost sensitivity in parts of Latin America and Africa keeps wired SKUs relevant, yet even budget smartphones now drop 3.5 mm jacks, nudging users toward wireless bundles. Enterprise call centers migrate quickly because wireless units simplify sanitization protocols; hospital tele-rounding adopts similar logic. With every chipset generation, BOM costs decline, letting value brands match wired price points and accelerate the wire-to-wireless substitution inside the hearables market.
By Application: Entertainment Leads While Healthcare Surges
Entertainment commanded 45.15% of the hearables market size in 2025 as music streaming, short-form video, and mobile gaming converged around personalized audio profiles. Spatial audio libraries from major studios encourage consumers to upgrade hardware, with multi-axis head tracking driving a new replacement wave. Gaming headsets require latency under 20 milliseconds and precise positional cues, letting vendors charge premiums for custom antennas and tuned drivers.
Healthcare and wellness monitoring represent the fastest-growing application at 11.55% CAGR as in-ear photoplethysmography and temperature sensors feed insurer wellness dashboards. Neuro-adaptive earbuds incorporating EEG arrays adjust soundscapes for concentration enhancement, attracting enterprises that offer focus-boost stipends. Enterprise and call-center segments prioritize noise suppression integrated with unified communications platforms, stimulating demand for AI beamforming microphones. Industrial safety mandates accelerate uptake of smart ear defenders that monitor noise-dose budgets in real time.
By Distribution Channel: Online Momentum Challenges Offline Dominance
Offline retail retained 61.00% of hearables market share in 2025 because store trials let shoppers judge fit and audio signature. Big-box chains dedicate endcaps to TWS demos, while audiology clinics upsell premium earmolds. Yet online sales grow 13.06% CAGR as virtual try-on tools map ear geometry for best-fit tips and as no-questions-asked returns reduce risk.
OTC hearing aids especially benefit from direct-to-consumer fulfilment: remote tuning apps replace office visits, and bundled telehealth subscriptions offset channel margin loss. COVID-19 normalized buying mid-tier audio products sight unseen, and that habit persists among urban millennial cohorts. Brands experiment with home-demo kits that ship multiple sizes with prepaid returns, blending web convenience with tactile assurance. These hybrid models lower inventory exposure for retailers and expand geographic reach for niche manufacturers.
Geography Analysis
North America leads with 37.30% hearables market share in 2025, anchored by high disposable income, early OTC legislation, and a mature streaming infrastructure. FDA clearance for consumer-grade hearing amplification accelerated category convergence, while insurance pilots covering wellness earbuds stimulate volume. U.S. carriers bundle premium earbuds in device-upgrade programs, sustaining replacement cycles. Canada mirrors U.S. patterns at lower scale, and Mexico benefits from cross-border logistics to shorten launch lags. TWS makers treat the region as their first stop for software-heavy upgrades because regulatory clarity around Bluetooth frequencies simplifies rollout. E-commerce penetration above 75% of electronics sales expedites direct-to-consumer hearing aid adoption.
Asia-Pacific is the fastest-growing territory, projected at a 11.92% CAGR through 2031. China’s smart-wearable output is forecast to hit 800 million units worldwide in 2025, and domestic firms like Xiaomi drive aggressive pricing that pulls in emerging middle-class buyers. India’s market remains fragmented; local champion boAt faces competition from OnePlus and Redmi, fostering rapid feature trickle-down. Japan anchors high-end demand with audiophile preferences, while South Korean giants leverage display and memory ecosystems to bundle hearables alongside flagship phones. Australian consumers show strong uptake of open-ear sports designs suited to outdoor lifestyles. Across the region, government programs subsidize hearables for elder-care monitoring, intertwining healthcare and consumer budgets.
Europe offers a sizable yet highly regulated landscape. GDPR curbs unfettered biometric data collection, pushing brands to invest in on-device AI rather than cloud analytics. Germany, France, and the United Kingdom dominate volume; they favor eco-friendly packaging and reparability, driving modular earbud concepts. The EU’s pending safe-listening directive may mandate adaptive volume limiting, prompting firmware redesigns. Nordic markets test premium subscription bundles that pair hardware leasing with software upgrades, while Southern Europe leans on installment plans. Brexit introduces customs friction that lengthens lead times into the U.K., but the region remains attractive for luxury audio, with Italy hosting flagship concept stores. Collectively, these dynamics compel nuanced go-to-market tactics across the hearables market.

Competitive Landscape
Competition intensifies as consumer-electronics titans challenge legacy audio giants and niche health-tech entrants. Apple holds 23.3% unit share with 18.2 million TWS shipments in Q1 2025, leveraging vertical control from silicon to services. Xiaomi shipped 9 million units in the same quarter by emphasizing high-value specifications at sub-USD 100 price points. Samsung’s Galaxy Buds line keeps pace via cross-device ecosystem features that lock users into Galaxy phones and watches. Emerging brand boAt thrives in India by localizing pop-culture collaborations and undercutting imports on price.
Traditional hearing-aid vendors pivot toward AI personalization: Starkey’s Edge-AI platform converts ambient cues into adaptive gain changes and voice assistance, expanding beyond clinical users. Consolidation reshapes supply chains; Syntiant paid USD 150 million for Knowles’ MEMS microphone unit to secure sensor IP critical for low-power voice wake-up. Bose snapped up McIntosh Group to enter luxury audio wearables, signaling cross-pollination between high-fidelity heritage and lifestyle segments. Component concentration remains a strategic risk: Hurricane Helene stressed Spruce Pine’s quartz supply for semiconductors, reminding brands that single-point failures impact silicon lead times.
IP litigation over codecs and active-noise-cancellation continues; Meta filed patents for adaptive environmental awareness aiming to pre-empt infringement challenges. Start-ups test neuro-adaptive algorithms yet often license core beamforming IP from few holders, reinforcing royalty chains. Competitive edge is shifting from acoustics to software ecosystems—voice assistants, health dashboards, and subscription content—where switching barriers rise with every firmware update. Overall, the hearables market displays moderate concentration but fast strategy turnover as AI, healthcare, and spatial computing intersect.
Hearables Industry Leaders
Demant A/S
WS Audiology A/S
Starkey Hearing Technologies
Sony Corporation
Apple Inc. (Incl Beats Electronics)
- *Disclaimer: Major Players sorted in no particular order

Recent Industry Developments
- June 2025: Starkey Hearing Technologies launches Edge-AI hearing aid platform with personal-assistant features.
- May 2025: Apple ships 18.2 million TWS units in Q1 2025, retaining 23.3% share as global TWS volume hits 78 million.
- April 2025: Eargo and Hearx merge, backed by USD 100 million to accelerate OTC rollout.
- January 2025: EssilorLuxottica acquires Pulse Audition to integrate AI hearing tech into eyewear.


Research Methodology Framework and Report Scope
Market Definitions and Key Coverage
Our study defines the hearables market as in-ear or over-ear wearable devices that combine an audio driver, an on-board wireless chipset (Bluetooth, LE Audio, or DECT), and optional biometric or voice-assistant functions. The field therefore spans true-wireless stereo earbuds, smart call-center headsets, and both prescription and over-the-counter hearing aids, all valued at the manufacturer level.
Scope exclusion: Implantable cochlear systems and purely analog wired headphones without wireless or sensing capability are not covered.
Segmentation Overview
- By Product Type
- Headsets (Mono, Stereo)
- Earbuds / TWS
- Hearing Aids (Prescription, OTC)
- Smart Hearing-Protection Devices
- By Technology
- Wired
- Wireless
- By Application
- Consumer Entertainment
- Gaming and eSports
- Enterprise / Call-Center
- Healthcare and Wellness Monitoring
- Other Applications
- By Distribution Channel
- Online
- Offline
- By Geography
- North America
- United States
- Canada
- Mexico
- Europe
- Germany
- United Kingdom
- France
- Italy
- Spain
- Rest of Europe
- Asia-Pacific
- China
- Japan
- India
- South Korea
- Australia
- Rest of Asia-Pacific
- South America
- Brazil
- Argentina
- Rest of South America
- Middle East and Africa
- Middle East
- Saudi Arabia
- United Arab Emirates
- Turkey
- Rest of Middle East
- Africa
- South Africa
- Egypt
- Nigeria
- Rest of Africa
- Middle East
- North America
Detailed Research Methodology and Data Validation
Primary Research
We interviewed audio-silicon suppliers, specialty retailers, ENT clinicians, and logistics partners across North America, Europe, and Asia-Pacific to validate average selling prices, attach-rate shifts, and policy impacts before locking model assumptions.
Desk Research
Mordor analysts extracted volume and price signals from tier-1 public sources such as WHO hearing-loss dashboards, ITU mobile-broadband statistics, Bluetooth SIG certification logs, FDA and EU MDR filings on OTC aids, and Consumer Technology Association shipment reports. Company 10-Ks, customs intelligence from Volza, and news archives in Dow Jones Factiva refined regional splits and channel mix. The sources named are illustrative; many additional datasets were reviewed for corroboration and clarification.
Market-Sizing & Forecasting
A top-down build links smartphone installed base, Bluetooth ear-wear penetration, hearing-impairment prevalence, and average replacement cycles to value demand, which is then checked against sampled OEM revenues and distributor inventories. Variables such as ASP erosion, OTC aid uptake, disposable-income growth, battery-cell cost trends, and shipment seasonality feed a multivariate regression with ARIMA overlays for 2026-2030 projections. Bottom-up gaps, for instance, in independent clinic sales, are bridged with targeted primary estimates.
Data Validation & Update Cycle
Outputs undergo variance tests, peer review, and a refresh loop triggered annually or when material events (e.g., new FDA rules) arise. A final analyst sweep ensures clients receive the latest calibrated view.
Why Mordor's Hearables Baseline Commands Reliability
Published estimates often diverge; scope choices, exchange-rate timing, and refresh cadence drive most gaps. By merging regulated hearing-aid revenue with consumer earbuds and updating inputs each quarter, we've created what we believe is the most even-handed baseline.
Key gap drivers include the exclusion of medical-grade devices by some studies, reliance on retail-only revenue by others, and the use of static 2022 FX assumptions, whereas our model checks figures against live shipment and tariff data before sign-off.
Benchmark comparison
| Market Size | Anonymized source | Primary gap driver |
|---|---|---|
| USD 55.82 B (2025) | Mordor Intelligence | - |
| USD 30.22 B (2024) | Global Consultancy A | Omits OTC aids; limited geography weighting; top-OEM ASP sample only |
| USD 42.0 B (2024) | Trade Journal B | Retail revenue snapshot; static FX rates; update cycle > 3 yrs |
The comparison shows that our balanced scope, dynamic currency treatment, and shorter refresh cycle produce a figure decision-makers can trace back to transparent variables and repeatable steps.


Key Questions Answered in the Report
What is the current hearables market size and projected growth?
The hearables market size is USD 62.22 billion in 2026 and is projected to reach USD 107.1 billion by 2031, translating to an 11.47% CAGR.
Which segment is growing fastest within the hearables market?
Hearing aids are expanding fastest at a 12.21% CAGR thanks to FDA-enabled OTC regulations that cut prices and open new distribution channels.
Why are wireless hearables overtaking wired models?
Advances in Bluetooth codecs, longer battery life, and disappearing 3.5 mm jacks drive consumer preference toward wireless, which is growing at a 12.74% CAGR.
How has regulation affected the hearables market?
FDA clearance for OTC hearing aids allowed consumer brands to sell self-fitting devices, enlarging the addressable U.S. market of 49.5 million adults with hearing loss.
Which region will add the most hearables revenue by 2031?
Asia-Pacific will add the most revenue due to 11.92% CAGR growth underpinned by massive Chinese and Indian demand and regional manufacturing scale.
What are the biggest technical hurdles for future hearables?
Battery life and thermal limits remain the primary hurdles, as AI processing and sensor arrays strain power budgets and heat dissipation capacity.
Page last updated on:


