Healthcare Payment Integrity Market Size and Share
Market Overview
| Study Period | 2023 - 2031 |
|---|---|
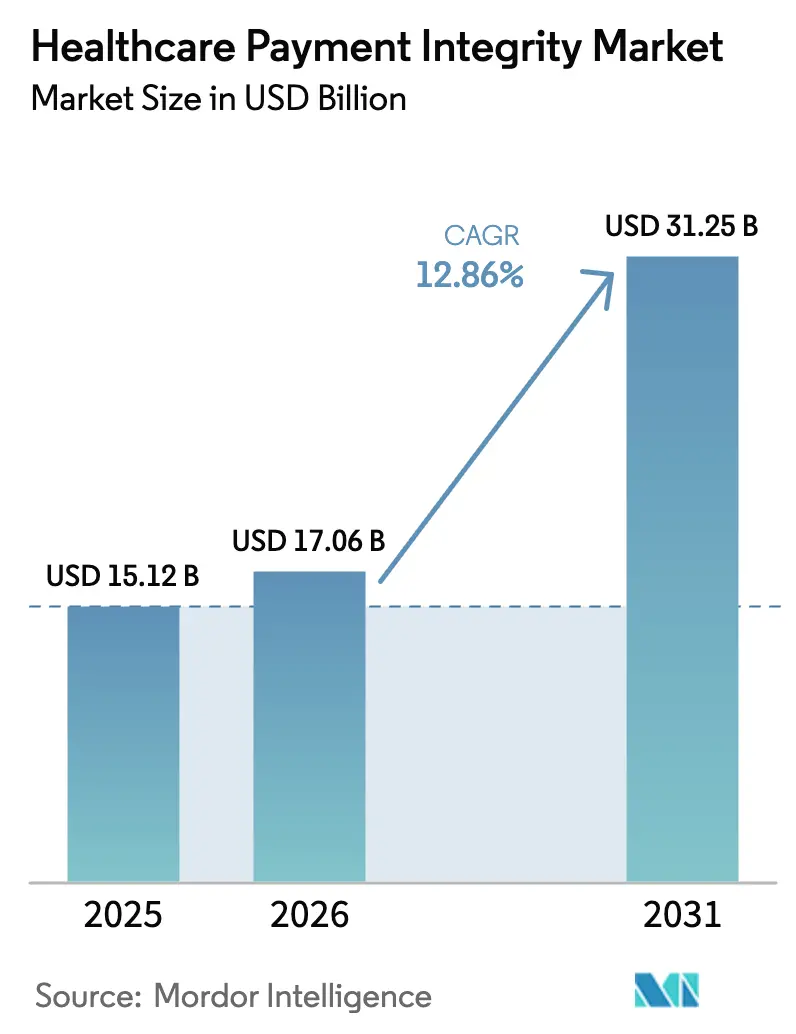
| Market Size (2026) | USD 17.06 Billion |
| Market Size (2031) | USD 31.25 Billion |
| Growth Rate (2026 - 2031) | 12.86% CAGR |
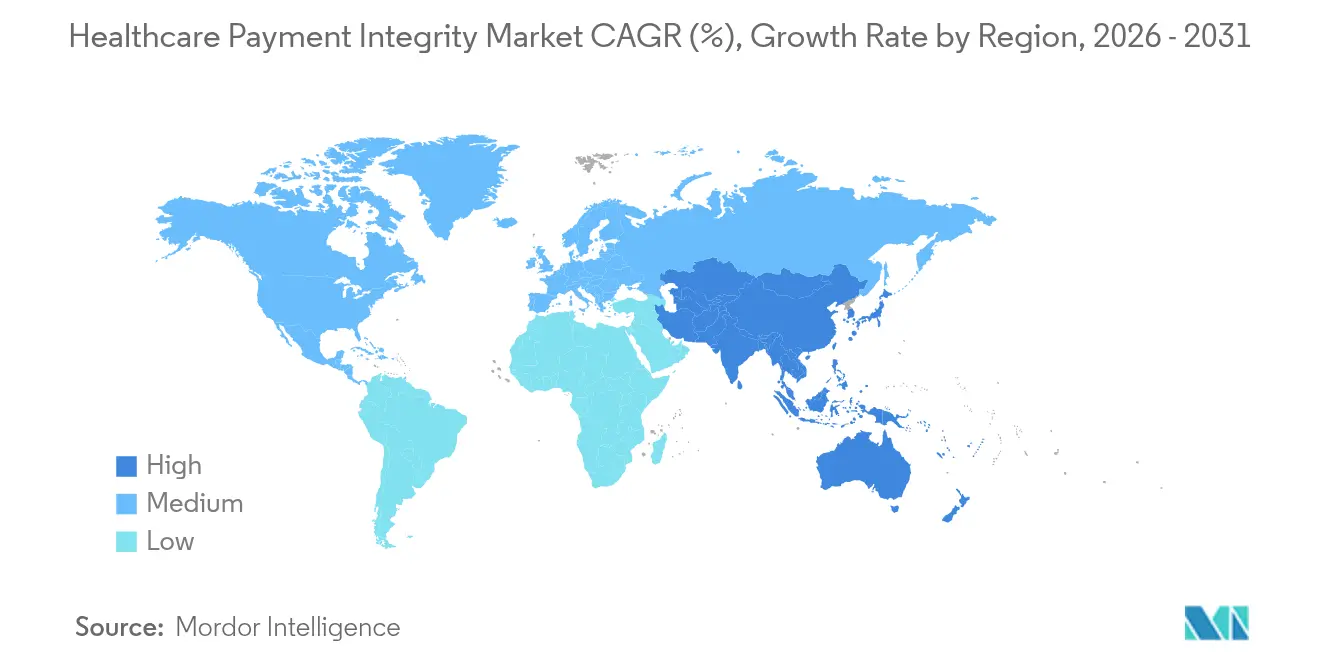
| Fastest Growing Market | Asia Pacific |
| Largest Market | North America |
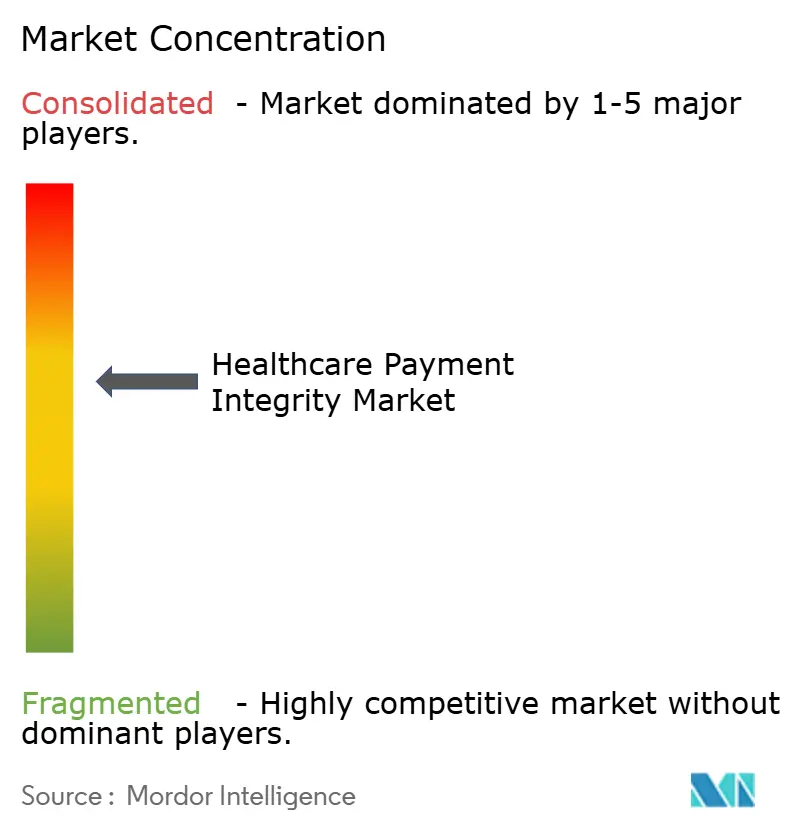
| Market Concentration | Medium |
Major Players *Disclaimer: Major Players sorted in no particular order Image © Mordor Intelligence. Reuse requires attribution under CC BY 4.0. | |
Healthcare Payment Integrity Market Analysis by Mordor Intelligence
The healthcare payment integrity market size was valued at USD 15.12 billion in 2025 and estimated to grow from USD 17.06 billion in 2026 to reach USD 31.25 billion by 2031, at a CAGR of 12.86% during the forecast period (2026-2031). Stricter regulatory oversight, wasteful expenditure that still equals a 6.26% claims-error rate, and the widening use of AI to spot revenue leakage keep the Healthcare Payment Integrity market on a steep growth curve. Cloud-based deployment, which already processes more than 60% of claims, lets health plans retire costly mainframes that add USD 20 billion in annual administrative expense. Providers continue to buy payment integrity tools to lift margins, yet governments are now the fastest adopters as Medicare and Medicaid programs face mounting fraud exposure[1]Centers for Medicare & Medicaid Services, “Payment Integrity Updates 2025,” cms.gov. Together, these forces shift the conversation from optional cost containment toward indispensable payment-accuracy infrastructure that sustains payer solvency and safeguards member trust.
Key Report Takeaways
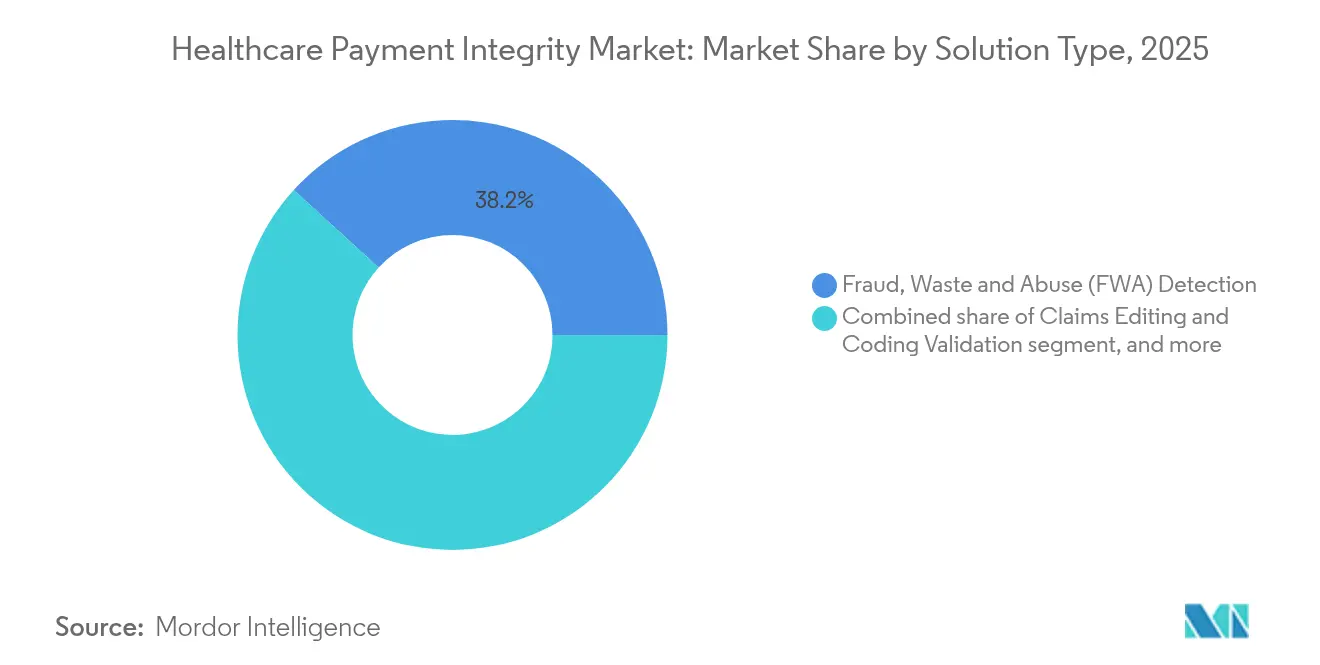
- By solution type, Fraud, Waste & Abuse detection led with 38.22% Healthcare Payment Integrity market share in 2025, while payment-accuracy and under-payment recovery solutions are projected to expand at a 15.42% CAGR to 2031.
- By service stage, pre-payment review captured 42.78% share of the Healthcare Payment Integrity market size in 2025, yet continuous concurrent review holds the fastest trajectory at 15.88% through 2031.
- By component, software platforms generated 55.12% of 2025 revenue by component, yet services—ranging from advisory to full BPO—are forecast to expand at a 15.95% CAGR.
- By claim type, medical claims generated 54.01% of 2025 revenue, yet dental and vision submissions show the highest CAGR at 14.09%.
- By deployment model, cloud platforms handled 61.87% of transactions in 2025 and are set to rise at a 15.51% CAGR.
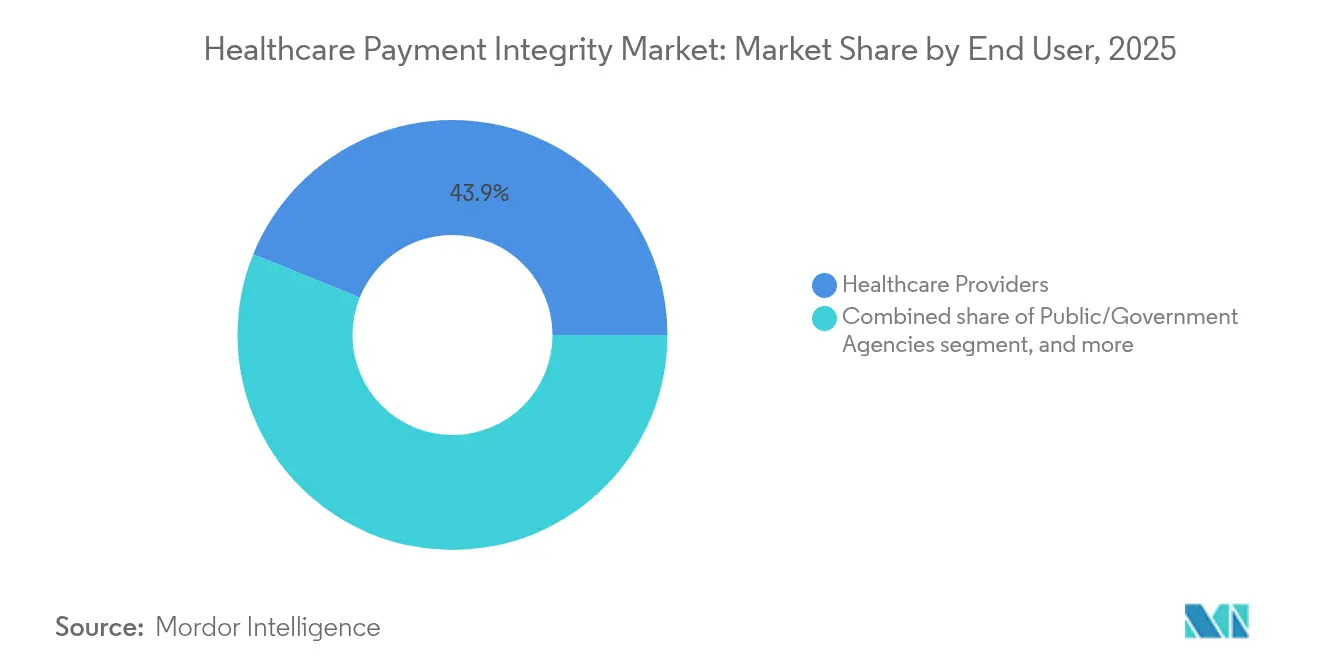
- By end user, providers held 43.88% of 2025 revenue, whereas public agencies are positioned to grow 16.52% annually to 2031.
- By geography, North America led with 42.10% revenue share in 2025, while Asia-Pacific is on track for a 14.12% CAGR through 2031.
Note: Market size and forecast figures in this report are generated using Mordor Intelligence’s proprietary estimation framework, updated with the latest available data and insights as of 2026.
Global Healthcare Payment Integrity Market Trends and Insights
Drivers Impact Analysis*
| Driver | % Impact on CAGR Forecast | Geographic Relevance | Impact Timeline |
|---|---|---|---|
| Escalating Healthcare Expenditure Waste | +3.2% | Global, highest in North America | Medium term (2-4 years) |
| Regulatory Emphasis on Payment Accuracy | +2.8% | North America & Europe, expanding to APAC | Long term (≥ 4 years) |
| Transition Toward Value-Based Care Models | +2.1% | North America core, spill-over to Europe | Long term (≥ 4 years) |
| Proliferation of Advanced Analytics and AI | +2.5% | Global, led by North America and Europe | Short term (≤ 2 years) |
| Adoption of Cloud and SaaS Delivery Models | +1.8% | Global, fastest uptake in APAC | Medium term (2-4 years) |
| Growing Incidence of Healthcare Fraud and Abuse | +1.9% | Global, rising focus in APAC | Medium term (2-4 years) |
| Source: Mordor Intelligence | |||
Escalating Healthcare Expenditure Waste
United States healthcare spending is projected to reach USD 7.2 trillion by 2031, yet the claims-error rate still stalls at 6.26%. Plans deploying integrated payment-accuracy platforms routinely recover 3-7% of total spend that point solutions miss. Waste now jeopardizes premium affordability, forcing payers to favor platforms that merge pre-payment, concurrent, and post-payment controls. Automation displaces manual review, shrinking administrative costs and accelerating detection cycles from weeks to seconds. As carriers quantify savings, payment integrity budgets shift from discretionary line items to core capital allocation. Market adoption therefore widens across small regional plans that previously lacked in-house analytics capabilities.
Regulatory Emphasis on Payment Accuracy
The Centers for Medicare & Medicaid Services enlarged fraud-prevention audits in 2025, raising penalties for systemic over- or under-payment errors. Only 64% of Medicare Advantage members now sit in four-star-and-above plans, down sharply from 2023, exposing carriers to enrollment loss unless integrity scores improve. The U.S. Department of Justice stepped-up False Claims Act actions, prompting health plans to showcase proactive analytics during compliance reviews. Europe mirrors the stance: national health funds in Germany and the United Kingdom ordered real-time fraud screens as part of e-claim modernization in 2025. Tighter enforcement accelerates outsourcing to third-party specialists that can embed audited workflows in less than six months. Smaller plans with thin capital buffers view regulatory fines as existential risk, speeding adoption of turnkey SaaS platforms.
Transition Toward Value-Based Care Models
Outcome-based contracts accounted for more than 40% of U.S. commercial payer spend in 2025, and each agreement requires vigilance over both cost and quality[2]Lyric, “Value-Based Care Payments Require Integrated Analytics,” lyric.ai. Payment integrity engines now ingest clinical outcome metrics alongside adjudication data, allowing carriers to flag non-compliant episodes before settlement. Zelis introduced in-network pricing models that simulate shared-risk contracts and recalibrate rates in real time. Concurrent review capability becomes critical; it tracks evolving risk scores during a care episode rather than auditing retroactively. With providers bearing risk for readmissions, accurate coordination-of-benefits calculations grow in importance, minimizing disputes between multiple payers. Collectively, value-based care enlarges payment integrity scope well beyond classic fraud settings into contract modeling and performance adjudication.
Proliferation of Advanced Analytics and AI
Generative AI now cuts claims-adjudication response time below 200 milliseconds, letting carriers stop suspect payments before funds leave escrow. EXL trained a healthcare-specific large language model that lifts detection accuracy by 30% versus generic off-the-shelf AI. Vendors embed natural language processing to parse clinical notes, unlocking insight unavailable in standard claim forms. Employers purchasing self-funded coverage increasingly demand AI-verified payment accuracy as part of administrative services agreements. The resulting arms race favors vendors with proprietary data sets and model-training pipelines that shorten false-positive feedback loops. Rapid AI advances also force new governance structures as boards scrutinize algorithmic bias and model drift.
Restraints Impact Analysis*
| Restraints Impact Analysis | (~) % Impact on CAGR Forecast | Geographic Relevance | Impact Timeline |
|---|---|---|---|
| Fragmented Healthcare IT Ecosystems | -1.8% | Global, most pronounced in North America | Medium term (2-4 years) |
| High Upfront Implementation Costs | -1.2% | Global, greatest effect in emerging markets | Short term (≤ 2 years) |
| Data Privacy and Security Concerns | -0.9% | Europe and North America, spreading globally | Long term (≥ 4 years) |
| Shortage of Skilled Analytical Workforce | -1.1% | Global, especially acute in APAC | Long term (≥ 4 years) |
| Source: Mordor Intelligence | |||
Fragmented Healthcare IT Ecosystems
U.S. payer and provider organizations often run dozens of legacy cores, many built on 1980s mainframes lacking modern APIs. Rural hospitals, 46% of which operate in financial distress, cannot fund wholesale upgrades, creating integration dead spots that curb analytics reach. Vendors must write multiple connectors for the same workflow, inflating implementation fees and timelines. Data quality suffers when key eligibility and clinical feeds remain siloed, reducing model precision. Interoperability mandates such as the ONC FHIR-based rule help, yet compliance costs weigh on small entities. The Healthcare Payment Integrity market therefore grows fastest where health IT modernization programs already standardized data pipelines.
High Upfront Implementation Costs
A comprehensive enterprise-wide platform can exceed USD 10 million in year-one spend for a midsize carrier, including software, migration, training, and change management. Many plans see full payback only after 24–36 months, pressuring cash flow. Capital restraints are acute in emerging economies where per-member premium pools are smaller; local carriers often postpone adoption or opt for limited-scope modules. Professional services can equal 30–40% of total project budget because each client holds unique benefit designs and provider contracts. Managed-services subscription models gain traction, allowing carriers to expense costs monthly and avoid heavy capex. Vendors that craft clear ROI dashboards and risk-sharing fee structures mitigate the barrier, yet the overall drag still trims incremental market growth.
*Our forecasts treat driver/restraint impacts as directional, not additive. The impact forecasts reflect baseline growth, mix effects, and variable interactions.
Segment Analysis
By Solution Type: Strategic Shift from Fraud Detection to Revenue Assurance
Fraud, Waste & Abuse modules controlled 38.22% of 2025 revenue, illustrating the Healthcare Payment Integrity market legacy orientation toward reactive fraud hunting. Yet payment-accuracy and under-payment recovery platforms are now projected to grow 15.42% annually, the quickest pace among solution lines, as executives discover chronic under-pricing often surpasses detected fraud losses. Health plans adopting automated repricing engines have reported uncovering 10% payment variance within six months of deployment, underlining latent recovery upside. Across 2025, vendors bolstered libraries of reference pricing data to shorten under-payment adjudication cycles. Among emerging modules, real-time clinical appropriateness review draws payer attention because it blends medical-necessity logic with financial edits inside a single pass. Point solutions risk marginalization as buyers insist on unified platforms spanning FWA, pricing accuracy, coordination-of-benefits, and contract modeling. Integration depth and model explainability thus replace ruleset volume as primary selection criteria.
Payment-accuracy momentum also reflects rising litigation over surprise billing. Plans now test algorithms against clean-claim benchmarks to avoid regulatory penalties. Vendors partner with clearinghouses to capture remittance data and refine under-payment heuristics. Competitive positioning hinges on proprietary rate-table curation and audit-trail transparency that can stand up in arbitration. The Healthcare Payment Integrity market therefore migrates toward end-to-end revenue integrity suites capable of ingesting unstructured EHR notes, provider contracts, and member benefits in near real time to certify both price and clinical soundness before funds disburse.


By Service Stage: Upstream Intervention Gains Traction
Pre-payment review still captured 42.78% of 2025 spending, underscoring carrier preference to block bad claims before they hit the ledger. However, continuous concurrent review shows a 15.88% CAGR to 2031, the fastest track within the Healthcare Payment Integrity market, because real-time editing produces dual savings: avoidance of overpayment and prevention of costly provider appeals. Real-time engines deliver sub-second response, enabling submission-level feedback that curtails denials without slowing provider cash flow. Concurrent review also equips plans to monitor quality metrics for value-based contracts, embedding both clinical and financial compliance inside one workflow.
Post-payment audit retains a role for high-dollar complex cases, yet its share shrinks as faster upstream capabilities mature. Vendors now ship dynamic rules that shift between pre-payment and concurrent modes based on claim complexity. Payers with closed-loop ecosystems route suspect high-cost drugs to clinical pharmacists for live validation, trimming specialty-pharmacy overpayments. Health systems engaged in downside-risk payment models adopt the same tooling, aiming to protect thin margins by catching payer under-allowance in near real time. As client maturity rises, service-stage choice becomes less binary; the leading platforms dynamically allocate each claim to the lowest-cost review tier that still assures accuracy.
By Deployment Model: Cloud Platforms Underpin Modernization
Cloud deployment amassed 61.87% revenue in 2025 and is expanding 15.51% a year, cementing its role as default architecture for the Healthcare Payment Integrity market. Health plans retiring on-premise adjudication stacks report operating-expense cuts of 20–30% within two years, driven by elastic compute and centralized patch management. Cloud also accelerates vendor release cycles, letting carriers consume weekly model updates rather than quarterly installs. Disaster-recovery posture improves because multi-zone replication comes native.
Regulatory momentum favors cloud as well: CMS’s 2025 interoperability rule presumes API-based data liquidity, far simpler to implement on a SaaS backbone. Large integrated delivery networks with entrenched data centers still keep niche on-prem modules, often for high-sensitivity mental-health claims. Hybrid architectures emerge, where anonymized claims hit public-cloud analytic layers while member identifiers stay inside private enclaves. Multi-tenant SaaS attracts regional insurers that lack IT staff, letting them access the same fraud-scoring engine as global payers at a usage-based fee. Procurement teams now stipulate FedRAMP or ISO 27001 credentials and require zero-downtime SLAs, making security posture a competitive separator among cloud vendors.
By End User: Providers Steady, Governments Accelerate
Providers owned 43.88% of 2025 spending because hospital revenue-cycle teams increasingly sit on both sides of the transaction as capitated risk grows. Internal recovery units deploy under-payment analytics to surface payer short-falls that average 2–3% of net revenue. At the same time, government agencies display the sharpest ascent, clocking a 16.52% CAGR that outpaces all private segments. CMS extended its Fraud Prevention System budget for the fifth consecutive year and launched pilots that marry AI with pre-claim checks. Emerging national schemes such as Indonesia’s JKN and India’s Ayushman Bharat are following suit, tendering multi-year cloud deals for nationwide payment-integrity hubs.
Private insurers continue steady procurement, pressured by employer clients demanding demonstrable savings. Third-party administrators and pharmacy-benefit managers widen their toolsets to maintain relevance amid fee compression. Providers buying integrity software mainly target denial avoidance rather than FWA, integrating claim scrubbers directly in EHR workflow so coders receive edit prompts before submission. The booming public-sector appetite, however, signals a profound market shift; vendors once primarily marketing to commercial carriers must now address public-sector procurement rules, localization, and data-sovereignty constraints.
By Component: Services Layer Scales with Complexity
Software platforms generated 55.12% of 2025 revenue, confirming that configurable code remains the Healthcare Payment Integrity market cornerstone. Yet services—ranging from advisory to full BPO—are forecast to expand 15.95% annually, the fastest component climb. EXL, for example, recorded 24.7% healthcare-segment growth in Q1 2025, powered by managed-service contracts that embed analysts beside client teams. Complexity fuels the surge: deploying AI models requires ongoing tuning, reference-data curation, and compliance monitoring that many payers cannot staff internally.
Service vendors bundle outcome-based pricing, where fees hinge on verified savings rather than effort, aligning incentives and smoothing onboarding cost. Advisory arms guide contract modeling for value-based care, map data feeds into FHIR frameworks, and train client staff. BPO units often inherit legacy mainframe processes temporarily while cloud cut-over proceeds, ensuring cash-flow continuity. Over the forecast horizon, platform vendors unable to pair technology with robust service envelopes risk losing share to integrators that can deliver turnkey operational transformation. Consequently, cross-border delivery centers and automation-first methodologies become critical scale levers in an otherwise people-heavy revenue stream.
By Claim Type: Expanding Oversight of Ancillary Benefits
Medical claims still produced 54.01% of 2025 spend, yet dental and vision submissions show the highest CAGR at 14.09% because employers broaden ancillary coverage amid talent-retention battles. Fraud rings have migrated into orthodontic upcoding and cataract surgery bundling, areas once lightly scrutinized. Plans thus recalibrate AI models to incorporate new CDT and V codes, raising detection accuracy for mis-billed elective procedures. Specialty pharmacy claims grow steadily, spurred by gene-therapy launches with price tags pushing USD 2 million per dose; payers require sub-second verifications against indication-specific prior-authorization data. Durable-medical-equipment and home-health claims attract attention as value-based care extends into post-acute settings, demanding location-of-service validation to prevent duplicate billing. The Healthcare Payment Integrity market adapts by offering modular claim-type libraries so payers can swap in new edit packs as benefit design evolves without multi-month release cycles.
Geography Analysis
North America retained 42.10% of 2025 revenue because the United States operates a multi-payer landscape with heavy regulatory scrutiny and high fraud losses. Medicaid agencies in at least 35 states expanded AI pilots in 2025, creating a funnel of small but fast-scaling contracts. Canada’s provincial insurers updated adjudication platforms to cloud SaaS, a move expected to cut processing costs 15% by 2027. Mexico advanced interoperability guidelines under its General Health Law, opening bid opportunities for Latin-focused vendors with Spanish-language analytics.
Europe formed the second-largest block, underpinned by accelerated e-health funding from the EU Recovery and Resilience Facility. Germany activated mandatory e-invoice rules for statutory insurers in January 2025, spurring carriers to integrate real-time fraud scoring. The United Kingdom’s NHS Business Services Authority extended its dental-claims AI pilot nationwide after early phases recouped GBP 78 million in six months, demonstrating ROI to skeptical stakeholders. GDPR compliance remains non-negotiable, so European buyers favor vendors offering in-region data centers and encryption at rest approved by ENISA cyber-security guidance.
Asia-Pacific is the Healthcare Payment Integrity market hot spot, projected at a 14.12% CAGR through 2031. Indonesia’s JKN program, covering 93% of citizens, reported 2025 claim submissions topping 1.4 billion, volumes impossible to police manually. India’s Ayushman Bharat digital mission deployed blockchain-based claim tracking in five pilot states, a template for national rollout. China’s National Healthcare Security Administration mandated AI-driven audits on high-value oncology drugs, while Japan’s Social Insurance Agency fast-tracked an RFP for concurrent-review SaaS to cut elder-care overpayments. Australia and South Korea, already digitally mature, now explore generative AI to analyze free-text clinical documents for appropriateness flags. Multilingual NLP, local regulatory hosting, and on-the-ground implementation partners emerge as must-have features for vendors eyeing APAC expansion.

Competitive Landscape
Strategic acquisitions keep reshaping the field. UnitedHealth Group’s USD 3.2 billion purchase of Equian bolstered Optum’s analytics depth and cross-selling muscle. Mubadala’s late-2024 equity injection into Zelis bankrolls AI R&D and broadens global reach, highlighting investor confidence in scalable payment-integrity networks[3]Zelis, “Mubadala Investment Announcement,” zelis.com. Moderate concentration prevails because the top handful of players command breadth across analytics, network pricing, and provider-engagement portals, yet dozens of niche vendors still thrive in specialized lanes like dental or pharmacy edits.
Technology is the primary differentiator. EXL’s domain-trained language model lifted false-positive reduction to 30%, shaving adjuster workload and creating a defensible moat. Health at Scale touts sub-200 millisecond response, enabling pre-authorization denial before claim origination. Anomaly and similar start-ups focus on employer self-funded plans, leveraging contemporary data-science stacks without legacy baggage.
Partnerships complement product gaps. Zelis paired with Availity in 2025 to streamline claims attachment routing, merging payment integrity with provider workflow to cut resubmission cycles. Clearinghouse integrations furnish vendors with rich remittance and eligibility data, improving model features. White-space opportunities exist in real-time concurrent edits for mental-health tele-visits and risk-adjustment score validation, areas underserved by current rule libraries. Vendors that quantify hard-dollar savings and publish audit-verified case studies win longer contracts and shield share from encroaching fintech entrants.
Healthcare Payment Integrity Industry Leaders
Cotiviti
Optum
Conduent
SAS Institute
Zelis
- *Disclaimer: Major Players sorted in no particular order

Recent Industry Developments
- June 2025: Red Sky Health unveiled Daniel, an AI platform that flags and corrects claim errors in real time, targeting the USD 262 billion annual denial burden.
- June 2025: Amperos Health introduced its Multi-Modal Reason AI Biller to lower denials and speed collections.
- February 2025: EXL Service Holdings reported Q1 healthcare revenue of USD 125.6 million, up 24.7% year over year, citing higher payment-integrity volume.
- December 2024: Mubadala Investment Company invested in Zelis to accelerate technology scale-out and global expansion.
- February 2024: Zelis Payment Integrity earned 2024 Best in KLAS honors for overall client satisfaction.


Global Healthcare Payment Integrity Market Report Scope
Healthcare payment integrity refers to processes, practices, and technologies used to ensure that payments for healthcare services are accurate, compliant with regulations, and free from fraud or abuse.
The healthcare payment integrity market is segmented by solution type, deployment model, end user, and geography. By solution type, the market is segmented into fraud detection, claims analytics, payment accuracy, and others (audit management, coding validation, and optimization). By deployment model, the market is segmented into on-premises and cloud-based. By end user, the market is segmented into healthcare payers, healthcare providers, and government agencies. By geography, the market is segmented into North America, Europe, Asia-Pacific, South America, and Middle East and Africa. The report also offers the market size and forecasts for 17 countries. For each segment, the market sizing and forecasts were made on the basis of value (USD).
| Fraud, Waste & Abuse (FWA) Detection |
| Claims Editing & Coding Validation |
| Coordination-of-Benefits (COB) |
| Payment Accuracy / Under-payment Recovery |
| Other Solution Types |
| Pre-Payment Integrity |
| Post-Payment Integrity |
| Continuous Concurrent Review |
| Software (Platform & Tools) |
| Services (BPO, Advisory, Audit) |
| Cloud-Based |
| On-Premises / Private Cloud |
| Private Payers |
| Public / Government Agencies |
| Healthcare Providers |
| TPAs & PBMs |
| Medical |
| Pharmacy |
| Dental & Vision |
| Ancillary (DME, Home-health) |
| North America | United States |
| Canada | |
| Mexico | |
| Europe | Germany |
| United Kingdom | |
| France | |
| Italy | |
| Spain | |
| Rest of Europe | |
| Asia-Pacific | China |
| Japan | |
| India | |
| Australia | |
| South Korea | |
| Rest of Asia-Pacific | |
| Middle East & Africa | GCC |
| South Africa | |
| Rest of Middle East & Africa | |
| South America | Brazil |
| Argentina | |
| Rest of South America |
| By Solution Type | Fraud, Waste & Abuse (FWA) Detection | |
| Claims Editing & Coding Validation | ||
| Coordination-of-Benefits (COB) | ||
| Payment Accuracy / Under-payment Recovery | ||
| Other Solution Types | ||
| By Service Stage | Pre-Payment Integrity | |
| Post-Payment Integrity | ||
| Continuous Concurrent Review | ||
| By Component | Software (Platform & Tools) | |
| Services (BPO, Advisory, Audit) | ||
| By Deployment Model | Cloud-Based | |
| On-Premises / Private Cloud | ||
| By End User | Private Payers | |
| Public / Government Agencies | ||
| Healthcare Providers | ||
| TPAs & PBMs | ||
| By Claim Type | Medical | |
| Pharmacy | ||
| Dental & Vision | ||
| Ancillary (DME, Home-health) | ||
| Geography | North America | United States |
| Canada | ||
| Mexico | ||
| Europe | Germany | |
| United Kingdom | ||
| France | ||
| Italy | ||
| Spain | ||
| Rest of Europe | ||
| Asia-Pacific | China | |
| Japan | ||
| India | ||
| Australia | ||
| South Korea | ||
| Rest of Asia-Pacific | ||
| Middle East & Africa | GCC | |
| South Africa | ||
| Rest of Middle East & Africa | ||
| South America | Brazil | |
| Argentina | ||
| Rest of South America | ||


Key Questions Answered in the Report
What is the current Healthcare Payment Integrity market size?
The Healthcare Payment Integrity market size reached USD 17.06 billion in 2026 and is on course to hit USD 31.25 billion by 2031.
Which segment is growing the fastest?
Payment-accuracy and under-payment recovery solutions lead growth with a projected 15.42% CAGR through 2031.
Why are government payers accelerating investment?
Intensified regulatory audits and rising Medicare and Medicaid fraud exposure push agencies to adopt real-time AI tools that improve detection and reduce improper payments.
How does cloud adoption benefit payment integrity programs?
Cloud platforms cut operating costs by up to 30%, deliver rapid AI updates, and simplify compliance with interoperability mandates.
What role does generative AI play in claims accuracy?
Domain-trained language models parse unstructured clinical text and cut false positives by 30%, enabling sub-second decisioning that blocks suspect claims before payment.
Which region offers the highest growth potential?
Asia-Pacific leads with a forecast 14.12% CAGR as large national insurance schemes digitize claims and require scalable, multilingual integrity solutions.
Page last updated on:


