Healthcare Claim Management Market Size and Share
Market Overview
| Study Period | 2020 - 2031 |
|---|---|
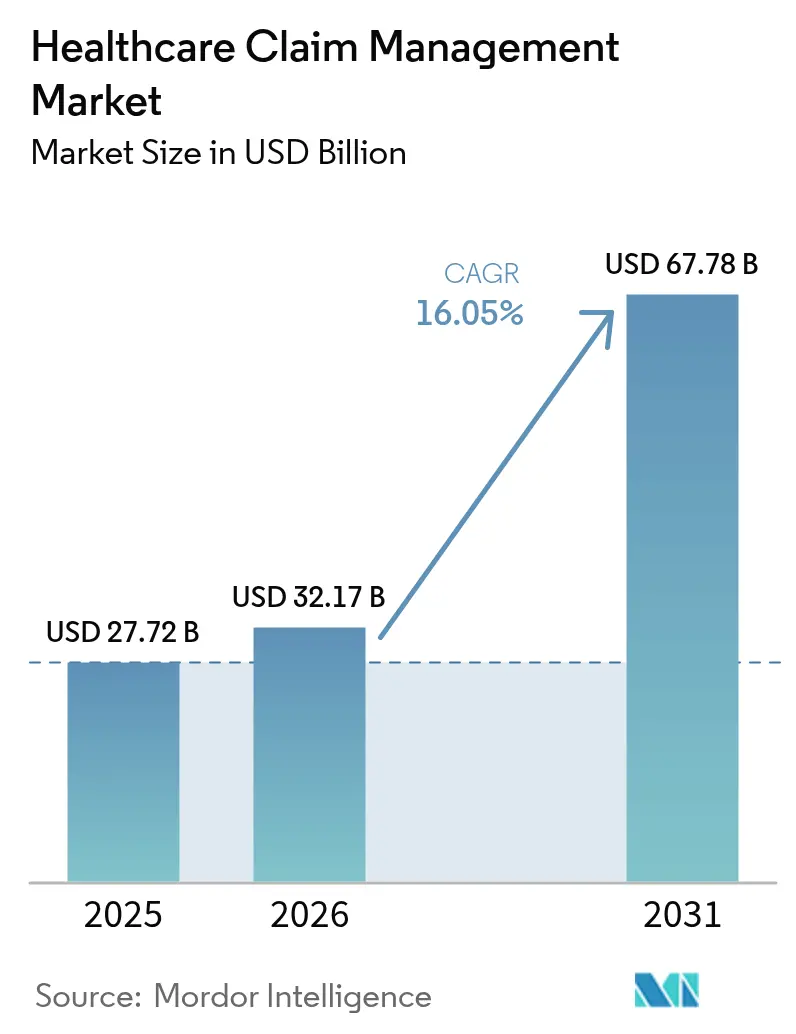
| Market Size (2026) | USD 32.17 Billion |
| Market Size (2031) | USD 67.78 Billion |
| Growth Rate (2026 - 2031) | 16.05% CAGR |
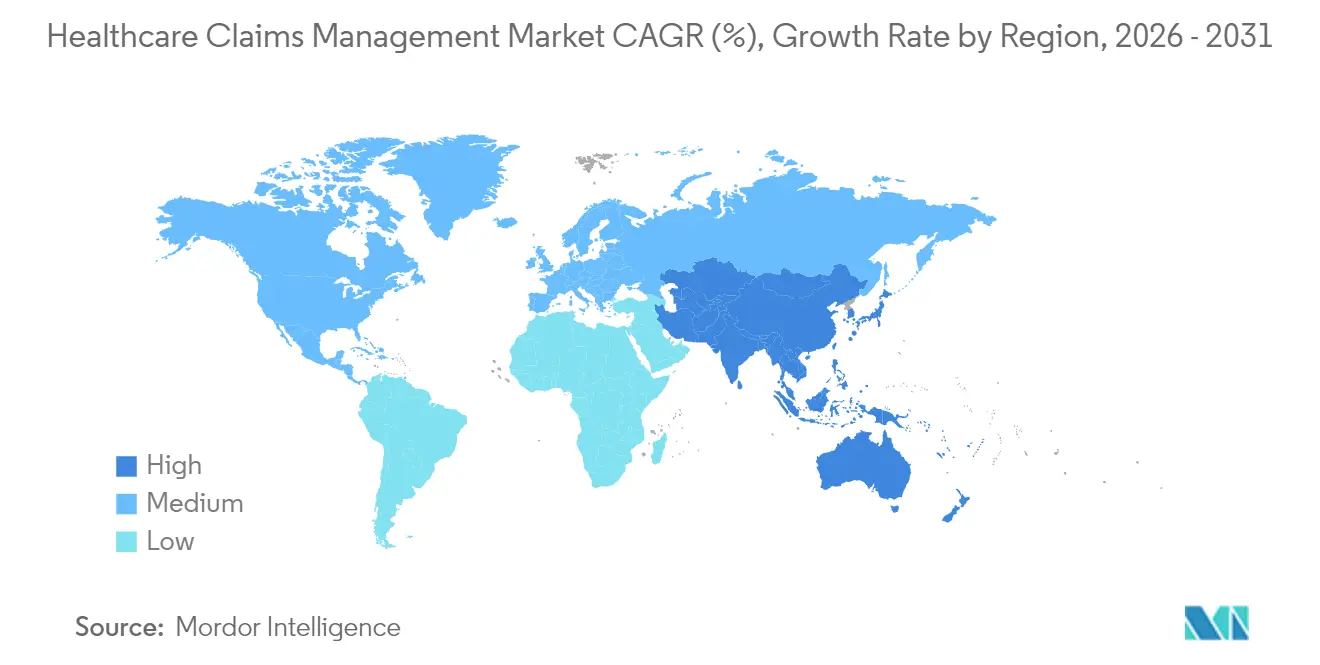
| Fastest Growing Market | Asia Pacific |
| Largest Market | North America |
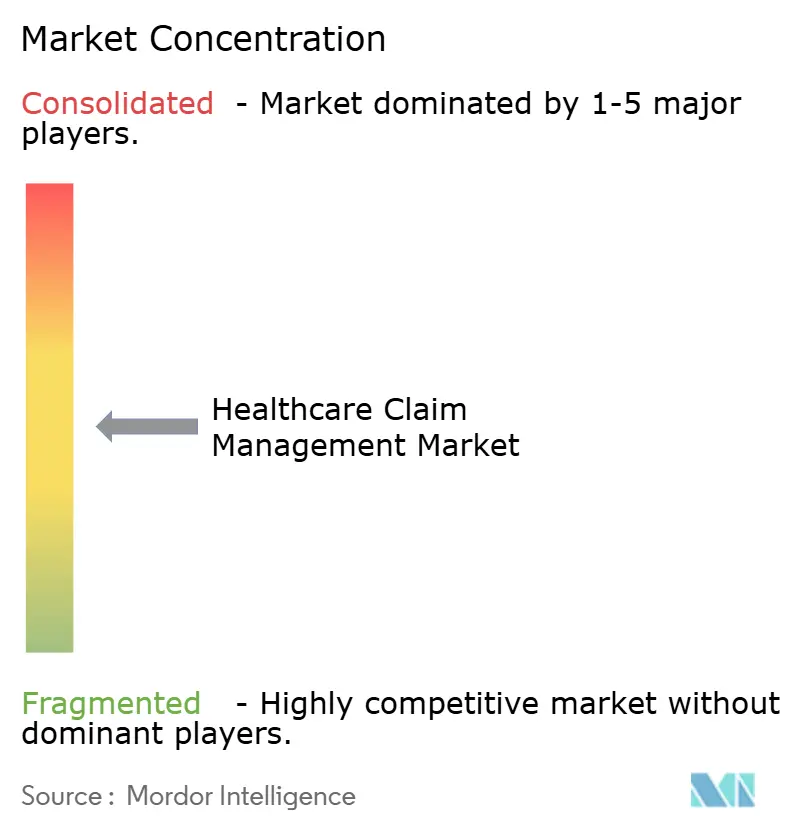
| Market Concentration | Medium |
Major Players *Disclaimer: Major Players sorted in no particular order Image © Mordor Intelligence. Reuse requires attribution under CC BY 4.0. | |
Healthcare Claim Management Market Analysis by Mordor Intelligence
The healthcare claims management market size was valued at USD 27.72 billion in 2025 and estimated to grow from USD 32.17 billion in 2026 to reach USD 67.78 billion by 2031, at a CAGR of 16.05% during the forecast period (2026-2031). Rapid digitalization, rising claim-denial expenses, and mounting pressure to improve payment accuracy encourage payers and providers to replace manual workflows with AI-driven platforms. Hospitals now spend USD 19.7 billion annually overturning denied claims, underscoring the urgency for automation. Cloud deployment gains momentum as organizations favor real-time analytics at scale, while integrated revenue-cycle suites and payment-integrity modules converge to minimize revenue leakage. Moderate consolidation continues as established vendors acquire niche innovators to accelerate time-to-market for generative AI tools that offset an expected 100,000-worker shortfall in healthcare administration by 2028[1]American Hospital Association, “Hospital Denial Recovery Report 2025,” aha.org.
Key Report Takeaways
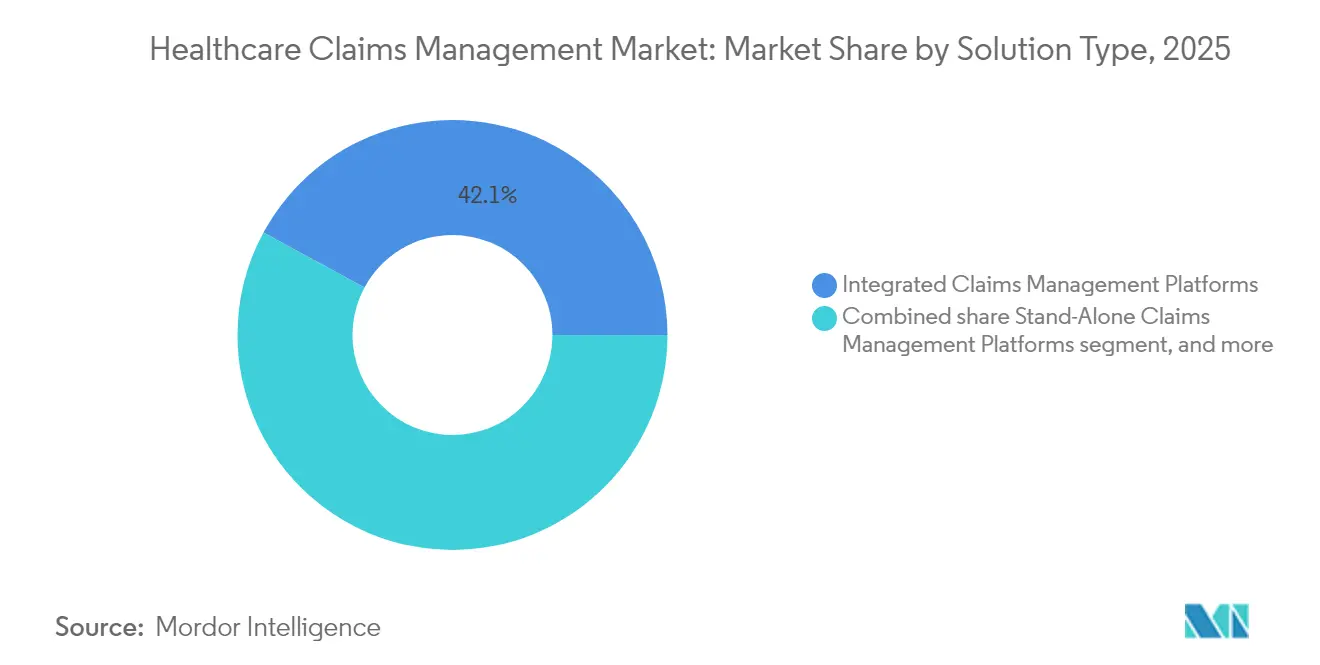
- By solution type, integrated claims-and-RCM suites led with 42.10% revenue share in 2025, whereas AI-based denial-management modules are projected to expand at an 18.21% CAGR through 2031.
- By component, software accounted for 62.65% of spending in 2025; services are pacing ahead with a 9.85% CAGR to 2031 as providers seek implementation and managed-services support.
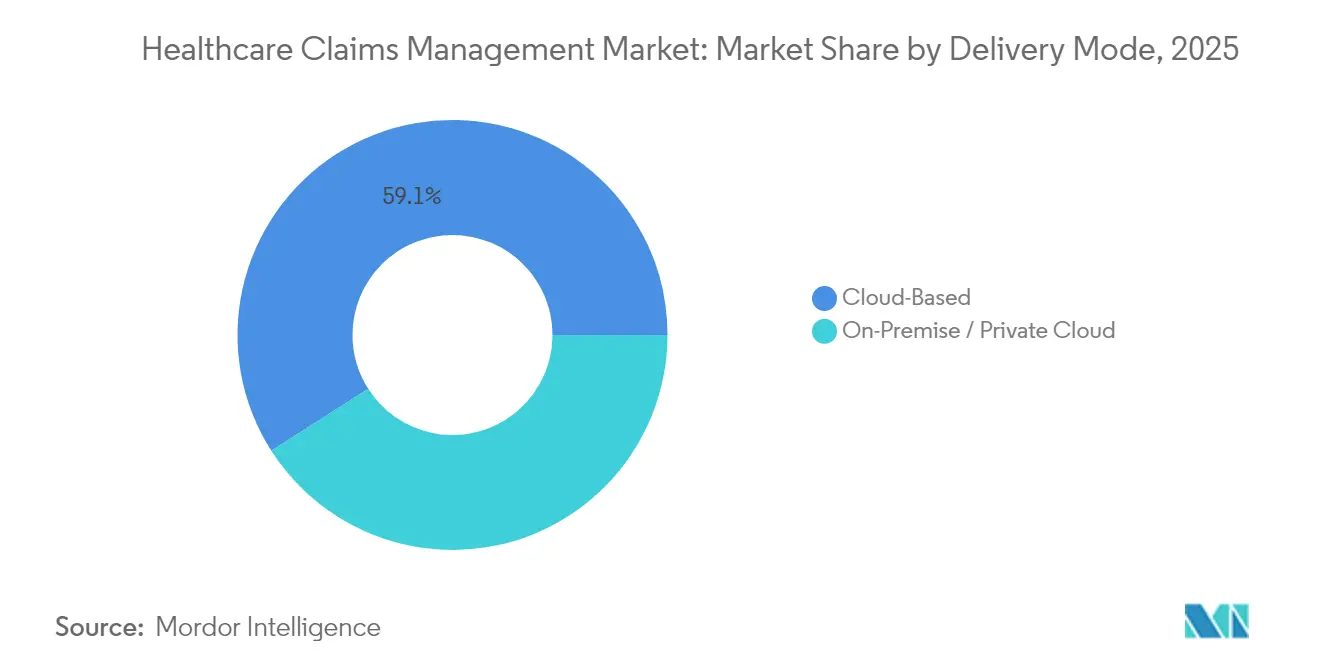
- By delivery mode, cloud deployments captured 59.05% of the healthcare claims management market size in 2025 and are growing at an 18.40% CAGR thanks to scalability and rapid data-exchange capabilities.
- By end-user, payers processed 53.70% of claims volume in 2025, while third-party administrators recorded the fastest 19.15% CAGR as self-funded employers outsource benefit administration.
- By geography, North America retained 45.90% of 2025 revenue; Asia-Pacific is the fastest-growing region with a 17.20% CAGR to 2031, driven by expanding insurance coverage and digital-health investment.
Note: Market size and forecast figures in this report are generated using Mordor Intelligence’s proprietary estimation framework, updated with the latest available data and insights as of 2026.
Global Healthcare Claim Management Market Trends and Insights
Drivers Impact Analysis*
| Driver | % Impact on CAGR Forecast | Geographic Relevance | Impact Timeline |
|---|---|---|---|
| Expansion of public and private health-insurance coverage | +2.8% | Global; early gains in Asia-Pacific | Medium term (2-4 years) |
| Escalating financial impact of claim denials | +3.2% | North America and EU; spill-over to APAC | Short term (≤2 years) |
| Growing geriatric and chronic disease population | +2.1% | Global; concentrated in developed markets | Long term (≥4 years) |
| Adoption of AI-enabled payment-integrity platforms | +4.1% | North America core, expanding to APAC and EU | Short term (≤2 years) |
| Deployment of robotic process automation in claims adjudication | +2.9% | Global; enterprise-level early adoption | Medium term (2-4 years) |
| Shift toward value-based and real-time reimbursement models | +1.4% | North America lead; gradual APAC adoption | Long term (≥4 years) |
| Source: Mordor Intelligence | |||
Expansion Of Public and Private Health-Insurance Coverage
Wider insurance adoption adds millions of newly covered lives, increasing claims volume and complexity. Emerging Asia-Pacific markets accelerate digital reforms, illustrated by Thailand’s AI-enabled universal-coverage roadmap and India’s push to integrate national health records with payer systems. In the United States, the Medicare Shared Savings Program continues to migrate providers into accountable-care contracts, driving demand for analytics-rich platforms that reconcile shared-savings payments[2]Centers for Medicare & Medicaid Services, “National Health Care Spending Update 2025,” cms.gov.
Escalating Financial Impact of Claim Denials
Denial rates reached 11.8% in 2024, costing hospitals USD 19.7 billion in rework and lost revenue. The average denied claim costs USD 25–181 to remediate, and 65% of denied cases are never resubmitted, making proactive denial avoidance essential. Intermountain Health used advanced analytics to recoup USD 20 million and projected USD 35 million in future savings by restructuring its denial-management workflow.
Growing Geriatric and Chronic Disease Population
An aging population raises chronic-care claims that require accurate risk adjustment and longitudinal data. Academic medical centers that embedded chronic-care coordination into claims workflows improved continuity-of-care billing accuracy, while updated risk-adjustment models reward precise capture of social-determinant codes with a 2.9% rate uplift.
Adoption Of AI-Enabled Payment Integrity Platforms
AI engines that cross-reference clinical, coding, and utilization data help payers detect overpayments, fraudulent claims, and coding errors. Optum’s CARE Rules Engine cuts manual audit hours by 4,500–5,000 annually for several state Medicaid programs. Waystar’s new generative AI tool drafts appeal letters for the 450 million denied claims processed each year, promising significant labor savings.
Restraints Impact Analysis*
| Restraints Impact Analysis | (~) % Impact on CAGR Forecast | Geographic Relevance | Impact Timeline |
|---|---|---|---|
| Stringent patient-data privacy and cybersecurity regulations | –1.8% | Global; stricter EU and North America enforcement | Short term (≤2 years) |
| High upfront implementation and migration costs | –2.3% | Global; mid-size organizations most affected | Medium term (2-4 years) |
| Interoperability challenges across legacy core systems | –1.6% | Global; concentrated in established markets | Medium term (2-4 years) |
| Shortage of analytics and AI-skilled workforce | –1.9% | Global; acute in North America and EU | Long term (≥4 years) |
| Source: Mordor Intelligence | |||
Stringent Patient Data Privacy and Cybersecurity Regulations
Global frameworks such as GDPR and HIPAA impose stiff penalties for data breaches, compelling vendors to invest in zero-trust architectures and end-to-end encryption. Frequent ransomware attacks on healthcare facilities heighten executive focus on security certifications and continuous monitoring.
High Upfront Implementation and Migration Costs
Modern platforms require API gateways, data-quality audits, and staff retraining. Mid-tier hospitals often defer digital upgrades because annual capital budgets remain flat. Subscription-based managed-service models help distribute costs over multi-year contracts, but CFOs still scrutinize return-on-investment timelines.
*Our forecasts treat driver/restraint impacts as directional, not additive. The impact forecasts reflect baseline growth, mix effects, and variable interactions.
Segment Analysis
By Solution Type: AI-Based Modules Drive Innovation
Integrated platforms dominated 2025 with a 42.10% revenue share as organizations adopted enterprise-wide suites that merge eligibility, prior authorization, and revenue-cycle tools into a single workspace. The healthcare claims management market continues to prize all-in-one ecosystems that lower vendor sprawl and simplify compliance audits. AI-based denial-management modules, however, are set to grow at an 18.21% CAGR through 2031 as administrators target denial rates above 10%. These apps mine claims, coding, and clinical notes to flag high-risk submissions before they reach payers, reducing rework costs.
Standalone payment-integrity engines remain attractive to mid-size payers that want rapid fraud-detection gains without replacing core adjudicators. Optum’s Integrity One recorded more than 20% coder-productivity gains during beta testing, while one regional health plan using Cognizant’s analytics stack cut pending inventory fifteen-fold. The healthcare claims management market therefore shows a clear pivot from retrospective auditing to concurrent and prospective risk scoring.


By Component: Services Segment Accelerates
Software licenses represented 62.65% of 2025 spending, reflecting large investments in AI rule sets, API libraries, and workflow orchestration engines that anchor modern platforms. Yet the services category is advancing at a 9.85% CAGR as hospitals, payers, and TPAs contract for implementation, configuration, and ongoing optimization support. Outsourced claims-processing units fill critical labor gaps, and managed-service deals guarantee SLAs that internal teams struggle to match.
Consulting engagements often revolve around privacy-impact assessments, TEFCA readiness, and value-based-contract modeling. As legacy COBOL systems sunset, providers rely on service partners to migrate millions of records without downtime. Consequently, the healthcare claims management market size for advisory and managed-services lines is forecast to outpace license revenue growth over the next five years.
By Delivery Mode: Cloud-Based Solutions Dominate Growth
Cloud deployments held 59.05% revenue in 2025 and are outpacing overall market growth at an 18.40% CAGR as enterprises favor elastic storage and always-on analytics. Florida Blue’s claims modernization achieved a 40% processing-speed improvement after refactoring micro-services in a secure public-cloud tenancy that scales on demand. The healthcare claims management market share of on-premise systems continues to shrink as CIOs prioritize disaster-recovery resilience and pay-per-use economics.
Institutions with strict data-residency requirements still choose hybrid models, retaining sensitive PHI on private clouds while using public compute pools for model training. Anthem’s collaboration with IBM and Amazon Web Services processes 750 million claims annually and reduced high-priority incidents 25% within one year IBM. Blockchain pilots that trace claim edits across stakeholders also favor cloud-native stacks, further strengthening the deployment shift.
By End-User: TPAs Experience Rapid Expansion
Payers managed 53.70% of total claims in 2025, leveraging in-house adjudication engines and nationwide provider networks. Yet TPAs display the fastest 19.15% CAGR as self-funded employers seek flexible benefit designs and transparent fee models. The global TPA sector topped USD 488.9 billion in 2024 and continues to migrate toward AI-enabled automation that slashes overhead.
Hospitals deepen investment in purpose-built denial-management portals to recoup lost revenue, while large physician groups deploy real-time eligibility checks to support value-based contracts. Employers working with TPAs demand dashboards that expose cost trends, prompting administrators to embed predictive analytics that flag high-cost members for early intervention. As a result, the healthcare claims management market size tied to employer-sponsored plans expands steadily through 2030.
Geography Analysis
North America accounted for 45.90% of 2025 revenue, underpinned by Medicare, Medicaid, and commercial insurers that together adjudicate billions of claims annually. Federal mandates such as the 21st Century Cures Act and TEFCA enforce FHIR interoperability, prompting continuous platform upgrades. Canada’s single-payer model drives provincial initiatives to automate eligibility verification, while Mexico’s insurance-expansion programs fuel new deployments among social-security institutes.
Asia-Pacific is the fastest-growing region with a 17.20% CAGR, propelled by compulsory insurance schemes, rapid private-payer expansion, and governmental AI roadmaps. China encourages AI-based claim verification within its national-reimbursement-drug list to curb fraud, and Japan embraces chronic-care registries to manage an expanding elder population. India integrates health-identity numbers with payer databases to streamline e-claims, and Australia’s shared health-record platform accelerates real-time adjudication for tele-consults.
Europe maintains steady adoption as GDPR compliance and e-prescription mandates shape purchasing priorities. Germany promotes semantic interoperability standards in the Krankenhauszukunftsgesetz funding program, while the United Kingdom’s NHS upgrades spine services to support centralized prior-authorization workflows. Southern European countries invest European Recovery funds to modernize claims portals that enable cross-border treatment billing. Collectively, these initiatives ensure the healthcare claims management market continues its expansion across the continent.

Regulatory Landscape
In the United States, the Department of Health and Human Services (HHS) and CMS are tightening administrative simplification and interoperability requirements that affect claims intake, documentation exchange, and remittance workflows. In March 2026, HHS finalized CMS-0053-F to adopt HIPAA standards for health care claims attachments transactions, moving the industry away from manual fax and mail processes by requiring the use of X12N 275 and 277 (Version 6020) for administrative transaction data and HL7 standards for clinical data. The rule is effective May 26, 2026, with a mandatory compliance deadline of May 26, 2028.
Adjacent federal actions also standardize downstream dispute and authorization processes tied to claims. In June 2026, HHS issued final rules on Federal Independent Dispute Resolution (IDR) operations (effective August 3, 2026) that include instructions for using Claim Adjustment Reason Codes (CARCs) and Remittance Advice Remark Codes (RARCs) within electronic remittance advice, reinforcing consistent coding in payer-provider communications. CMS has also reaffirmed prior authorization interoperability requirements from the 2024 Interoperability and Prior Authorization final rule, with API compliance dates extending into 2027, which elevates the value of FHIR-enabled data exchange in claims-related workflows.
Competitive Landscape
Market concentration is moderate. Optum anchors the top tier by coupling claims platforms with analytics, network management, and payment-integrity services. New Mountain Capital and KKR continue multi-billion-dollar roll-ups to assemble scaled payment-accuracy portfolios that compete on breadth of AI models. Oracle previewed an EHR-native claims module that merges clinical and financial data, signaling a trend toward one-stop platforms.
Technology differentiation now rests on generative AI. Waystar’s AltitudeCreate automatically drafts appeal letters and integrates with Epic work queues, reducing staff workload and cycle times. Cognizant delivered 92% adjudication-cost savings for one large payer by orchestrating RPA bots across eligibility, price checking, and compliance edits.
White-space opportunities persist in mid-market hospitals that need turnkey SaaS offerings, in niche modules addressing social-determinant coding, and in real-time enrichment APIs for value-based care scorecards. Vendors that guarantee zero-trust security and low-code configuration stand to gain share as chief information security officers and clinical executives jointly evaluate new purchases. The anticipated administrative-talent shortfall further incentivizes product roadmaps that embed self-service analytics and conversational AI helpers.
Healthcare Claim Management Industry Leaders
Optum, Inc.
Mckesson Corporation
Cognizant (Trizetto)
Oracle
Accenture Plc
- *Disclaimer: Major Players sorted in no particular order

Market Opportunities and Future Outlook
The claims-attachments mandate (CMS-0053-F) creates a modernization window for platforms that can operationalize HIPAA-adopted electronic attachment standards and electronic signatures across payer and provider ecosystems ahead of the May 26, 2028 compliance deadline. This shifts spending toward workflow engines that support X12N 275/277 (Version 6020), HL7-based clinical documentation exchange, and secure signature capture, alongside services for mapping, testing, partner connectivity, and audit readiness. Vendors that package attachment exchange with denial prevention and payment integrity modules gain a clearer procurement path as organizations replace manual documentation handling that contributes to rework.
Enterprise buyers are also funding agentic and real-time automation to reduce manual touches across adjudication, disputes, and utilization workflows. In May 2026, CVS Health (Aetna) introduced a second-generation Aetna Claims Assist Manager (CAM) and reported more than a 20% reduction in manual review processing time, indicating demand for AI-assisted claim review at scale. In June 2026, R1 RCM expanded Phare OS with Payer Atlas and an intelligence engine to combine clinical and financial data for real-time adjudication, with live deployment covering USD 76 billion in net patient revenue, while Zelis launched an AI-native solution focused on No Surprises Act IDR workflows. Together, these moves point to whitespace for claims platforms that unify clinical documentation, remittance signals (CARCs/RARCs), and prior authorization data into configurable automation layers that payers, providers, and TPAs can implement without replacing core adjudication systems.
Recent Industry Developments
- May 2026: Cognizant opened the TriZetto Unify platform via headless API access to enable AI agents, targeting automation of electronic prior authorization workflows. The change expands developer-level integration options for payers and administrators and aligns platform roadmaps with interoperability and faster-decision requirements that affect claims throughput and administrative costs.
- April 2025: Transcarent completed its USD 621 million merger with Accolade, combining care navigation with AI-enabled advocacy capabilities across pharmacy and specialty care for more than 20 million members. The combined footprint strengthens the case for integrating member engagement and clinical navigation data with claims and payment workflows to reduce friction across the reimbursement lifecycle.
- February 2024: CMS finalized the Interoperability and Prior Authorization rule (CMS-0057-F), setting requirements that use FHIR-based APIs to streamline data exchange for patient access and prior authorization processes. The rule drives payer investment in API-enabled data fabrics that feed claims intake, documentation workflows, and automation layers, supporting demand for claims platforms built around standards-based exchange rather than point-to-point interfaces.


Research Methodology Framework and Report Scope
Market Definition and Coverage
For this study, the healthcare claims management market is defined as the software and related services used to capture, process, adjudicate, audit, and analyze healthcare claims, including denial and payment review workflows. The scope covers use by payers, providers, and third-party administrators across care settings.
Scope exclusions: It excludes non-health insurance claims platforms such as property and casualty, auto, and workers compensation systems when they are not designed for healthcare claims workflows.
Segmentation Overview
- By Solution Type
- Integrated Claims Management Platforms
- Stand-Alone Claims Management Platforms
- Ai-Based Denial Management Modules
- Payment Integrity Solutions
- By Component
- Software
- Services (Bpo, Consulting, Managed)
- By Delivery Mode
- Cloud-Based
- On-Premise / Private Cloud
- By End-User
- Healthcare Payers (Public And Private)
- Healthcare Providers
- Third-Party Administrators (Tpas)
- Geography
- North America
- United States
- Canada
- Mexico
- Europe
- Germany
- United Kingdom
- France
- Italy
- Spain
- Rest of Europe
- Asia-Pacific
- China
- Japan
- India
- Australia
- South Korea
- Rest of Asia-Pacific
- Middle East & Africa
- GCC
- South Africa
- Rest of Middle East & Africa
- South America
- Brazil
- Argentina
- Rest of South America
- North America
Data Sources, Market Sizing, and Validation
Desk Research
Desk research was used to set the fact base and boundaries for the model, with a focus on claim volumes, policy coverage, and healthcare spend context by region. Public sources included the Centers for Medicare and Medicaid Services (National Health Expenditure Accounts), the US Bureau of Labor Statistics for wage and employment signals tied to administrative functions, and the World Health Organization and World Bank for cross-country health financing indicators.
To make the inputs realistic, we also reviewed guidance and datasets such as OECD Health Statistics, CDC summaries on payer and provider utilization patterns, and peer-reviewed journals that discuss administrative burden, denials, and coding trends. Company annual reports, investor presentations, and reputable press were used to track platform mix shifts including cloud adoption and automation.
For cross-checking company scale and deal activity, analysts also referenced paid subscriptions focused on company financials and intelligence, and patent databases to identify themes around workflow automation. These examples are not exhaustive, and many other public and paid sources were used for collection, validation, and clarification.
Primary Interviews and Surveys
Primary work was done through expert interviews and structured surveys with payer operations teams, provider revenue-cycle leaders, third-party administrators, and implementation partners who work directly on claims processing and denial workflows. Since this is a global market, we covered demand signals and pricing logic across APAC, EMEA, and the Americas to check assumptions on claim complexity, adoption speed, and service intensity before finalizing results.
Distribution of primary research fieldwork respondents
| Company type | Respondent position | Region |
|---|---|---|
| Top tier: 34% | CXOs: 15% | APAC: 38% |
| Mid tier: 47% | Functional/Unit leaders: 40% | EMEA: 36% |
| Smaller Players: 19% | Managers: 45% | Americas: 26% |
Market-Sizing & Forecasting
Sizing starts with a top-down build that reconstructs the addressable claims-operations spend pool by linking healthcare activity to claim throughput needs, then applying adoption and outsourcing intensity factors for claims management solutions and services. Where the market is fragmented by delivery model, we treat software and services separately so license or subscription dynamics do not get mixed with implementation and managed-work pricing.
To keep the model grounded, inputs include claim volumes and growth (driven by utilization and coverage), denial and rework rates that increase processing effort, automation and cloud adoption levels that influence average spend per claim, and regulatory or coding complexity signals that change workload. When data gaps show up in smaller countries or niche settings, we use proxy indicators such as healthcare expenditure, insured population trends, and provider density to scale assumptions in a consistent way.
Forecasting is run using scenario analysis supported by selective multivariate checks. Adoption curves and pricing progression are stress-tested against macro indicators and interview feedback. Totals are then corroborated using selective bottom-up approximations such as sampled price-per-claim ranges, channel checks on implementation effort, and supplier revenue sanity checks, which helps adjust the top-level number without claiming a full supplier roll-up.
Data Validation & Update Cycle
Validation is done through multiple cross-checks so results stay tied to observable market signals. We compare outputs against independent indicators such as healthcare spend growth, insured population shifts, and digitization pace in payer and provider operations, then investigate any large jumps that cannot be explained by input movements.
Before sign-off, the model and assumptions go through step-by-step analyst reviews. Targeted re-contacts are triggered when interview feedback conflicts with desk findings, or when a region shows unusual variance. The report is refreshed annually, and interim updates are made when material events change demand, pricing, or adoption. Right before delivery, a fresh pass is completed so clients receive the most current view based on the latest available information.
Mordor Intelligence's Healthcare Claims Management Market Estimate Compared With Other Published Estimates
Published market sizes for healthcare claims management can vary a lot because firms do not always count the same workflows, buyers, or revenue streams, even when the market name looks identical. Differences also come from how they treat software versus services, how they time currency conversion, and whether the base year is updated after new policy or utilization data is released.
By tracking claim workflow scope and refreshing assumptions around claim volumes, denial-driven rework, and the software versus services mix, Mordor Intelligence keeps the market size anchored to a clearly defined healthcare claims operations spend pool. This reduces drift when adoption rates or pricing are updated mid-cycle.
Benchmark comparison
| Source | Market Size | Gaps in Research Methodology |
|---|---|---|
| Mordor Intelligence | USD 27.72 B (2025) | |
| Industry Research Publisher A | USD 16.46 B (2025) | Often applies a narrower revenue boundary where only selected claims management use cases are counted, and services intensity is treated conservatively, which can pull down the spend-per-claim implied in the model. |
| Digital Health Publisher B | USD 50.32 B (2025) | Commonly uses a broader bundle that can fold adjacent revenue-cycle functions into claims management and applies aggressive adoption and price progression assumptions, which can inflate the 2025 starting point. |
The spread in the table mainly comes from what is included as claims management versus adjacent revenue-cycle work, and from how fast the model assumes automation expands paid scope. Our approach stays traceable because each input can be linked back to a demand driver like claim throughput, rework pressure, and the mix of software and services, then checked with interview feedback before the forecast is extended.


Key Questions Answered in the Report
What is the current size of the healthcare claims management market?
The market generated USD 32.17 billion in 2026 and is on track to reach USD 67.78 billion by 2031 at a 16.05% CAGR.
Which solution type is growing fastest?
AI-based denial-management modules hold the top growth outlook with an 18.21% CAGR through 2031 as organizations focus on preventing revenue leakage.
Why are cloud deployments becoming dominant?
Cloud platforms deliver elastic compute, real-time analytics, and stronger disaster-recovery capabilities, capturing 59.05% of 2025 spending and expanding at an 18.40% CAGR.
How do claim denials impact hospital finances?
Hospitals spend USD 19.7 billion each year overturning denied claims, and 65% of denials are never resubmitted, making proactive denial avoidance critical.
What role do third-party administrators play?
TPAs are the fastest-growing end-user segment with a 19.15% CAGR as self-funded employers outsource claims tasks and demand transparent, AI-driven analytics.
Which region is expected to see the highest growth?
Asia-Pacific leads with a projected 17.20% CAGR to 2031, driven by expanding insurance coverage and government-backed digital-health investments.
Page last updated on:


